Axon has bounced 16% from its 19 October low of 377.00 and closed Friday at 427.77, back above the 21 EMA. That follows a 42% fall from the August high of 651.61. Momentum has turned up, but the 50 EMA at 451.67 and the 200 EMA near 500 are still overhead, so this is a recovery inside a downtrend for now.
Daily Chart
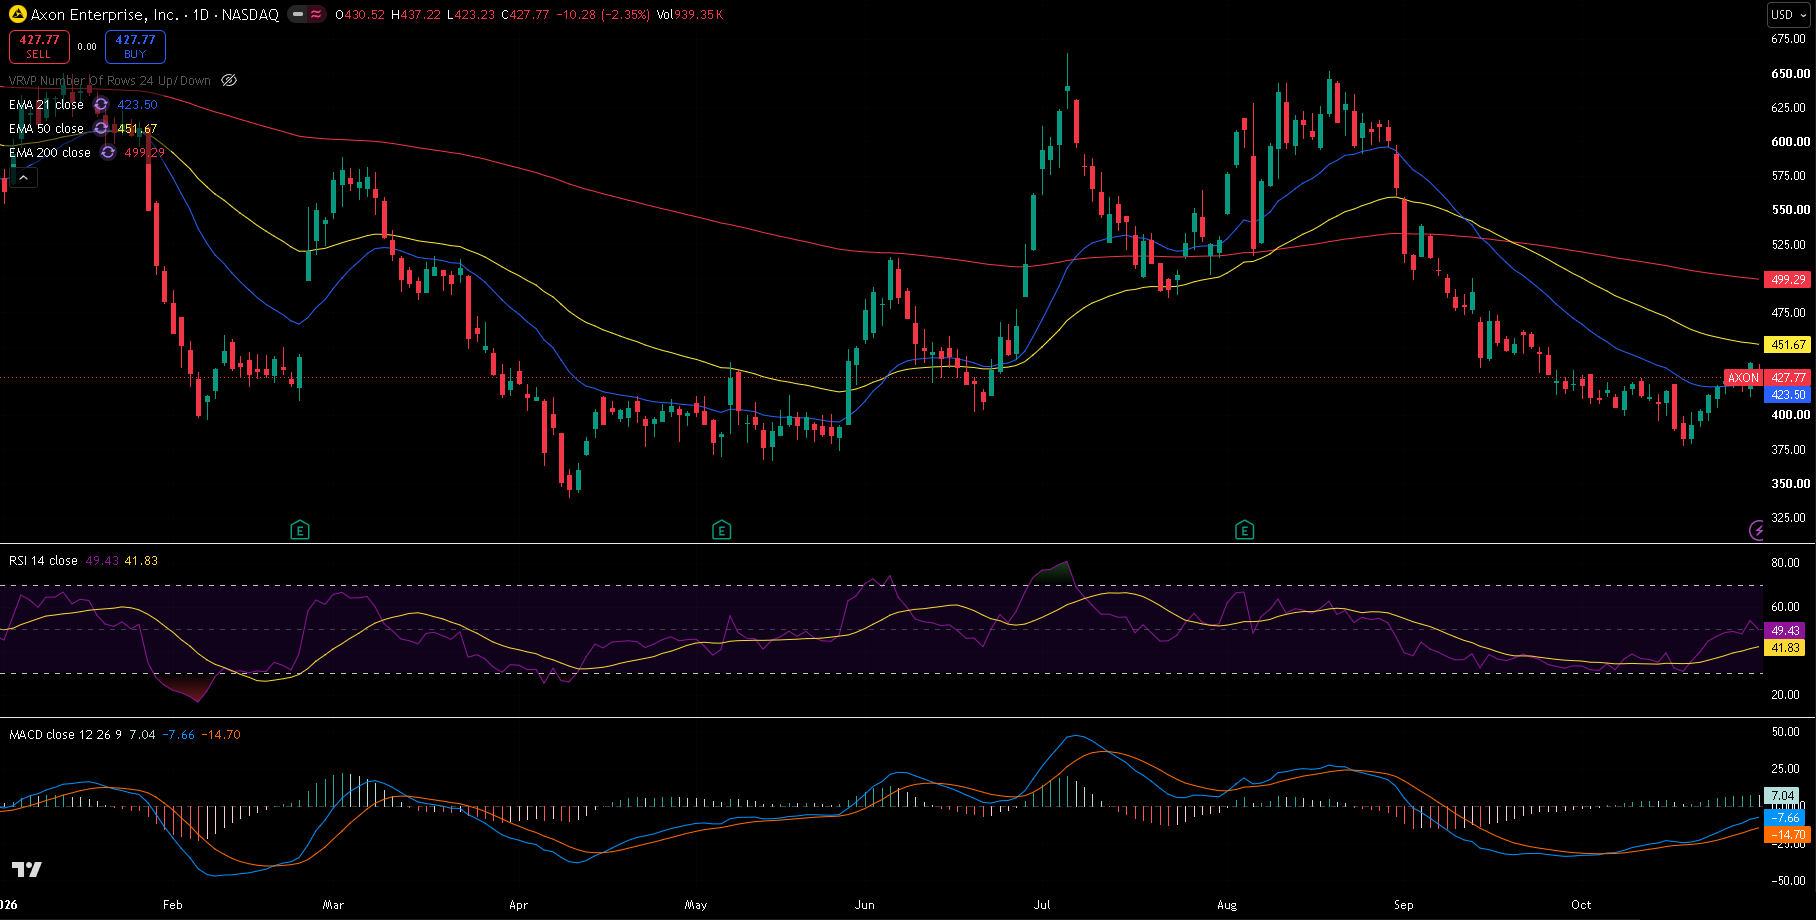
AXON daily chart, 30 October 2026 close — 21/50/200 EMA, RSI(14) with its moving average, and MACD(12,26,9). Price has pushed back above the 21 EMA, with MACD rising towards zero.
Trend and Structure
Axon is a wide-swinging stock: it ran from 339.01 in April to 665.07 in July, held near 650 into August, then fell hard from 651.61 on 19 August to 377.00 on 19 October. Since that low it has risen for most of the last two weeks, reaching 439.02 on Thursday before slipping 2.4% on Friday. Price is now just above the 21 EMA (423.50) but still below the 50 EMA (451.67) and the 200 EMA (499.29), and the 21 is under the 50. The bounce needs to clear 440–452 before the downtrend can be called over.
Key Levels
The level that matters most overhead is 439–452: Thursday's high, the 23.6% retracement (441.81) and the 50 EMA (451.67). Below, the 21 EMA and Friday's low around 423 are the first support.
| Type | Level | Why it matters |
|---|---|---|
| Resistance | 651.61 | 19 August high |
| EMA 200 | 499.29 | Long-term trend |
| Fib 38.2% | 481.90 | Retracement of the August–October fall |
| EMA 50 | 451.67 | Medium-term trend |
| Fib 23.6% | 441.81 | First retracement of the fall |
| Resistance | 439.02 | 29 October high |
| Current | 427.77 | Last close |
| EMA 21 | 423.50 | Short-term trend, reclaimed this week |
| Support | 413.18 | 29 October low |
| Support | 377.00 | 19 October low |
| Support | 366.00 | 14 May low |
| Support | 339.01 | 10 April low, the 2026 low |
Fibonacci levels are drawn from the 19 August high at 651.61 to the 19 October low at 377.00.
Momentum and Volume
RSI(14) is at 49.43, back up near the midpoint and above its own average of 41.83. MACD is at -7.66 against a signal line of -14.70, a histogram of +7.04: still below zero, but rising steadily since the low. Volume has been quiet, around 0.7–0.9 million shares a day against a 20-day average of about 1 million, so the bounce has not yet drawn heavy buying.
Bull Case
Price holds above the 21 EMA and closes above the 50 EMA at 451.67. That would clear the first resistance band and open the 38.2% level at 481.90, then the 200 EMA near 499.
Bear Case
The bounce fails under 440–452 and price closes below Thursday's 413.18 low. That would point back to the 377.00 low, and below that the May and April lows at 366.00 and 339.01.
Trade Scenarios
| Direction | Trigger | Stop | Target |
|---|---|---|---|
| Long | Daily close above 451.67 | 420.00 | 481.90, then 499.29 |
| Short | Daily close below 413.18 | 440.00 | 377.00, then 339.01 |
Risk warning: Technical analysis reflects probability, not certainty. Levels are reference points, not signals. Capital at risk. This is educational content, not investment advice.