Coca-Cola has been one of the steadiest uptrends of 2026, rising from 67.27 in January to a high of 95.37 on 22 October. Last week's dip held above 90.58 and Friday closed up 1.4% at 94.08, just under that high. The trend is up; a close above 95.37 would clear the way to new highs.
Daily Chart
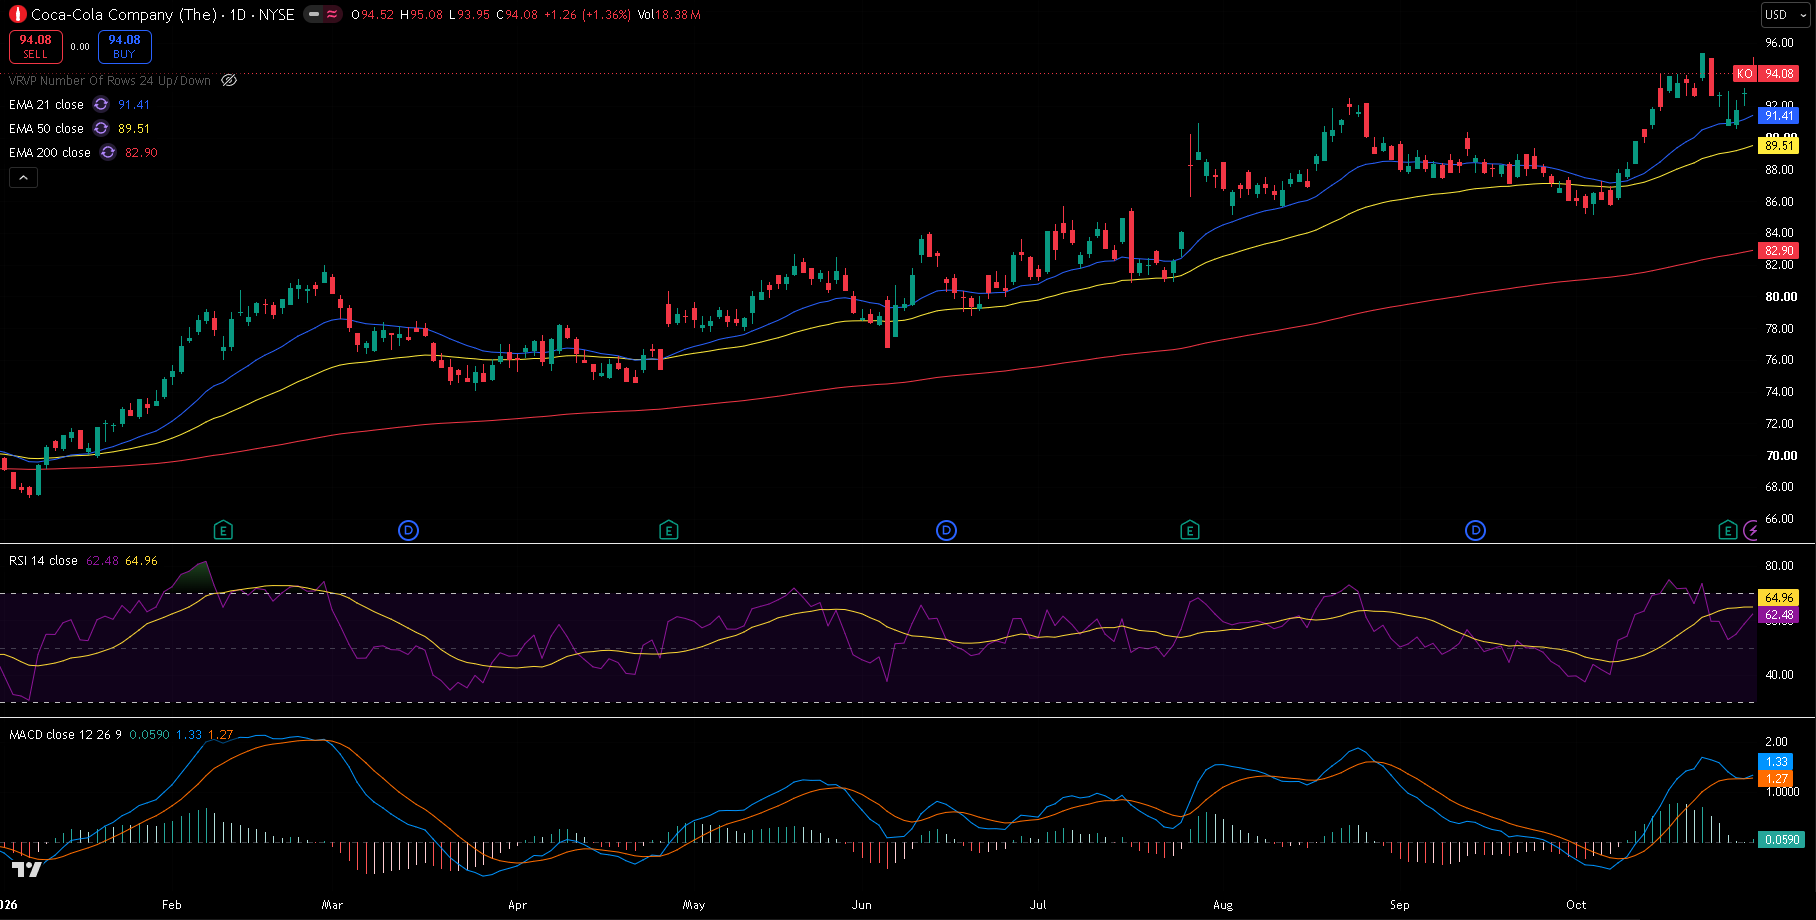
KO daily chart, 30 October 2026 close — 21/50/200 EMA, RSI(14) with its moving average, and MACD(12,26,9). A year of higher highs and higher lows, with the EMAs stacked and rising.
Trend and Structure
Coca-Cola has climbed in steps all year, with each pullback finding buyers above the last: 74.07 in March, 76.81 in June, 85.16 in August and 85.13 on 5 October. October's push took it to 95.37, and the dip that followed bottomed at 90.58 on 28 October, holding above the 21 EMA zone. The EMAs are lined up bullishly — 21 (91.41) above 50 (89.51) above 200 (82.90) — and all three are rising.
Key Levels
The level that matters most is 95.37, the 22 October high. Below, the 21 EMA and 38.2% retracement around 91.4 and last week's low at 90.58 are the first support.
| Type | Level | Why it matters |
|---|---|---|
| Fib 127.2% | 98.16 | Extension of the October rally |
| Resistance | 95.37 | 22 October high, the 2026 high |
| Current | 94.08 | Last close |
| Fib 38.2% | 91.46 | With the 21 EMA at 91.41 |
| Support | 90.58 | 28 October low |
| EMA 50 | 89.51 | Medium-term trend |
| Fib 61.8% | 89.04 | Deeper retracement of the October rally |
| Support | 87.41 | 9 September low |
| Support | 85.13 | 5 October low, start of the latest leg |
| EMA 200 | 82.90 | Long-term trend |
Fibonacci levels are drawn from the 5 October low at 85.13 to the 22 October high at 95.37.
Momentum and Volume
RSI(14) is at 62.48, positive and not stretched. MACD is at 1.33 against a signal line of 1.27, a histogram of +0.06: above zero and just turning back up after last week's dip. Friday's 18.4 million shares was a little above the 20-day average of about 16.7 million.
Bull Case
Price closes above 95.37, extending the year-long run of higher highs. The 127.2% extension of the October rally at 98.16 is the next measured target.
Bear Case
A daily close below last week's 90.58 low would break the short-term structure. The 9 September low at 87.41 and the 5 October low at 85.13 come next, with the 200 EMA at 82.90 below.
Trade Scenarios
| Direction | Trigger | Stop | Target |
|---|---|---|---|
| Long | Daily close above 95.37 | 91.80 | 98.16 |
| Short | Daily close below 90.58 | 94.50 | 87.41, then 85.13 |
Risk warning: Technical analysis reflects probability, not certainty. Levels are reference points, not signals. Capital at risk. This is educational content, not investment advice.