Carvana jumped 15.7% on Thursday, gapping from 59.05 to close at 68.31 on more than twice its usual volume, and held the gain on Friday at 68.29. That lifted the stock off a triple bottom near 56 and back above all three EMAs. The gap between 60.45 and 63.81 is now the support to watch.
Daily Chart
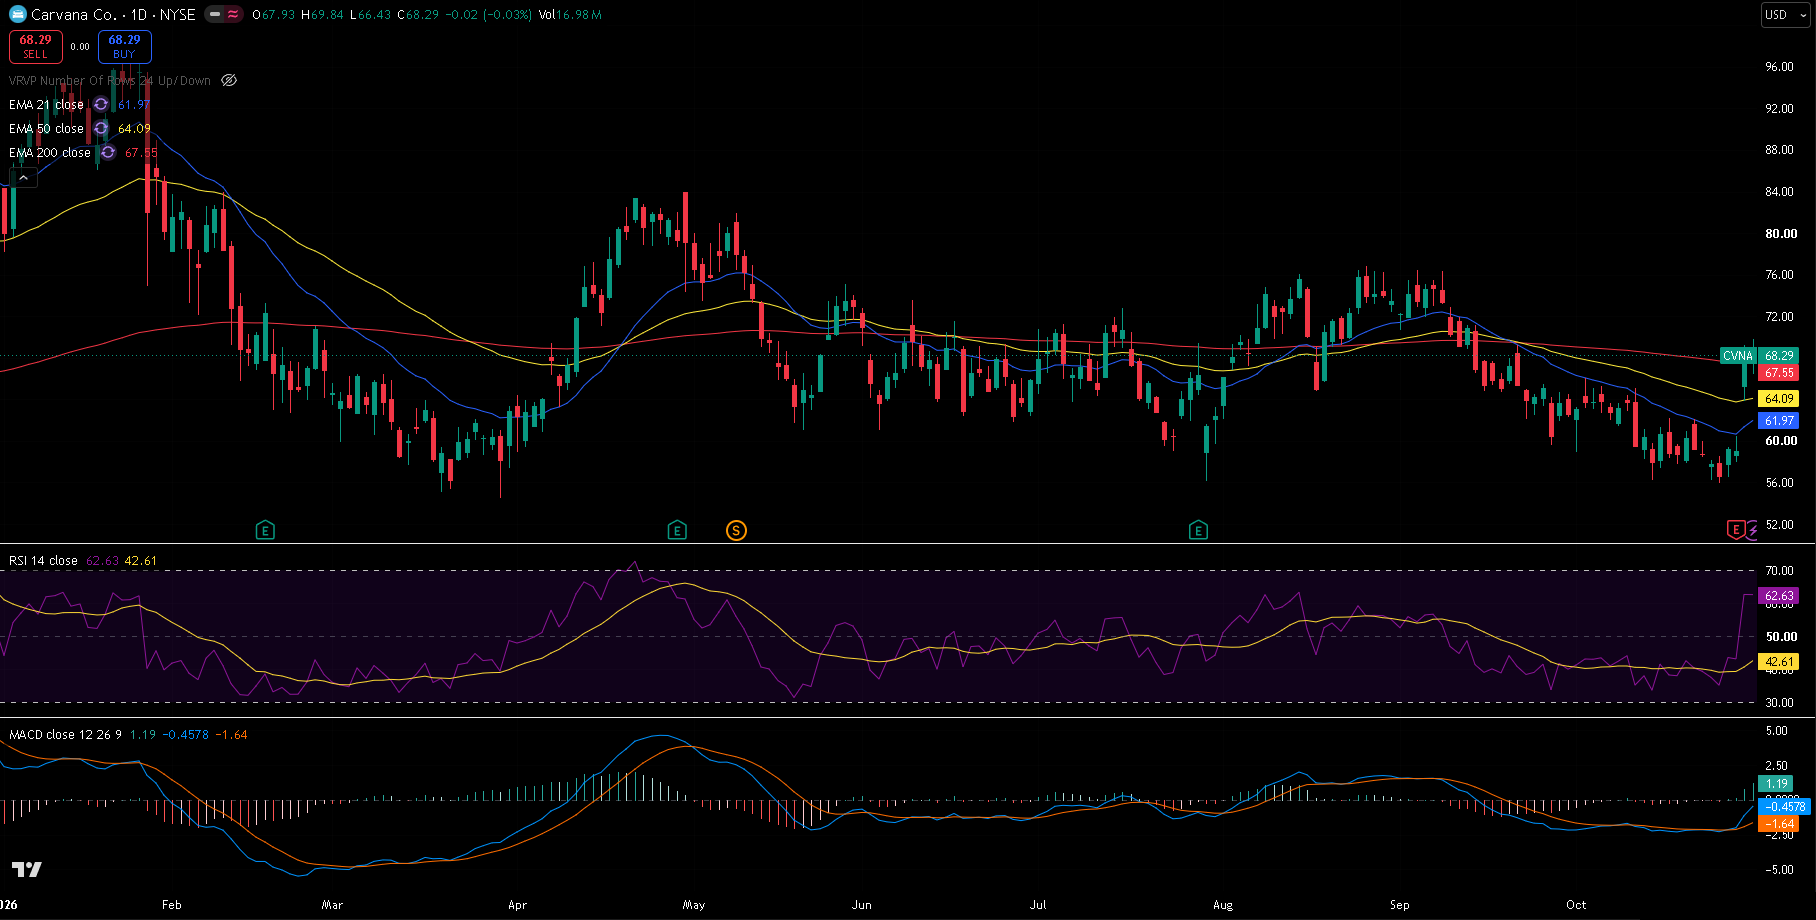
CVNA daily chart, 30 October 2026 close — 21/50/200 EMA, RSI(14) with its moving average, and MACD(12,26,9). Thursday's gap lifted price from near the year's lows to just above the 200 EMA.
Trend and Structure
Carvana has spent most of 2026 in a wide range, with the lows holding in the mid-50s: 54.46 on 30 March, 56.12 on 30 July, 56.27 on 14 October and 55.91 on 26 October. Thursday's gap took price straight from that floor to above the 21 EMA (61.97), the 50 EMA (64.09) and the 200 EMA (67.55). The EMAs themselves are still stacked the wrong way, with the 21 below the 50 and the 50 below the 200, so the longer trend has not turned yet. What matters now is whether the gap holds.
Key Levels
The level that matters most is the gap between 60.45 and 63.81. Overhead, Friday's 69.84 high and the July high at 72.77 are the next tests.
| Type | Level | Why it matters |
|---|---|---|
| Resistance | 83.91 | 30 April high |
| Resistance | 76.80 | 26 August high; with 76.44 on 3 September |
| Resistance | 72.77 | 16 July high |
| Resistance | 69.84 | Friday's high |
| Current | 68.29 | Last close |
| EMA 200 | 67.55 | Long-term trend, reclaimed on Thursday |
| EMA 50 | 64.09 | Medium-term trend |
| Support | 63.81 | Thursday's low, top of the gap |
| EMA 21 | 61.97 | Short-term trend |
| Support | 60.45 | 28 October high, bottom of the gap |
| Support | 55.91 | 26 October low; with 56.27 and 56.12 earlier |
| Support | 54.46 | 30 March low, the 2026 low |
Momentum and Volume
RSI(14) jumped to 62.63, well above its own average of 42.61. MACD is at -0.46 against a signal line of -1.64, a histogram of +1.19, and is close to crossing above zero. Thursday traded 23.2 million shares and Friday 17.0 million, against a 20-day average of about 9.6 million — heavy buying, and Friday's volume showed it was not a one-day event.
Bull Case
The gap holds and price closes above Friday's 69.84 high. That opens the 16 July high at 72.77, then the August–September highs near 76.80.
Bear Case
A daily close below Thursday's 63.81 low would start to fill the gap and put the move in doubt. A full fill to 60.45 would bring the 55.91–56.27 floor back into view.
Trade Scenarios
| Direction | Trigger | Stop | Target |
|---|---|---|---|
| Long | Daily close above 69.84 | 63.50 | 72.77, then 76.80 |
| Short | Daily close below 63.81 | 70.00 | 60.45, then 55.91 |
Risk warning: Technical analysis reflects probability, not certainty. Levels are reference points, not signals. Capital at risk. This is educational content, not investment advice.