Each week we give MetaStock a real job and show the screens exactly as they came out. This week: a breakout scan across the whole S&P 500 using the Explorer. It ran on 5 November 2026, on prices to the US close on 4 November, and took under two minutes.
What the scan looks for
A stock breaks out when it closes above a price it has not got past for a while. We used two simple rules:
- The close is above the highest high of the previous 20 trading days.
- Volume is at least 1.5 times its 50-day average, so the move has real buying behind it.
That is all. It is a quick way to find charts worth a closer look, not a list of trades.
Writing the exploration
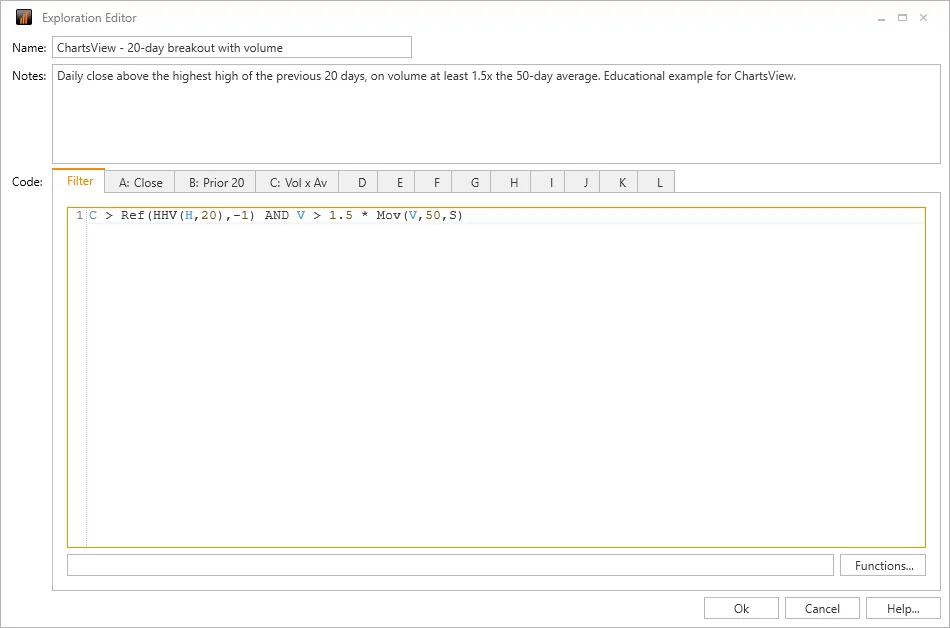
In MetaStock, open the Explore tab on the left, click New Exploration and give it a name. The rules go in the Filter tab:
C > Ref(HHV(H,20),-1) AND V > 1.5 * Mov(V,50,S)
HHV(H,20) is the highest high of the last 20 days. Ref(…,-1) moves that back one day, so today’s own high is left out. Without it, the close could never beat the level, because today’s high is always at least as high as today’s close. Mov(V,50,S) is the simple 50-day average of volume.
Columns put useful numbers next to each stock that passes. We added three:
- A, Close:
C - B, the prior 20-day high:
Ref(HHV(H,20),-1) - C, volume against its average:
V / Mov(V,50,S)
MetaStock cuts column names to eight characters, which is why the results show “Prior 20” and “Vol x Av”.
Choosing what to scan
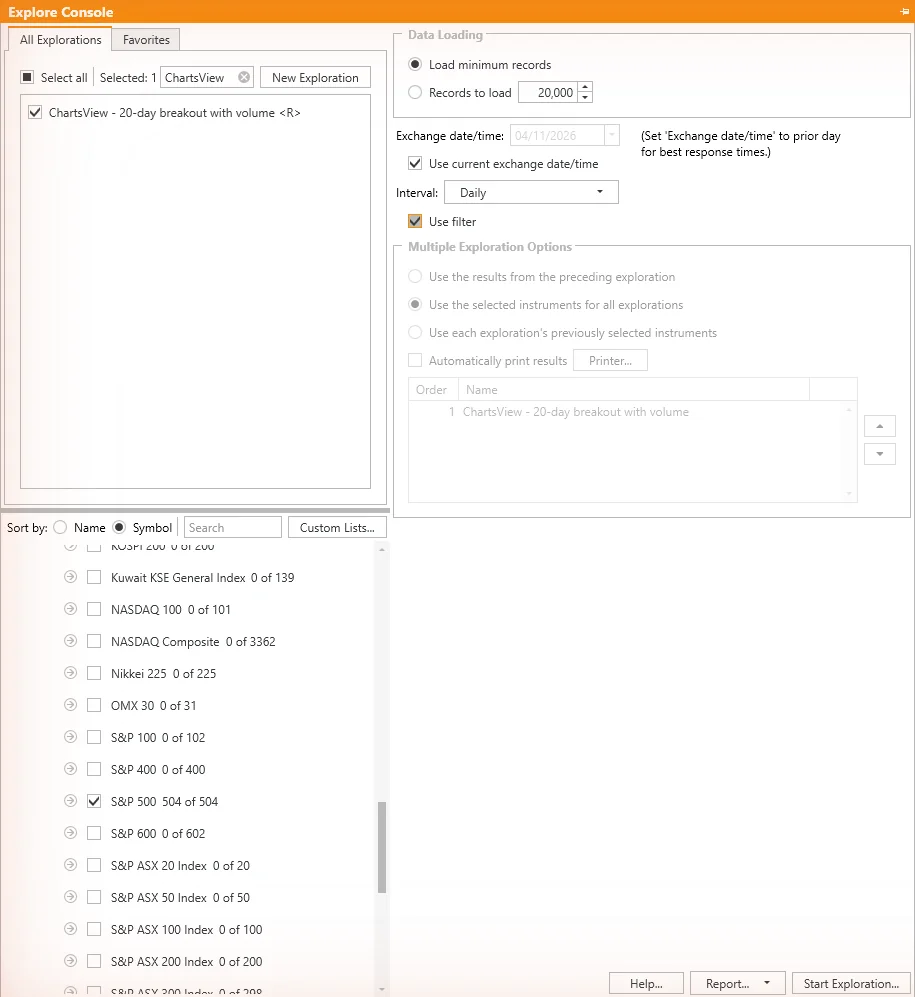
Back in the Explore Console, tick the new exploration, set Interval to Daily and tick Use filter. Under Public Online Data Lists, then Index Constituents, tick S&P 500 (504 stocks). Load minimum records is enough here, because the longest look-back in the formula is 50 days.
One trap: if Use filter is left unticked, MetaStock skips the filter and lists every stock with its column values. Our first run did exactly that and returned almost the whole index.
The results
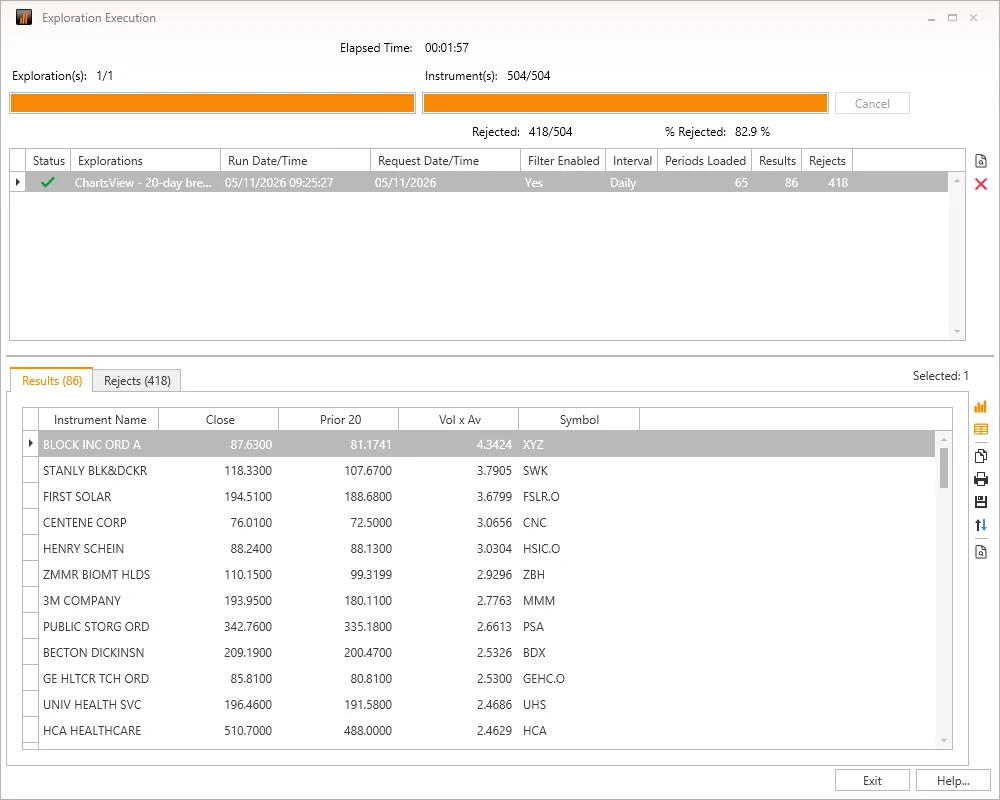
MetaStock checked all 504 stocks in 1 minute 57 seconds. 86 passed and 418 did not. Clicking the “Vol x Av” heading sorts the list so the heaviest volume comes first:
| Stock | Close ($) | Prior 20-day high ($) | Volume vs average |
|---|---|---|---|
| Block (XYZ) | 87.63 | 81.17 | 4.3x |
| Stanley Black & Decker (SWK) | 118.33 | 107.67 | 3.8x |
| First Solar (FSLR) | 194.51 | 188.68 | 3.7x |
| Centene (CNC) | 76.01 | 72.50 | 3.1x |
| Henry Schein (HSIC) | 88.24 | 88.13 | 3.0x |
Two things stand out. First, 86 stocks is about one in six of the index. When that many pass on the same day, sorting by volume does a lot of the work, because it pushes the strongest moves to the top. Second, look at Henry Schein: it closed just 11 cents above its prior high. It passes the rule, but only just. The columns let you see that straight away without opening the chart.
Checking the chart
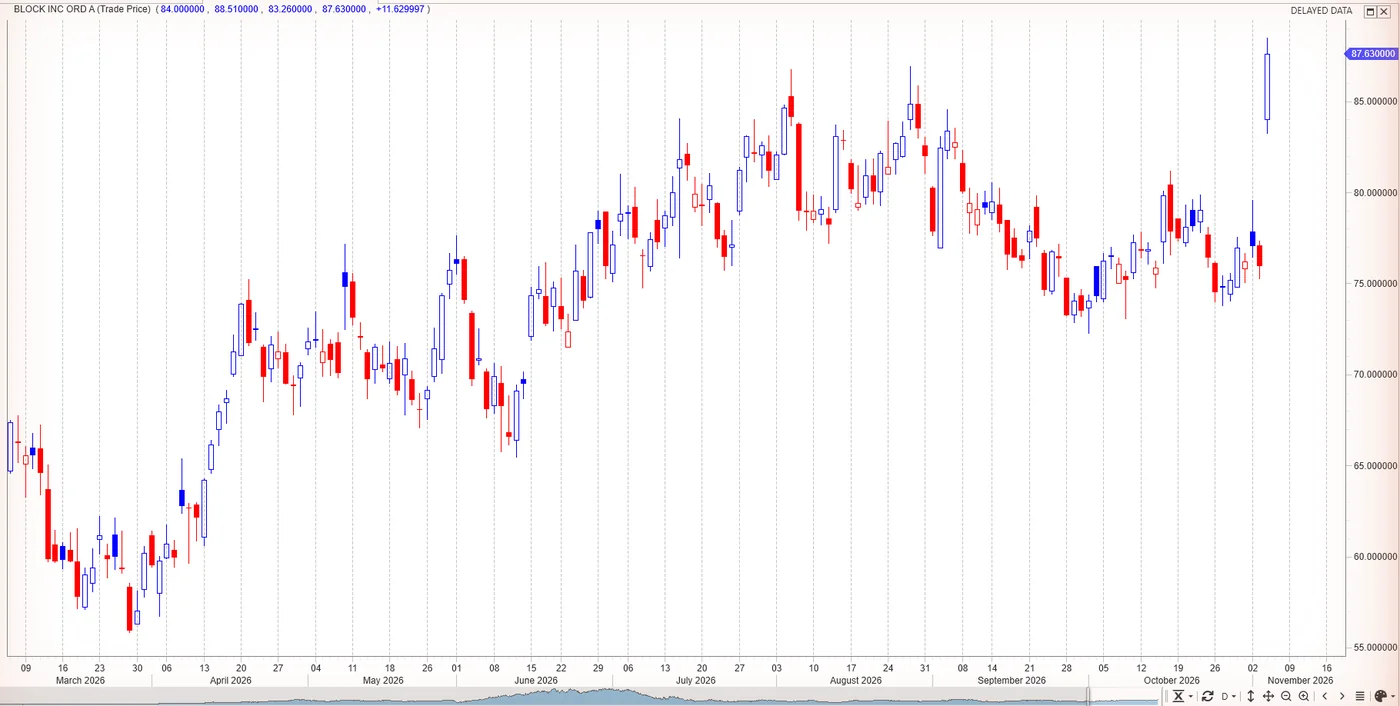
The chart button on the right of the results window opens the selected stock straight away. Here is Block on a daily chart. On 4 November it opened at 84.00, traded between 83.26 and 88.51, and closed at 87.63, up 11.63 from the previous close of 76.00. It finished around the August highs, the top of the range on this chart.
A scan finds candidates. Before trading one, ask three questions:
- Did it break a level that mattered, or just a recent wobble?
- Is it a big gap on news that could fade over the next few days?
- Where would the stop go? The prior 20-day high of 81.17 is about 7% below the close, so a stop under it is a wide one. Size the trade to suit.
Make it a routine
The exploration is saved, so next time it is two clicks: tick it and press Start Exploration. Run it after the US close, open the top few charts, and note which breakouts follow through over the next couple of weeks. That record will tell you more than any single scan.
For more detail on breakout rules and extra columns, see our step-by-step breakout scan guide. To compare the MetaStock versions, see our charting software page.
Try it yourself
The Explorer, the index lists and the chart button shown here are all in the MetaStock 30-day free trial.
Affiliate note: ChartsView may earn a commission if you start a MetaStock trial through our link. It does not change the price you pay. This article is education, not a recommendation to buy or sell any stock. Breakouts often fail, and your capital is at risk.