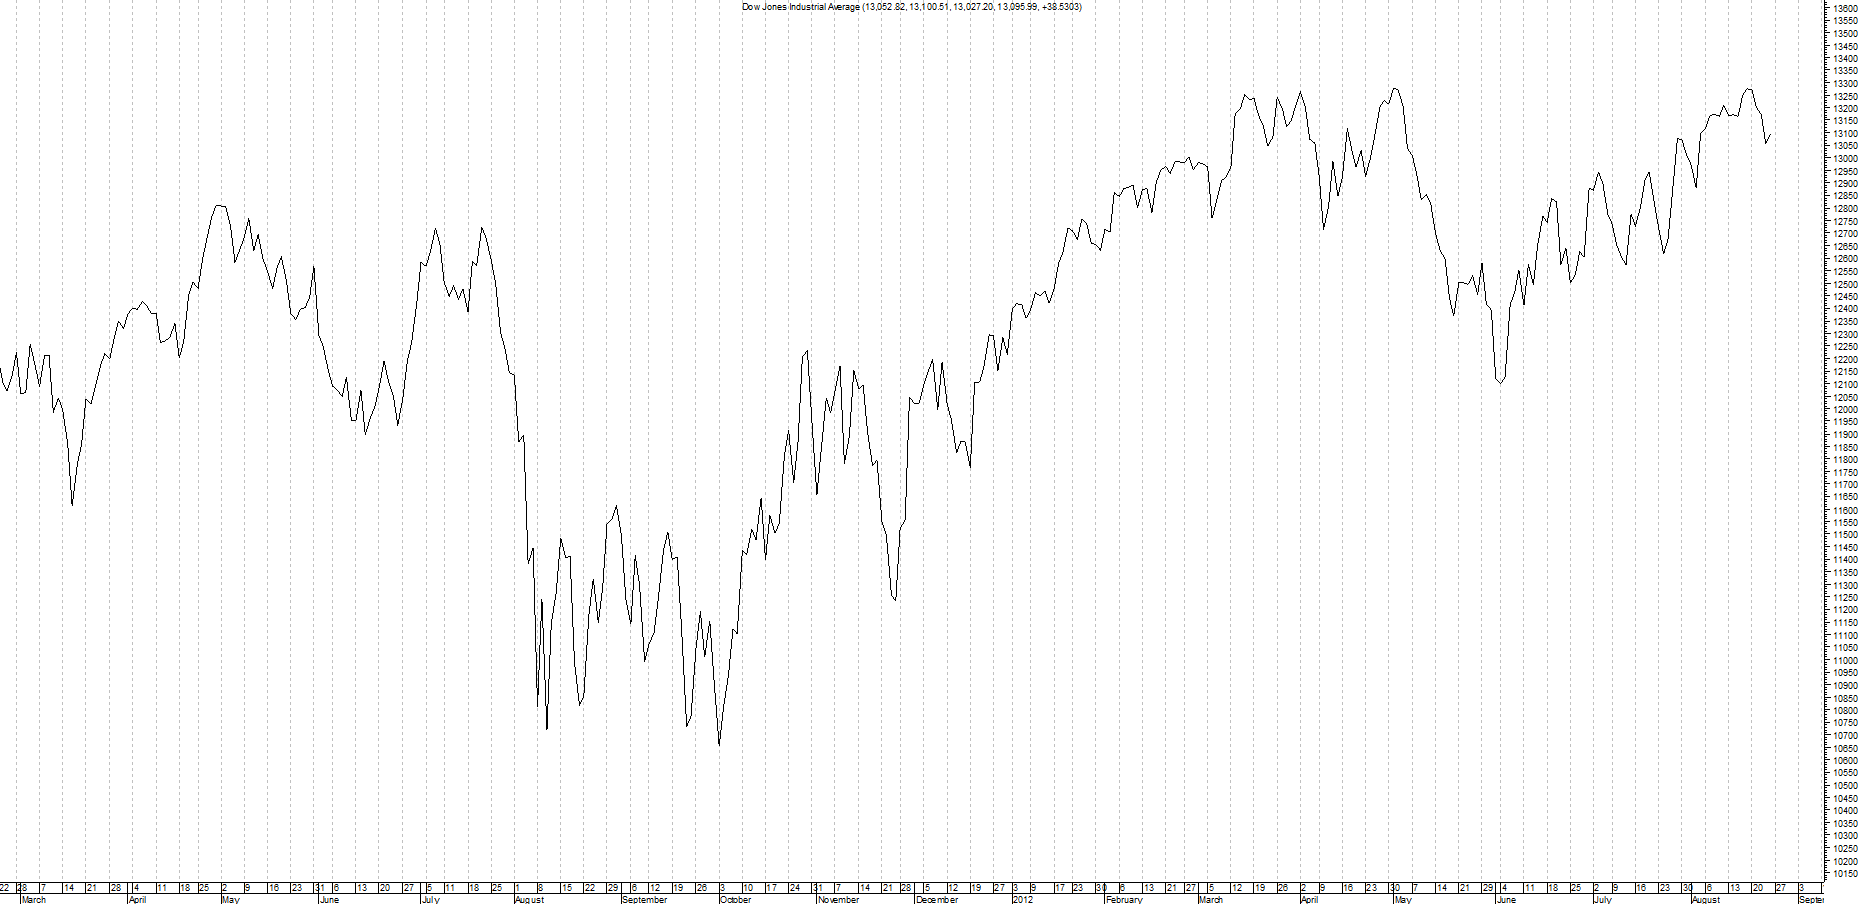
A line chart is the simplest way to show price. It joins up the closing prices with a single line. There is no open, high or low, just the close. That makes line charts easy to read and great for seeing the big picture, but they leave out detail that active traders often need.
How a line chart is drawn
Each point on the line is a closing price. On a daily chart, that is the close of each day; on a weekly chart, the close of each week; on an hourly chart, the close of each hour. The points are joined together to make the line.
Many traders see the close as the most important price of the session, because it is where buyers and sellers finally agreed. That is why the line chart uses it.
Strengths of line charts
- Very easy to read, even for complete beginners.
- They cut out the noise of intraday spikes, so trends and big turning points stand out.
- They are good for comparing several markets on one chart.
- Some traders draw support, resistance and trend lines on closing prices only, and a line chart makes that easy.
Weaknesses of line charts
- No highs or lows, so you cannot see how far the price travelled during the session.
- No opening price, so you cannot see whether buyers or sellers won the session.
- Stop losses are hit by highs and lows, not closes, so you need a bar or candlestick chart to place them sensibly.
- Gaps between sessions are hidden.
When to use one
Use a line chart to get the big picture: the long-term trend, major turning points and how one market compares with another. Then switch to a bar chart or a candlestick chart when you are planning an actual trade, so you can see the full range of each session. Our guide to types of charts compares all the main options.
Related guides
This guide is for education only and is not financial advice. Trading carries risk; you can lose more than you expect.