- Posts: 3195
- Thank you received: 5674
FTSE 100 top pick
11 years 3 weeks ago #12551
by remo
Replied by remo on topic FTSE 100 top pick everyday
This one does look weak as broken through its main trend line recently hence the drop.Also went through the 200ema at the same time.
what time frame are you using on your chart?? as it looks different from my chart

dl.dropboxusercontent.com/u/4899609/bats4thjune2015.png
what time frame are you using on your chart?? as it looks different from my chart
dl.dropboxusercontent.com/u/4899609/bats4thjune2015.png
Please Log in or Create an account to join the conversation.
- tayalsmith1
-
 Topic Author
- Offline
- Fresh Boarder
-

Less
More
- Posts: 80
- Thank you received: 16
11 years 3 weeks ago #12546
by tayalsmith1
Replied by tayalsmith1 on topic FTSE 100 top pick everyday
BRITISH AMERICAN TOBACCO PLC
SELL
TARGET 3420
Support level 3490
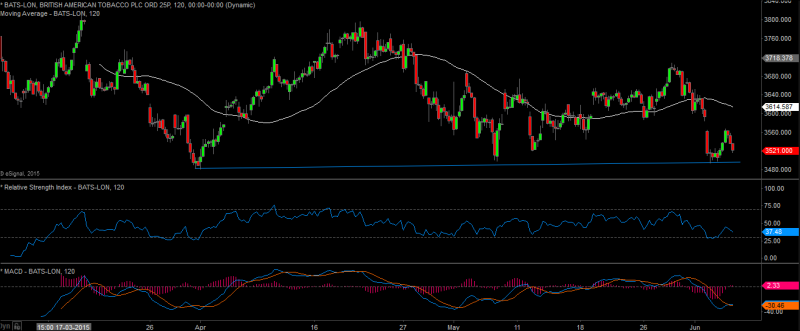
CHART FORMATION:-
Stock is trading in a range and trading near the trend line. Breaking the support line will lead to downside movement. Stock is trading below the 50 DMA with negative bias.
Skype tayal.smith1
SELL
TARGET 3420
Support level 3490
CHART FORMATION:-
Stock is trading in a range and trading near the trend line. Breaking the support line will lead to downside movement. Stock is trading below the 50 DMA with negative bias.
Skype tayal.smith1
Please Log in or Create an account to join the conversation.
11 years 3 weeks ago #12543
by remo
Replied by remo on topic FTSE 100 top pick
good to see someone else having the courage to predict shares movements 
Not many people can do this .People do it after the event.
Ive been doing this for years now and no one else has really joined in trying.Plenty do this on indexes on the live chat rooms but not really in here. Good to see .I dont feel so lonely now
Not many people can do this .People do it after the event.
Ive been doing this for years now and no one else has really joined in trying.Plenty do this on indexes on the live chat rooms but not really in here. Good to see .I dont feel so lonely now
Please Log in or Create an account to join the conversation.
- tayalsmith1
-
Topic Author
- Offline
- Fresh Boarder
-
Less
More
- Posts: 80
- Thank you received: 16
11 years 3 weeks ago #12542
by tayalsmith1
Replied by tayalsmith1 on topic FTSE 100 top pick
I am selling
JOHNSON MATTHEY PLC
(LON:JMAT)
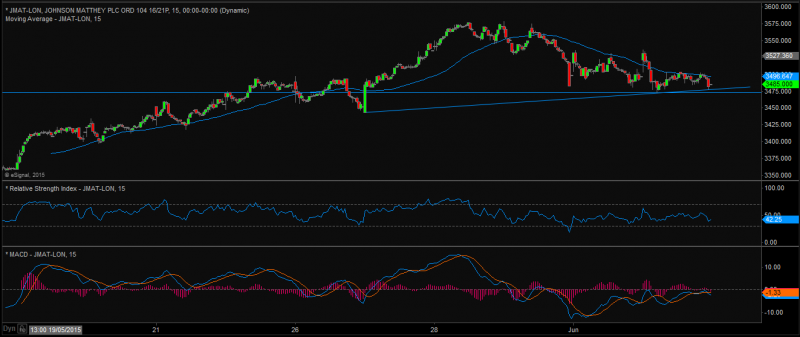
TARGET 3445
Support level of 3475
INDICATORS:-
RSI is trading at 42.25 level with -ve bias, in coming session downward move is expected.
MACD and Signal line below the zero level line.
Skype tayal.smith1
TARGET 3445
Support level of 3475
INDICATORS:-
RSI is trading at 42.25 level with -ve bias, in coming session downward move is expected.
MACD and Signal line below the zero level line.
Skype tayal.smith1
Please Log in or Create an account to join the conversation.
- tayalsmith1
-
Topic Author
- Offline
- Fresh Boarder
-
Less
More
- Posts: 80
- Thank you received: 16
11 years 3 weeks ago - 11 years 3 weeks ago #12539
by tayalsmith1
Replied by tayalsmith1 on topic FTSE 100 top pick
SPORTS DIRECT INTERNATIONAL PLC (LON:SPD)
SELL
TARGET 665.50
If it breaks the support level then one can initiate the selling position in the stock. If it breaks the level of 671.50 then it can show downside movement for the target of 665.50 with the stop loss of 677.50.
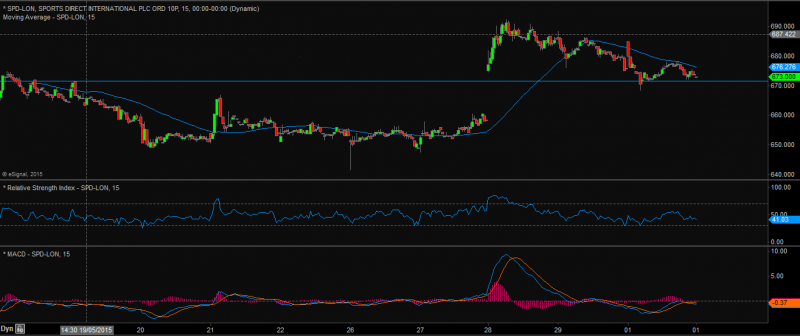
INDICATORS:-
RSI is trading near to 41.03 level with negative bias, in upcoming session downside movement is expected.
MACD and Signal line is sustaining below the zero level line.
Skype tayal.smith1
SELL
TARGET 665.50
If it breaks the support level then one can initiate the selling position in the stock. If it breaks the level of 671.50 then it can show downside movement for the target of 665.50 with the stop loss of 677.50.
INDICATORS:-
RSI is trading near to 41.03 level with negative bias, in upcoming session downside movement is expected.
MACD and Signal line is sustaining below the zero level line.
Skype tayal.smith1
Last edit: 11 years 3 weeks ago by tayalsmith1.
Please Log in or Create an account to join the conversation.
- tayalsmith1
-
Topic Author
- Offline
- Fresh Boarder
-
Less
More
- Posts: 80
- Thank you received: 16
11 years 3 weeks ago #12534
by tayalsmith1
FTSE 100 top pick was created by tayalsmith1
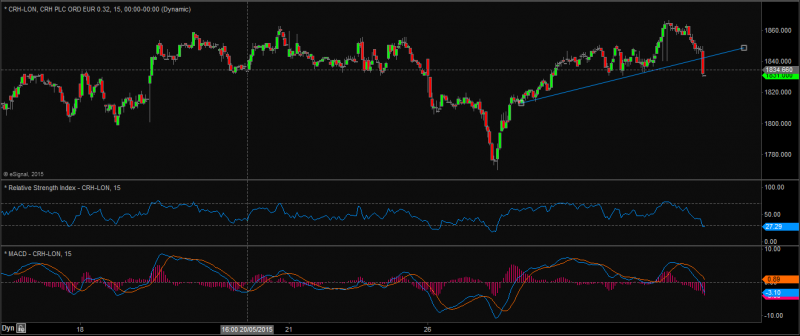
CRH PLC
SELL
TARGET 1812
It has support level of 1830. If it breaks this level then it can show further movement for Target level 1812
CHART FORMATION:-
Stock is trading in a range and line will lead to downside movement. Stock is trading below the 50 DMA with negative bias.
Skype tayal.smith1
SELL
TARGET 1812
It has support level of 1830. If it breaks this level then it can show further movement for Target level 1812
CHART FORMATION:-
Stock is trading in a range and line will lead to downside movement. Stock is trading below the 50 DMA with negative bias.
Skype tayal.smith1
Please Log in or Create an account to join the conversation.
Moderators: remo
Time to create page: 0.087 seconds