
- Posts: 202
- Thank you received: 197
XAR - interesting oxymoronic chart
13 years 5 months ago #2944
by AdeMcG
Replied by AdeMcG on topic XAR - interesting oxymoronic chart
Nice post, and does illustrate the need to view TA from differing time scales, even the extremes of log scales can paint a different picture.
I know it is something I have tried to do more of before hitting the "buy" button.
I know it is something I have tried to do more of before hitting the "buy" button.
Please Log in or Create an account to join the conversation.

13 years 5 months ago #2943
by gclark25
XAR - interesting oxymoronic chart was created by gclark25
Oxymoronic is totally not a word!!!
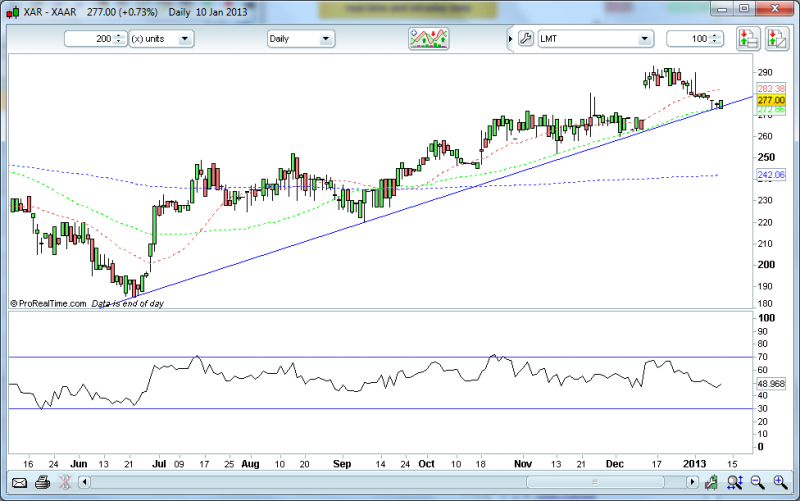
Anyway, came across this chart, and thought - GREAT example of a bullish engulfing candle on the daily. Right on a supporting trendline too - in days of old, its possibly a chart I would have went long on immediately.
Then I had a look at the weekly, and very basic chart I know, but it could be a possible double top. That kind of skews the risk to reward for me as it increases the risk massively imo. In fact, I still think it may retest 292/293 area, but the indications are that would be the top. The RSI looks fairly week aswell.
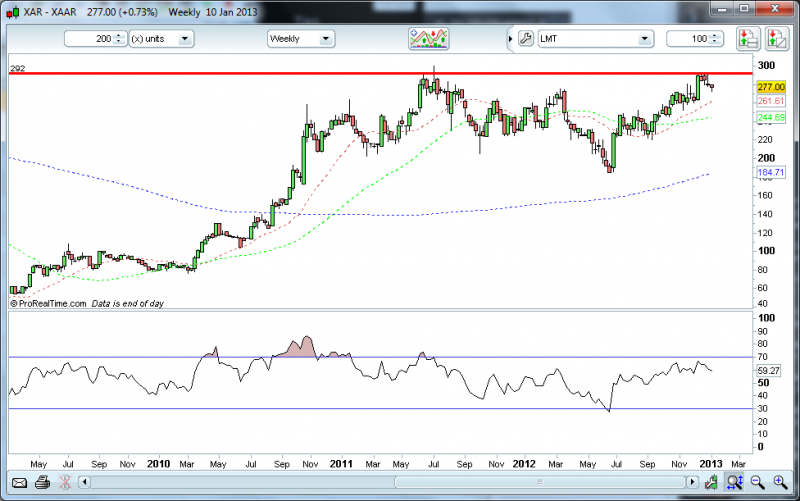
Anyway, thought it was an interesting combo of timeframes, and is another example on why you should always check more than one time frame. In this scenario, I would look at the Daily for the basic trend and trading ideas, the weekly for the overall picture, and then the 4h (maybe even 1H candles aswell) for the timing of the trade.
Thought it was worth posting anyway.
Anyway, came across this chart, and thought - GREAT example of a bullish engulfing candle on the daily. Right on a supporting trendline too - in days of old, its possibly a chart I would have went long on immediately.
Then I had a look at the weekly, and very basic chart I know, but it could be a possible double top. That kind of skews the risk to reward for me as it increases the risk massively imo. In fact, I still think it may retest 292/293 area, but the indications are that would be the top. The RSI looks fairly week aswell.
Anyway, thought it was an interesting combo of timeframes, and is another example on why you should always check more than one time frame. In this scenario, I would look at the Daily for the basic trend and trading ideas, the weekly for the overall picture, and then the 4h (maybe even 1H candles aswell) for the timing of the trade.
Thought it was worth posting anyway.
Please Log in or Create an account to join the conversation.
Moderators: remo
Time to create page: 0.098 seconds