
- Posts: 199
- Thank you received: 267
BOR
11 years 10 months ago #10874
by gclark25
Again, posted on the BOR bb, so some of the terms/language is more aimed at them than you guy, but in the spirit of sharing FWIW.
Have a wee look at the 4H short term chart if you have the time:
dl.dropboxusercontent.com/u/63552262/Cha...4H_-_20-8-14_001.png
Firstly, note the break of the intermediate descending channel. It smashed through it over the last 2 days without much resistance. That's a good sign and is directly linked to the buying pressure volume. The next resistance is the predominant trendline shown as yellow in the chart. Note however the clear bullish break of the RSI trendline. Again, very bullish sign.
Take a minute out to look at the consistency of the RSI trendline pattern. Firstly the ascending trendline (which has 5 touches to it to prove its validity) is what we call bullish divergence. While the price action was supported horizontally, the RSI baseline was on the way up. Couple that with bullish blue trendline on the RSI along with the lower highs (LH's) on the chart, and this is another sign of bullish divergence. This all points towards the reversal.
The bright green/red lines are what I believe (roughly speaking) could happen to the share price over the next month or so.
Firstly I do think we will find some form of resistance in and around the 13.159 area where the 50% fib correlates with the descending trendline (yellow). From there a move back down towards the previous trendline and/or the 200sma or 23.6% fib is possible. Again, if that happens and it bounces and finds good support in this area, it's a good thing. Supports are necessary and have to be determined. From there a move back towards the 15/16 area is on after a clean break of the yellow descending trendline. It MAY happen in stages, or it could just fly off the handle. It really depends on the timing of news etc.
My personal view is bullish on the price action in and around this area though, it's paving the way for a nice move towards the targets identified in my post yesterday. I fully believe the game is on and the price action and noise behind the scenes are all pointing towards this.
I won't lie, risk to reward for me is everything in my strategy now, and the R:R shown here is very appealing.
Please Log in or Create an account to join the conversation.
11 years 10 months ago - 11 years 10 months ago #10854
by gclark25
Posted this elsewhere guys, but since it's partly chart related...
Ironically, I heard a 3rd hand whisper from my old source, but didn't pay much attention to it because my head has been mostly in the trading. That said, I trust my guy completely and was always spot on before, especially re. FI's etc.
Took a wee look at the charts and there are a few interesting developments chart wise FWIW.
On the short term charts there is clear bullish divergence on the RSI/MACD etc. This will tie in with your liquidity testing I assume.
If you note on the Daily chart (below) - you will see the price has formed a wedge formation with lower highs but supported lows. Now take a look at the RSI. The RSI is forming higher lows, and whilst it was maintaining the lower highs for a while, it has now broken out of this channel on the upside.
This is exactly the type of signal I see time again when back testing charts to show a reversal in trend/momentum.
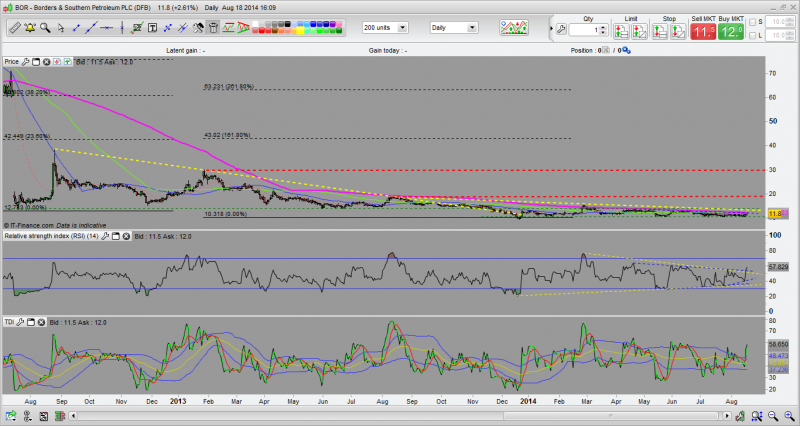
dl.dropboxusercontent.com/u/63552262/Cha..._Daily_-_18-8-14.png
There are a few area's worth noting here. In the case that we are right with the above fundamentals and buying in the background, if this was to go on a benny ala Argos, these targets could easily come into play. I will be keeping an eye on the 19/20 and the 29/30 area's in particular. Of course, along the way there are a couple of softer resistances on the way up, but given the right momentum, I believe the price will smash through these, and the RSI action is the first indication of this imo.
One other really interesting thing to note, longer term, is a target given on the weekly timeframe.
I'm a big believer in confluence. This is the merging of several supports/resistances together in a similar area. The more confluence the better, with the simple explanation being that a market is almost self prophesying in that the more area's in common that traders see, the more chance of those area's being traded. On the weekly chart below, one of those area's is the 41/44 area.
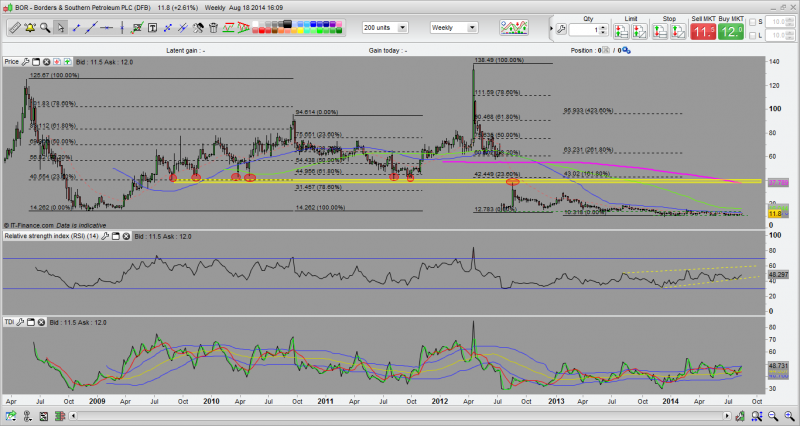
dl.dropboxusercontent.com/u/63552262/Cha...luence_-_18-8-14.png
The first obvious resistance is the major high after the gap down in Aug 2012. But please note the amount of Fibonacci confluence that is found. Firstly the 23.6% retracement of the 2008 swing high to swing low, following the 61.8% retrace from the swing low in late 2008 to the swing high in 2010. Again there is another 23.6% fib retracement from the swing high in 2012 to the swing low in the same year. Add a 161.8% fib area from the swing high in Jan 2013 to the swing lows of this year.
If this isn't enough, look at how often price action used this area as an area of support/resistance.
Imo, BOR will see this price again.
Ironically, I heard a 3rd hand whisper from my old source, but didn't pay much attention to it because my head has been mostly in the trading. That said, I trust my guy completely and was always spot on before, especially re. FI's etc.
Took a wee look at the charts and there are a few interesting developments chart wise FWIW.
On the short term charts there is clear bullish divergence on the RSI/MACD etc. This will tie in with your liquidity testing I assume.
If you note on the Daily chart (below) - you will see the price has formed a wedge formation with lower highs but supported lows. Now take a look at the RSI. The RSI is forming higher lows, and whilst it was maintaining the lower highs for a while, it has now broken out of this channel on the upside.
This is exactly the type of signal I see time again when back testing charts to show a reversal in trend/momentum.
dl.dropboxusercontent.com/u/63552262/Cha..._Daily_-_18-8-14.png
There are a few area's worth noting here. In the case that we are right with the above fundamentals and buying in the background, if this was to go on a benny ala Argos, these targets could easily come into play. I will be keeping an eye on the 19/20 and the 29/30 area's in particular. Of course, along the way there are a couple of softer resistances on the way up, but given the right momentum, I believe the price will smash through these, and the RSI action is the first indication of this imo.
One other really interesting thing to note, longer term, is a target given on the weekly timeframe.
I'm a big believer in confluence. This is the merging of several supports/resistances together in a similar area. The more confluence the better, with the simple explanation being that a market is almost self prophesying in that the more area's in common that traders see, the more chance of those area's being traded. On the weekly chart below, one of those area's is the 41/44 area.
dl.dropboxusercontent.com/u/63552262/Cha...luence_-_18-8-14.png
The first obvious resistance is the major high after the gap down in Aug 2012. But please note the amount of Fibonacci confluence that is found. Firstly the 23.6% retracement of the 2008 swing high to swing low, following the 61.8% retrace from the swing low in late 2008 to the swing high in 2010. Again there is another 23.6% fib retracement from the swing high in 2012 to the swing low in the same year. Add a 161.8% fib area from the swing high in Jan 2013 to the swing lows of this year.
If this isn't enough, look at how often price action used this area as an area of support/resistance.
Imo, BOR will see this price again.
Last edit: 11 years 10 months ago by gclark25.
The following user(s) said Thank You: remo, manfrombrussels
Please Log in or Create an account to join the conversation.
Moderators: remo
Time to create page: 0.108 seconds