


Chartsview blog
General trading and all to do with financial markets

Marubozu Candle stick Pattern on the Dow
in ChartsView Blog:- Font size: Larger Smaller
- Hits: 37667
- 0 Comments
- Subscribe to this entry
- Bookmark
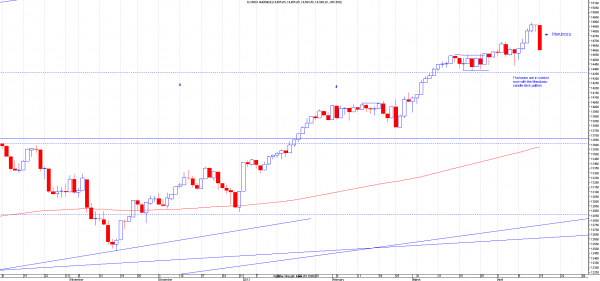
Marubozu candlestick pattern on the dow. This is quite a rare pattern on the dow jones industrial.
This shows that the bears are in charge and bigger falls maybe about to come.
Go away in april and come back in october may be true this year.
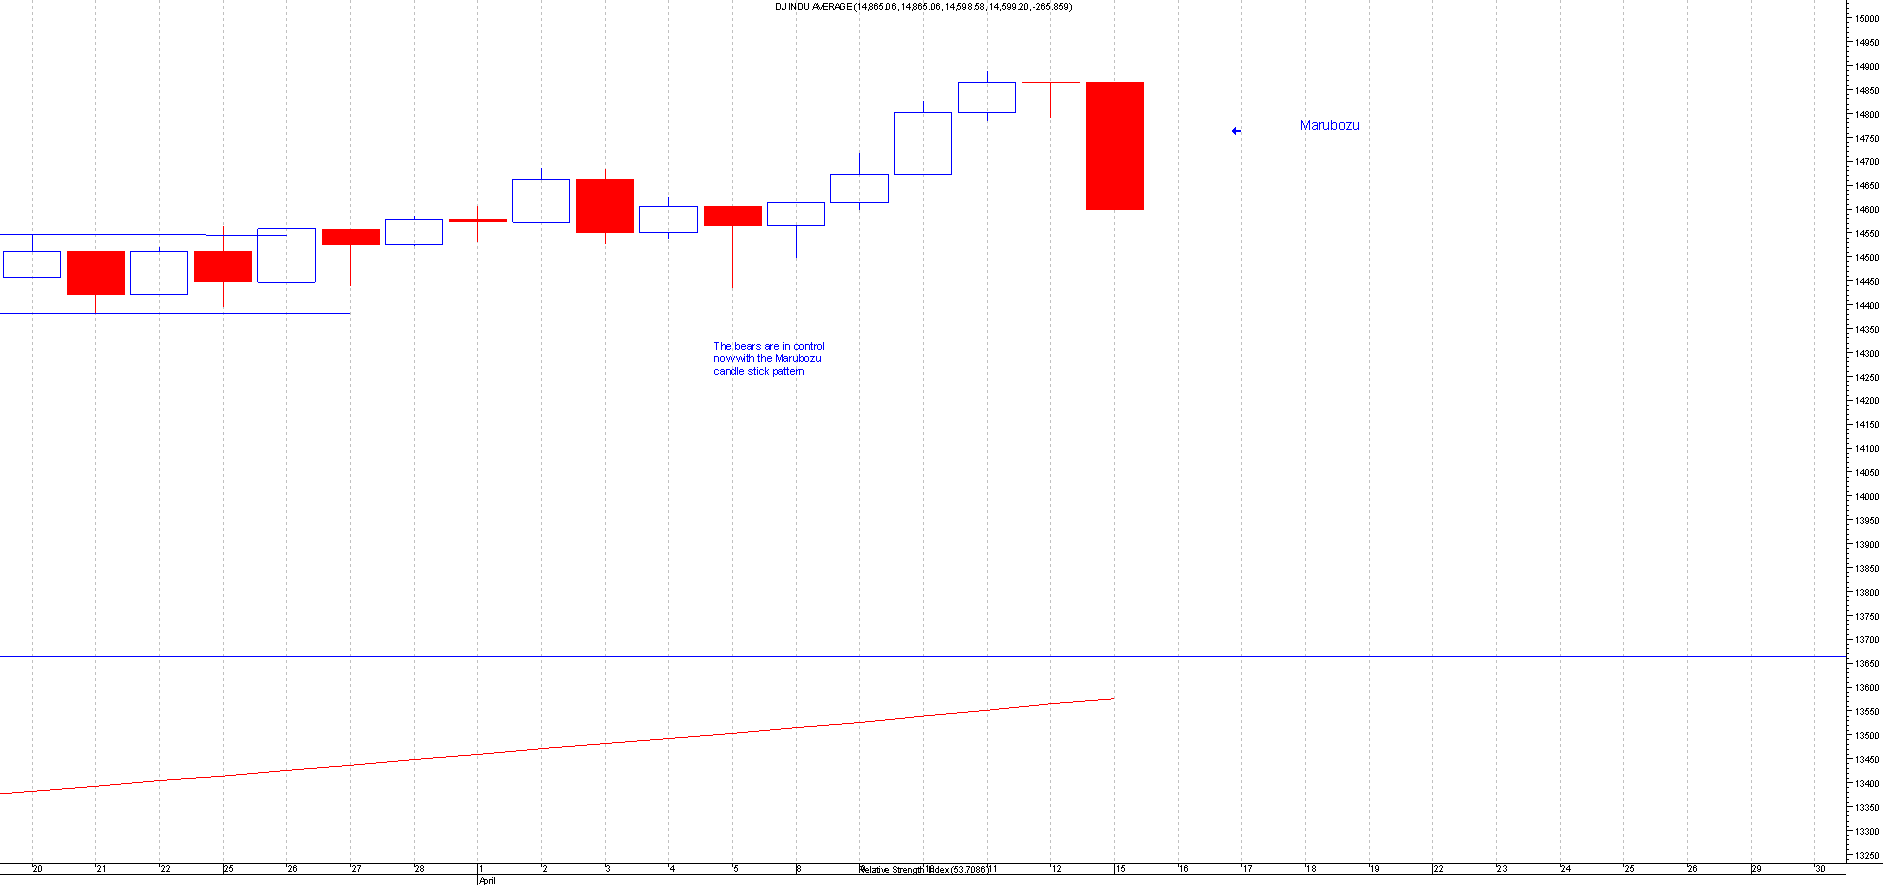
A good entry based on this pattern is if the price comes half way up the Marubozu in this case to 14731(this is th 50% point of the Marubuzu) then short with stops above preferably.
Caution on new longs as this could be the signal for a top. Obviously if the price goes back above the Marubozu then its void.
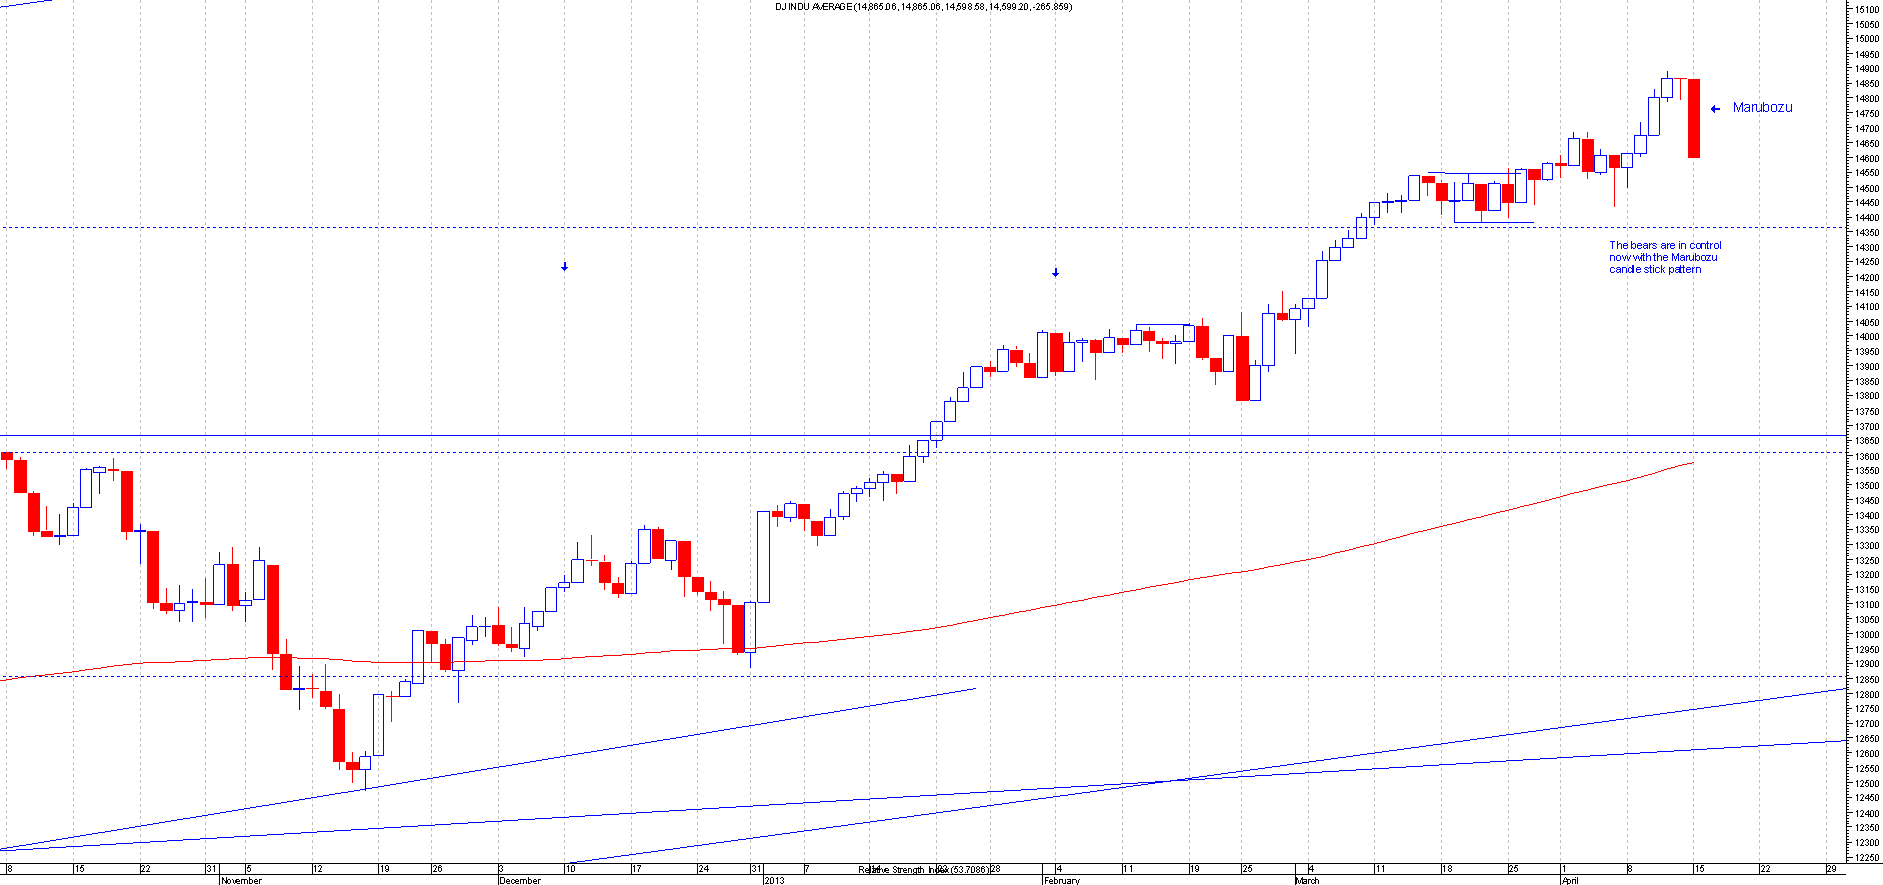
Marubozu candle has a long black body(red in my chart) and has no upper or lower shadows. This pattern indicates that the sellers are in charge and is pretty bearish pattern.
Ive noticed a lot of the time prices come back half way up a Marubozu and this seems to be a real good area to place an entry if you have missed an earlier entry.
Hopefully useful to some
Ill post blogs like this from time to time so keep an eye out