Chartsview blog
General trading and all to do with financial markets

Meggitt: Finding a good support level
in ChartsView Blog:- Font size: Larger Smaller
- Hits: 7166
- 0 Comments
- Subscribe to this entry
- Bookmark
This is just for learning purpose.
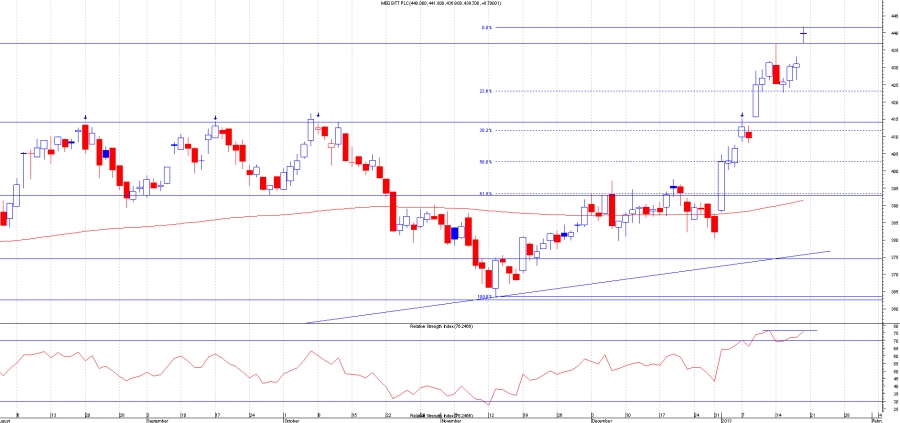
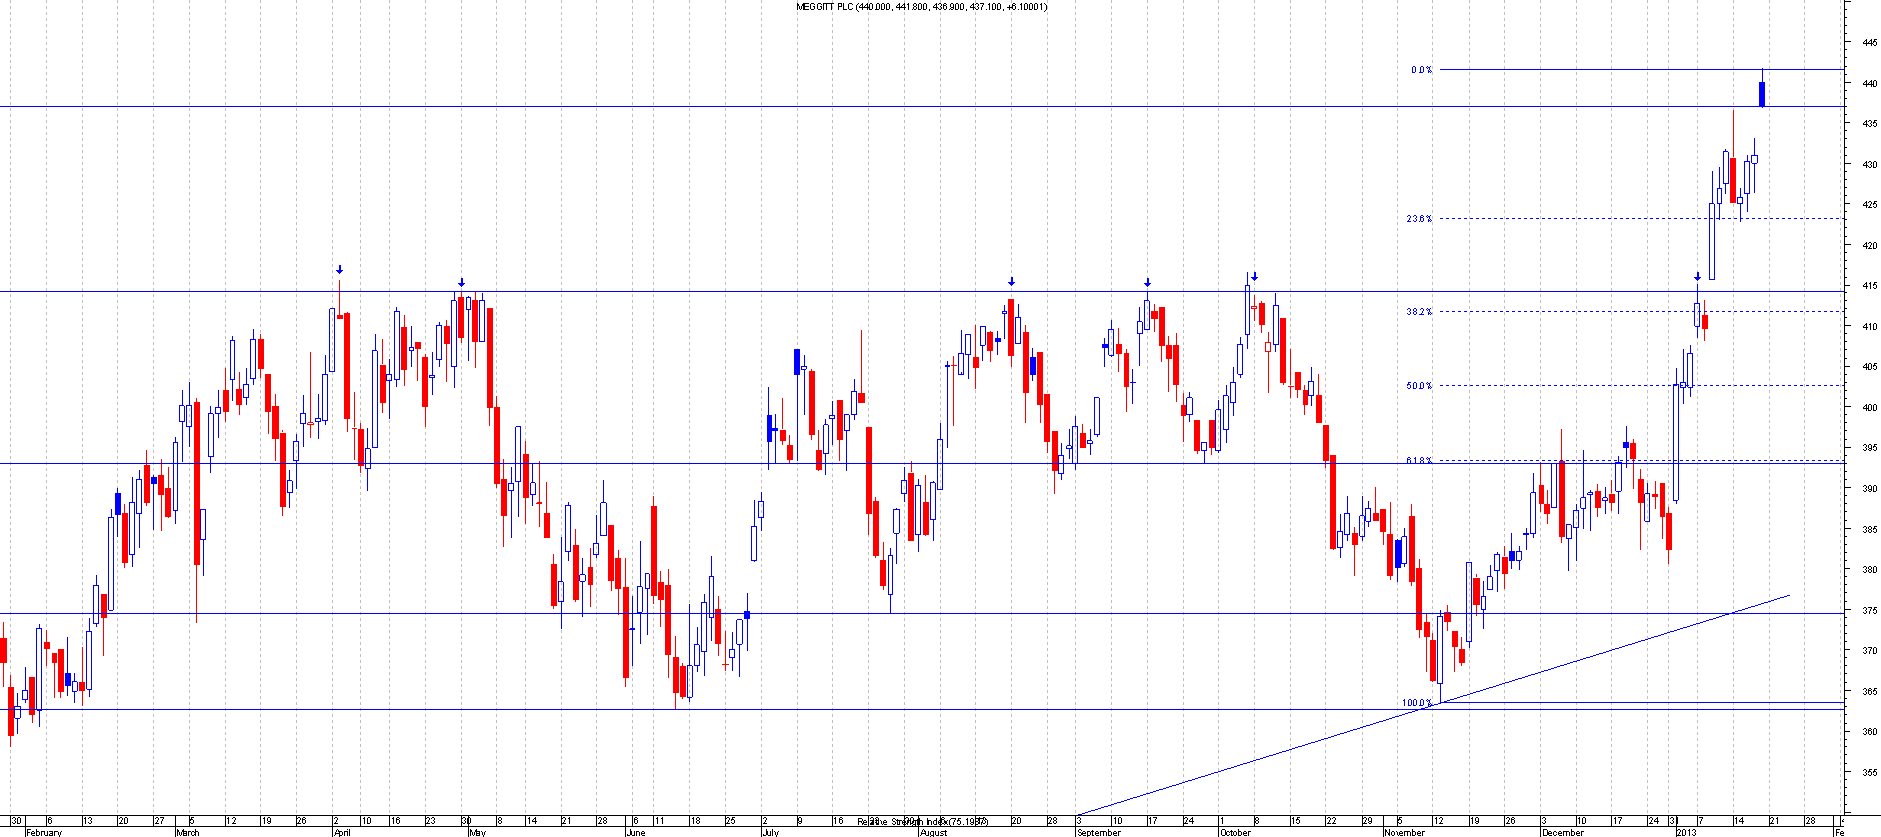
If you look at all those arrows ive put on this chart you can see that the price was held by this strong resistance
Now the price has broken above that resistance level and should be a good support for this share if the price comes back down to it.
If you look at the chart then you can also see that the share has gapped up today. Since this share has broken out of resistance it just motored on. This has been motoring since the low on 13th nov. At these levels you should not be looking to buy really as its in no mans land. If you were interested in this share then you would look to buy at support only and the nearest good support is at the breakout point.
Now im gonna make some assumptions . Obviously thats all it is but im trying to get people to understand why its important to not chase a share up.
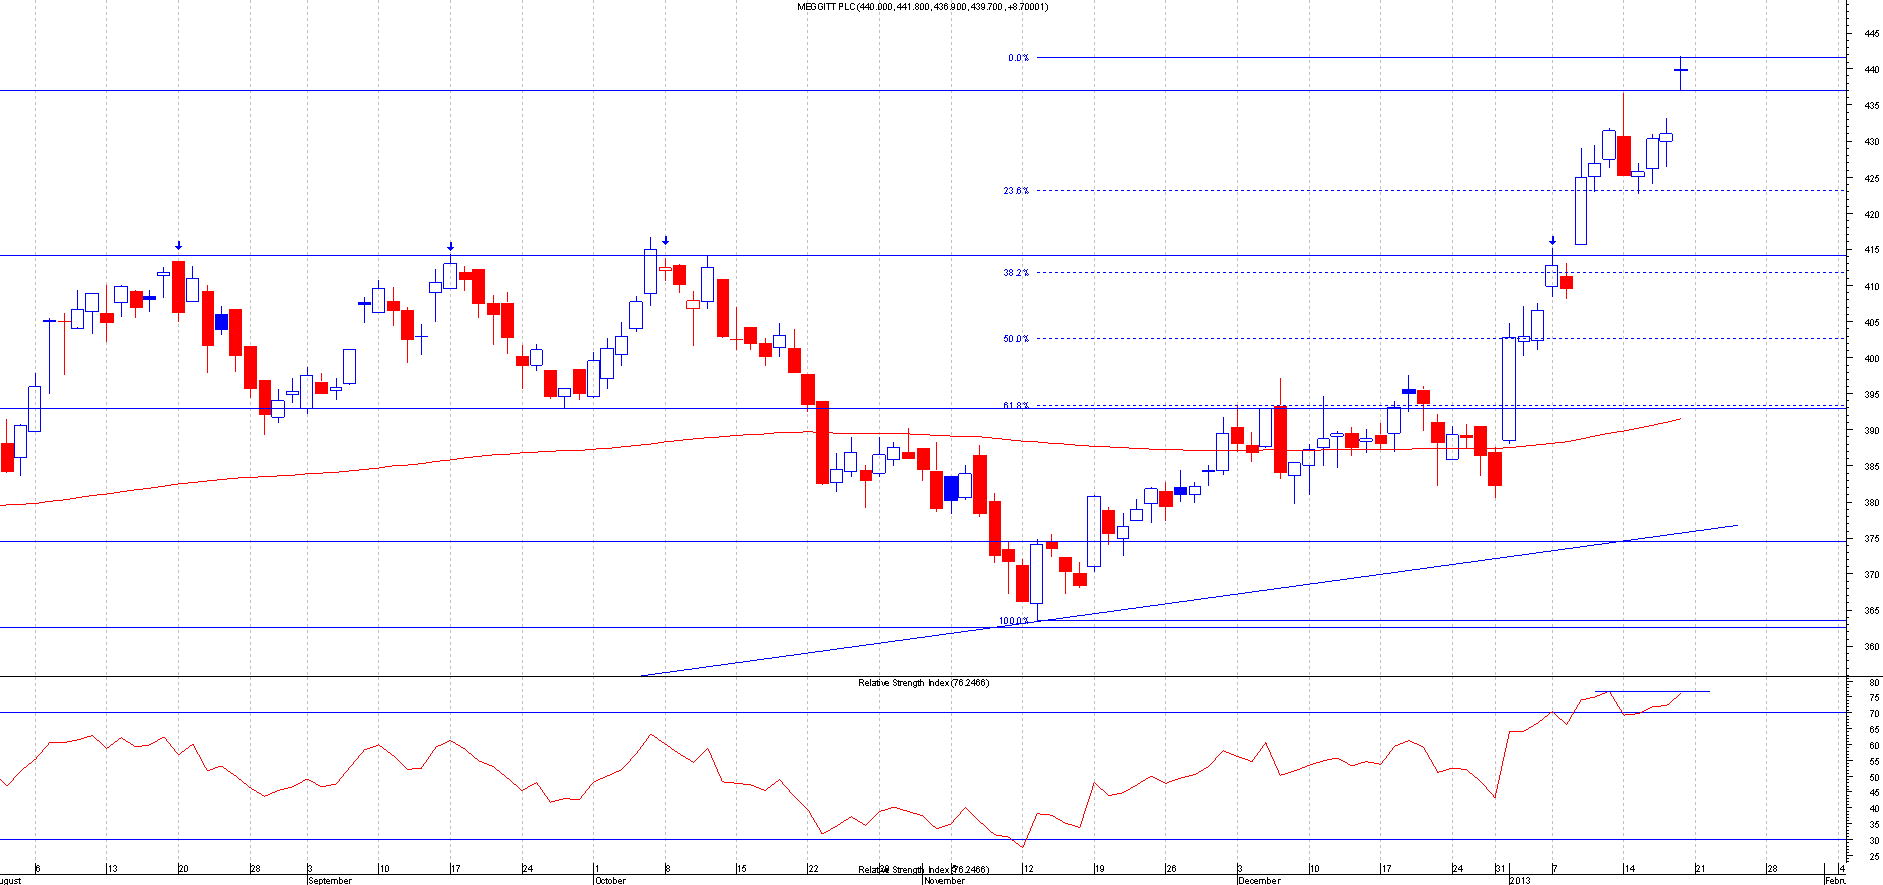
If you look at the chart then you can also see that the share has gapped up today. Now on my chart ive already drawn a fib retracement from todays high to the low of 13th november. This is assuming that we have hit a top.Its hard when a share is at a new high to assume this but im trying to find a good area to go long on. So if this is the high(assuming) then the best entry will be at 413.1
Why 413.1???
The first reason being that the price has a gap window there(candlestick trading). at 413.1
The second reason being that its very near to the breakout point at 414.2
The third reason being that the 38.2 fib retracement is at 411.8
So from the above you should be able to tell that the 413 area is going to be strong support for this share on the way down.(even if the fibs need changing)
Remember its all assuming that todays high is the high. you would have to redraw the fibs if we kept going higher. So even thou ive assumed its the top i would not place any trades as the price has to go down to those levels before my long entry by then i would know where to place the fibs as you need a high and a low to draw a fib.
I wont short this....This is totally against the trend so thats out of the question currently. Unless your day trading and know what your doing with a trade plan or some thing.
The point of the above is so that people should realise that chasing is risky at current levels and if you did want to buy into this company then you should wait for the price to retreat before jumping in for the longer term. Shares just dont go up for ever .They will come back down to build strength.
Usually a fib level will support it on the way down.
The best levels are where more than one support exists as for the example. This is taken from the current levels.
Hope that makes some sought of sense as trying to show how to determine a good support level.
remo