

US indices closed lower last week as tech took a beating and geopolitical risk flared up in the Middle East, sending oil sharply higher. This week, I'm watching whether US30 can hold support around 51,986 or if we're due for a deeper correction — the bias remains cautiously bearish until we reclaim key resistance.
Last Week in Review
Last week was a tale of two markets — US indices sold off with the NASDAQ leading losses down 2.29%, whilst oil surged over 6% on escalating US-Iran tensions in the Middle East. The S&P 500 dropped 0.77% and US30 fell 0.67%, both closing near weekly lows after failing to hold early-week highs. Meanwhile, the FTSE 100 bucked the trend with a modest 0.97% gain, and sterling rallied 0.89% against the dollar. It was a risk-off week with energy and defensives outperforming tech — a clear rotation that's worth noting heading into this week.
US30 (Dow Jones) — Weekly Outlook
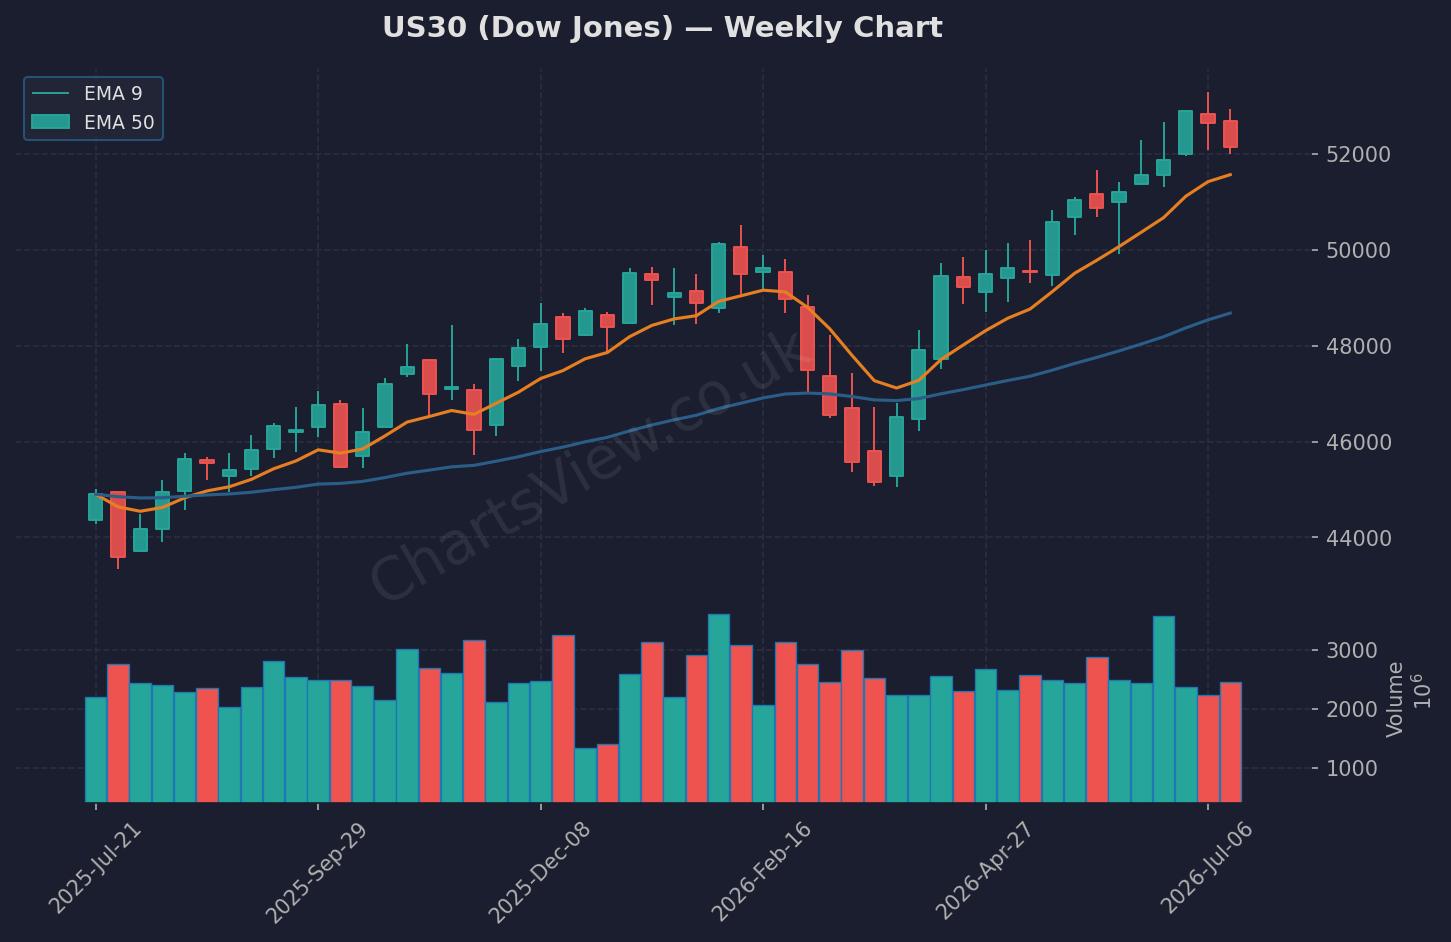
US30 (Dow Jones) Weekly Chart — EMA 9 (orange) & EMA 50 (blue) | Source: ChartsView
US30 closed at 52,146 after a bearish week that saw price reject the 52,924 highs and close below the previous week's close of 52,552. The weekly candle is a clear bearish engulfing pattern, and that's got my attention. Key support sits at the 5-day low of 51,986 — if that breaks, we could see a flush down towards the psychological 51,500 level. Resistance is now at 52,552 (previous close) and then the 52,924 weekly high.
My bias this week is cautiously bearish. The rejection from highs combined with geopolitical risk and a rotation out of risk assets suggests further downside is likely. I'm watching the 51,986 support closely — a break and close below that level opens the door for shorts targeting 51,500 and potentially 51,000. However, if US30 reclaims 52,552 and holds above it on a daily close, that would invalidate the bearish setup and I'd look for a retest of 52,924. Until then, I'm favouring short setups on rallies into resistance rather than chasing longs.
NAS100 (NASDAQ) — Weekly Outlook
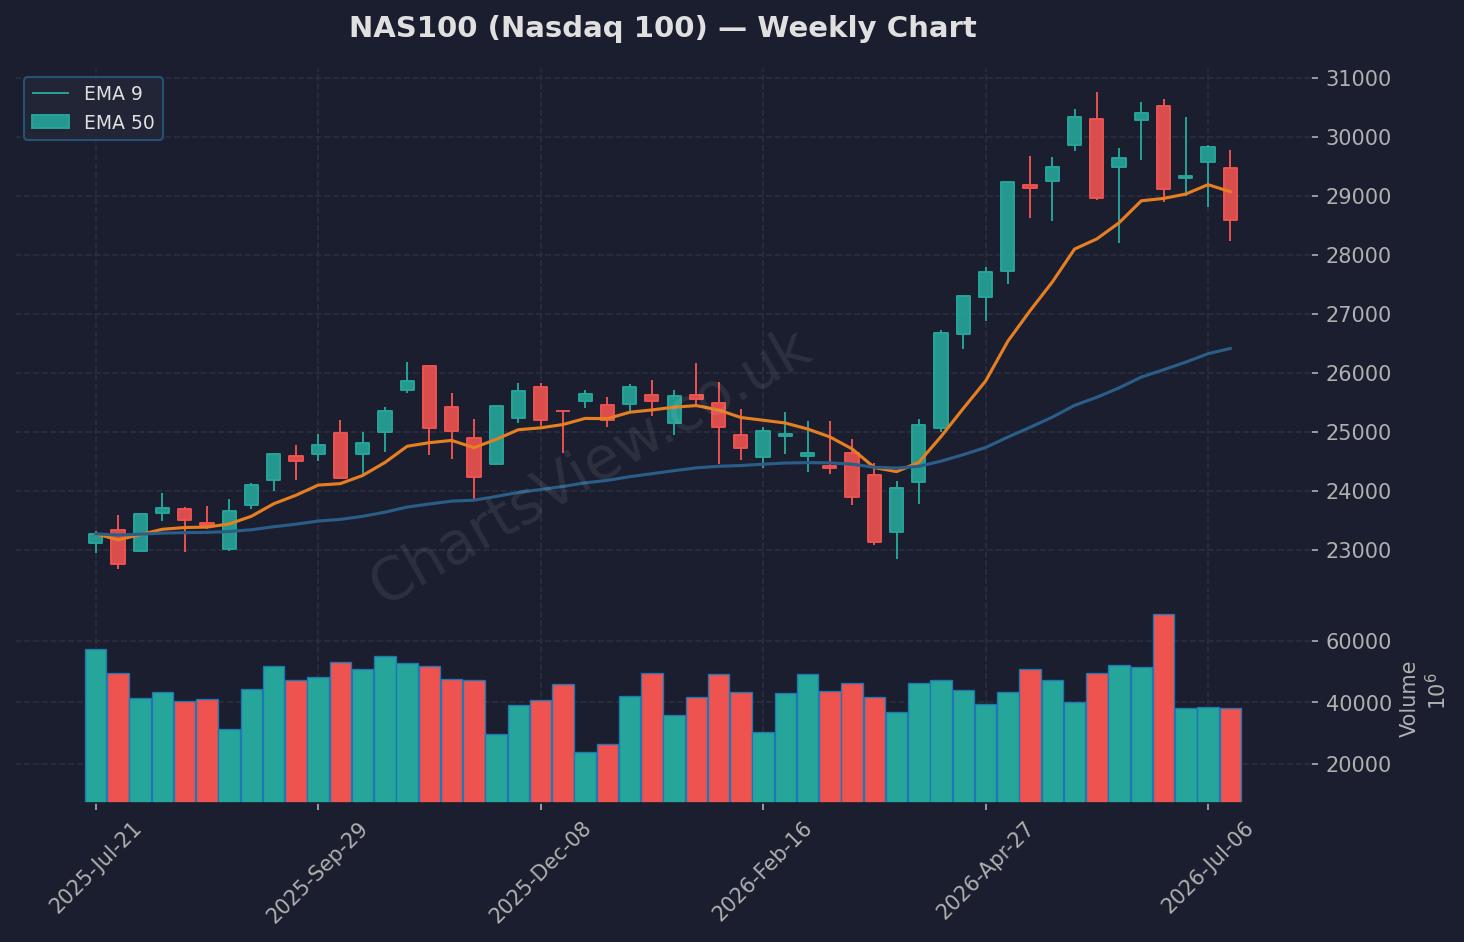
NAS100 (Nasdaq 100) Weekly Chart — EMA 9 (orange) & EMA 50 (blue) | Source: ChartsView
NAS100 took the biggest hit last week, down 2.29% and closing at 28,592 after tagging a 5-day low of 28,231. The tech-heavy index is clearly under pressure, likely due to profit-taking after a strong run and concerns over stretched valuations. Key support is at 28,231 (5-day low), whilst resistance sits at 29,025 (previous close) and then the 29,771 weekly high.
I'm bearish on NAS100 this week unless we see a strong reclaim of 29,025. The weekly candle closed weak, and the structure suggests more downside is likely. If 28,231 breaks, I'm looking for a move towards 27,800. On the flip side, a reclaim of 29,025 with conviction would shift me neutral and open the door for a retest of 29,771. For now, I'm watching for short setups on any rally back into the 28,800–29,000 zone.
Quick Takes
S&P 500: Down 1.01% and sitting at 7,457 — key support at 7,431 (5-day low) needs to hold or we're looking at 7,300 next.
Brent Oil: Surged 6.22% to 90.23 on Middle East tensions — watching whether we push through 91.43 (5-day high) or see profit-taking back towards 88.10.
GBP/USD: Strong week with a 0.89% gain to 1.3467 — resistance at 1.3545 (5-day high) is the level to watch for continuation higher.
Gold: Flat at 4,017 despite risk-off flows — consolidating between 3,964 support and 4,070 resistance, waiting for a breakout.
Key Events This Week
- Monday, 06:00 GMT — Germany PPI YoY (Jun): Previous 2.2%. Inflation data from Europe's largest economy — any surprise could move EUR pairs and European indices.
This week's calendar is relatively light on major data releases based on available information. The focus will likely remain on geopolitical developments in the Middle East and their impact on energy markets, as well as any corporate earnings from major tech names that could influence sentiment on the indices. Keep an eye on oil inventory data and any Fed speaker comments that could shift rate expectations.
The Week Ahead — My Game Plan
My bias this week is cautiously bearish on US indices, particularly NAS100, unless we see a strong reclaim of last week's closing levels. I'm watching the 51,986 support on US30 and 28,231 on NAS100 — breaks below those levels and I'm looking for short continuation. If we get a bounce, I'm treating rallies as selling opportunities into resistance rather than chasing longs. The geopolitical backdrop and energy surge suggest risk appetite is fragile. As always, wait for confirmation, don't front-run the move, and keep your stops tight — this market can whipsaw quickly when headlines hit.
Written by Remo, founder of ChartsView. This outlook reflects personal analysis and does not constitute financial advice. Always do your own research and manage your risk.