US indices closed last week marginally lower after a three-week winning streak, with tech showing relative strength as NAS100 gained over 1.4% while the Dow shed half a percent. This week, I'm watching whether US30 can reclaim the 54,000 zone or if we're due for a deeper pullback into support.
Last Week in Review
Last week gave us a classic consolidation after a strong run, with US indices posting mixed results. The NASDAQ 100 continued its outperformance with a +1.43% weekly gain, whilst the Dow Jones slipped -0.45% and the S&P 500 managed a modest +0.42% advance. It was a week of range trading rather than conviction moves — price action suggesting traders are waiting for the next catalyst rather than chasing momentum.
US30 (Dow Jones) — Weekly Outlook
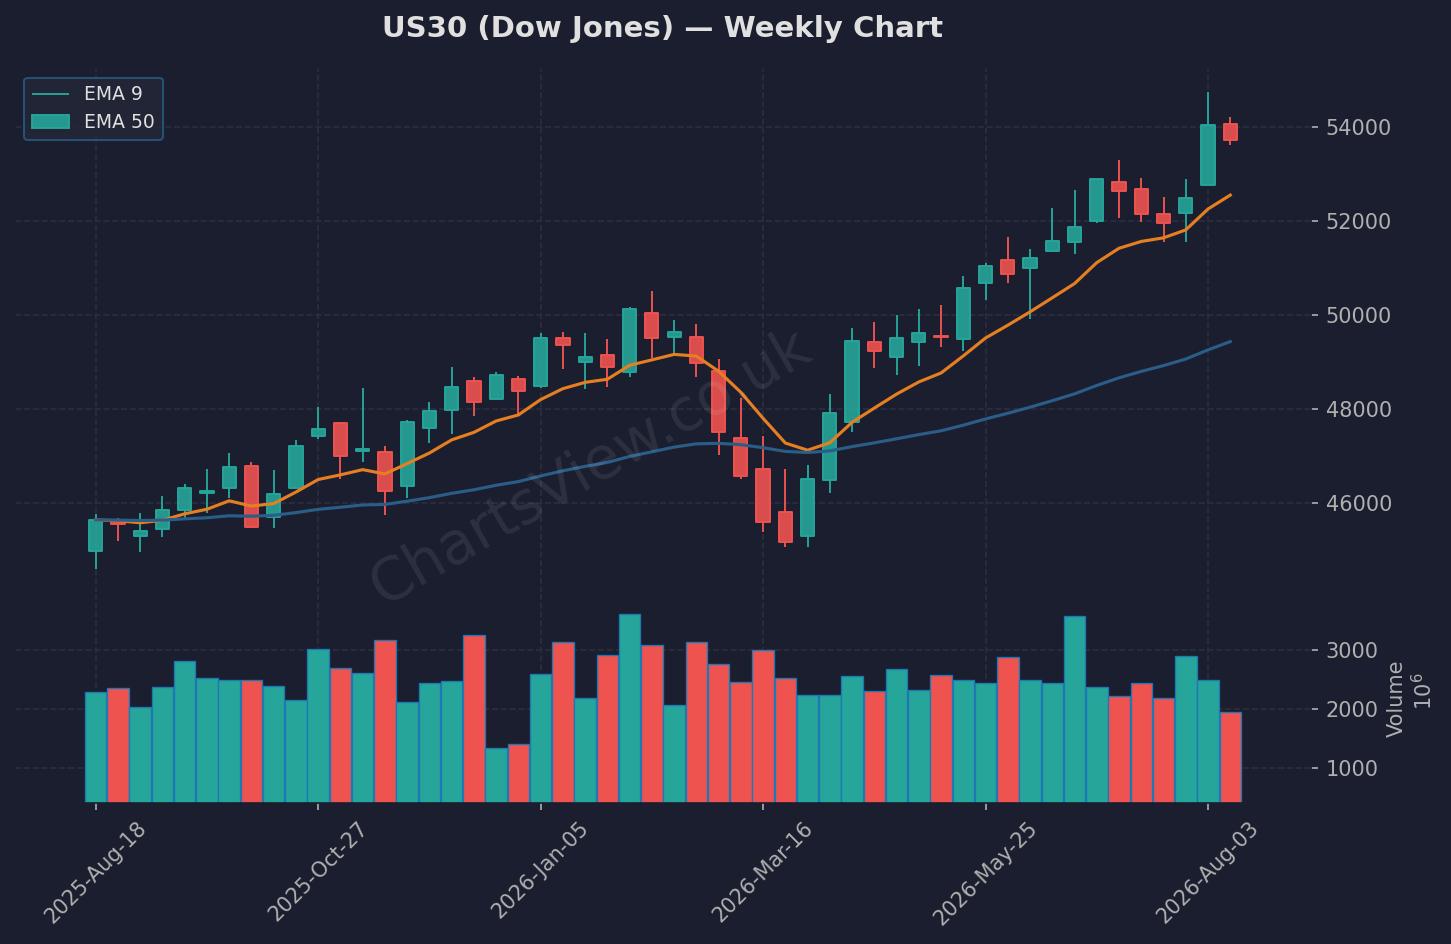
US30 (Dow Jones) Weekly Chart — EMA 9 (orange) & EMA 50 (blue) | Source: ChartsView
US30 closed the week at 53,732, down -0.45% and printing a bearish candle after failing to hold above the 54,000 psychological level. The 5-day range has been relatively tight between the high at 54,222 and the low at 53,622, with Friday's close just above that weekly support zone. My bias this week is cautiously bearish below 53,840 (previous close) — I'm watching whether we get follow-through selling into the 53,622 support, and if that breaks, we could see a move down towards 53,000. On the flip side, resistance sits clearly at 54,222 (last week's high), and a reclaim above there would invalidate the bearish setup and open the door back to all-time highs. The key level for me is 53,622 — if US30 holds above this and reclaims 54,000 with conviction, I'm looking for longs targeting 54,500. But if we lose 53,622, I'm positioning for shorts targeting 53,200 with a tight stop above 53,840. The weekly candle character suggests exhaustion after the three-week rally, so I'm not chasing longs unless we see a clear reclaim of structure.
NAS100 (NASDAQ) — Weekly Outlook
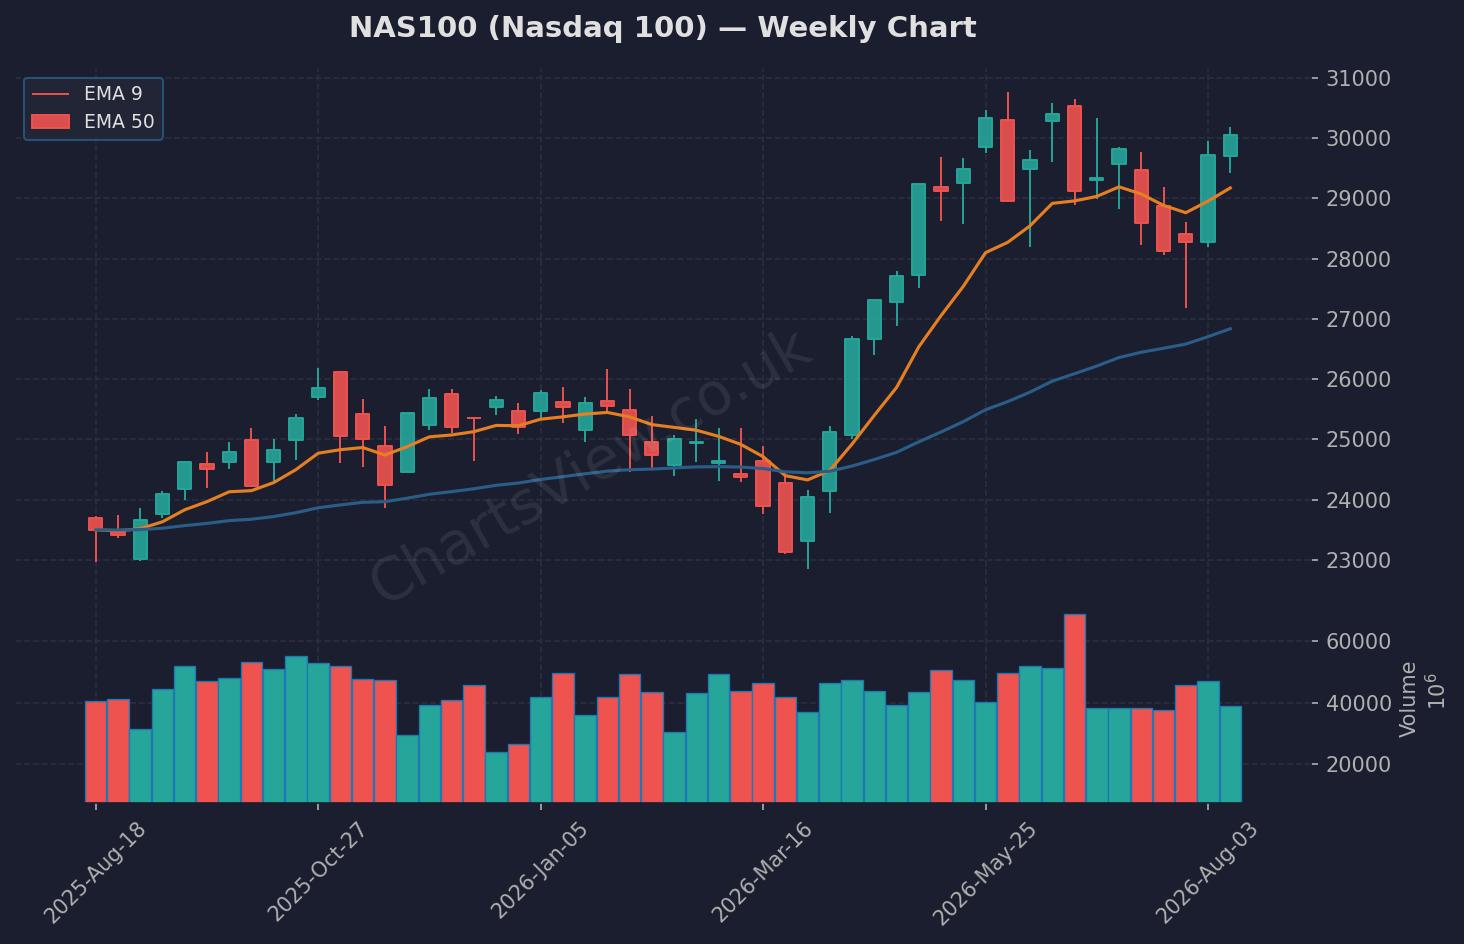
NAS100 (Nasdaq 100) Weekly Chart — EMA 9 (orange) & EMA 50 (blue) | Source: ChartsView
NAS100 was the standout performer last week, closing at 30,046 with a solid +1.43% weekly gain, showing tech continues to attract buying interest. The index printed a bullish weekly candle and is currently trading just below the 5-day high at 30,179, which is my immediate resistance level to watch. Support comes in at the 5-day low of 29,427, though I'd expect the previous close at 30,084 to act as initial support on any pullback. My bias remains bullish above 30,000 — if NAS100 can push through 30,179 and hold, I'm targeting 30,500 as the next upside objective. The invalidation level for bulls is a break below 29,427, which would suggest the recent strength is fading and open the door to a deeper correction. Tech earnings and AI sentiment continue to drive this index, so I'm watching for continuation above 30,084 or a failure that brings us back into the 29,500 zone.
Quick Takes
S&P 500: Closed at 7,785 (+0.42% weekly), holding above the 5-day low at 7,717 — watching 7,816 resistance for continuation or a rejection back into range.
Gold: Strong weekly close at 4,449 (+0.93%), pushing towards the 5-day high at 4,473 — if we clear that level, 4,500 is the next psychological target with support at 4,380.
GBP/USD: Cable closed at 1.3555 (+0.32% weekly), just shy of the 5-day high at 1.3560 — a break above opens 1.3600, whilst support sits at 1.3511.
WTI Oil: Dropped -1.41% to 82.10, trading mid-range between 84.35 (high) and 80.09 (low) — neutral bias until we break either boundary with conviction.
Key Events This Week
- Monday 12:30 GMT — US NY Empire State Manufacturing Index (Aug): Forecast 10.2 vs Previous 15.6. A sharp drop in manufacturing sentiment could weigh on risk appetite early in the week.
- Monday 14:00 GMT — US NAHB Housing Market Index (Aug): Forecast 33 vs Previous 34. Housing market weakness continues to be a theme — further deterioration could pressure indices.
- Monday 20:00 GMT — US Net Long-term TIC Flows (Jun): Previous 232.7. Capital flow data that can impact USD strength and risk sentiment, though typically a lower-tier mover.
The Empire State Manufacturing Index is the one to watch — a miss below 10 could trigger some early-week volatility, especially if it confirms broader manufacturing weakness. Otherwise, it's a relatively light week for tier-one data, meaning price action will likely be driven by technical levels and positioning ahead of month-end flows.
The Week Ahead — My Game Plan
I'm approaching this week with a cautious stance — we've had a strong three-week rally and last week's consolidation suggests traders are taking profits rather than adding exposure. My primary focus is on US30 holding the 53,622 support zone; a break below shifts my bias to short-term bearish targeting 53,200, whilst a reclaim of 54,000 puts me back in the bullish camp. NAS100 looks stronger and I'm watching for continuation above 30,179, but I'm not chasing here without confirmation. As always, keep your risk tight — we're trading near all-time highs with light economic data, which means any surprise can move markets quickly.
Written by Remo, founder of ChartsView. This outlook reflects personal analysis and does not constitute financial advice. Always do your own research and manage your risk.