Last week delivered a classic risk-off rotation as equity indices pulled back whilst oil surged over 6% on geopolitical tensions. This week, I'm watching whether US30 can reclaim the 53,000 zone or if we're setting up for a deeper retracement into month-end.
Last Week in Review
The standout performer was crude oil — WTI rallied 6.85% and Brent climbed 5.95% as Trump's comments on Iranian oil and stalled Gulf negotiations fuelled supply concerns. Meanwhile, silver took a hammering, down over 5%, whilst gold held relatively flat. It was a week of rotation rather than capitulation, but the tone has shifted more defensive heading into this week.
US30 (Dow Jones) — Weekly Outlook
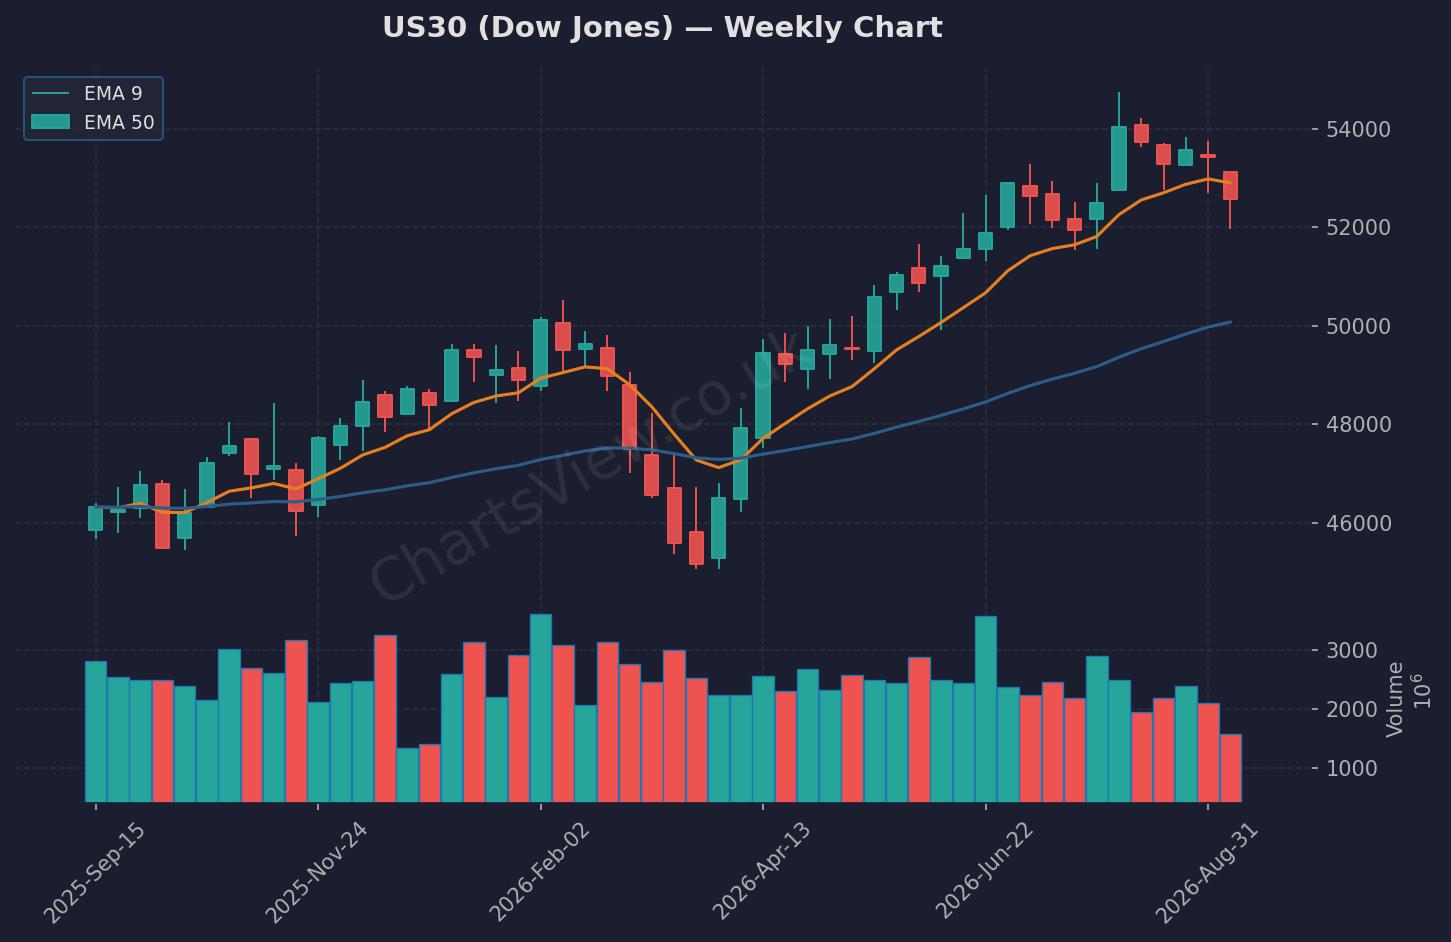
US30 (Dow Jones) Weekly Chart — EMA 9 (orange) & EMA 50 (blue) | Source: ChartsView
US30 closed at 52,573, down nearly 1,062 points from last week's high of 53,635. The weekly candle printed a bearish engulfing pattern, rejecting the highs and closing near the lows — that's not the structure you want to see if you're bullish. Key support now sits at the 5-day low of 51,962, with the previous close at 52,064 acting as a secondary floor. On the upside, resistance is clear at 53,635 (last week's high), and reclaiming that level would be the first sign that buyers are back in control.
My bias this week is cautiously bearish unless we see a strong reclaim above 53,000. If US30 continues to trade below 52,500 and fails to hold 52,064, I'm looking for a move towards 51,500-51,700. The invalidation for bears would be a daily close back above 53,200, which would suggest the pullback was just a liquidity grab before another leg higher. I'm watching Monday's reaction closely — if we get an early bounce that fades into the New York session, that's a sell signal. If we gap up and hold, I'll reassess.
NAS100 (NASDAQ) — Weekly Outlook
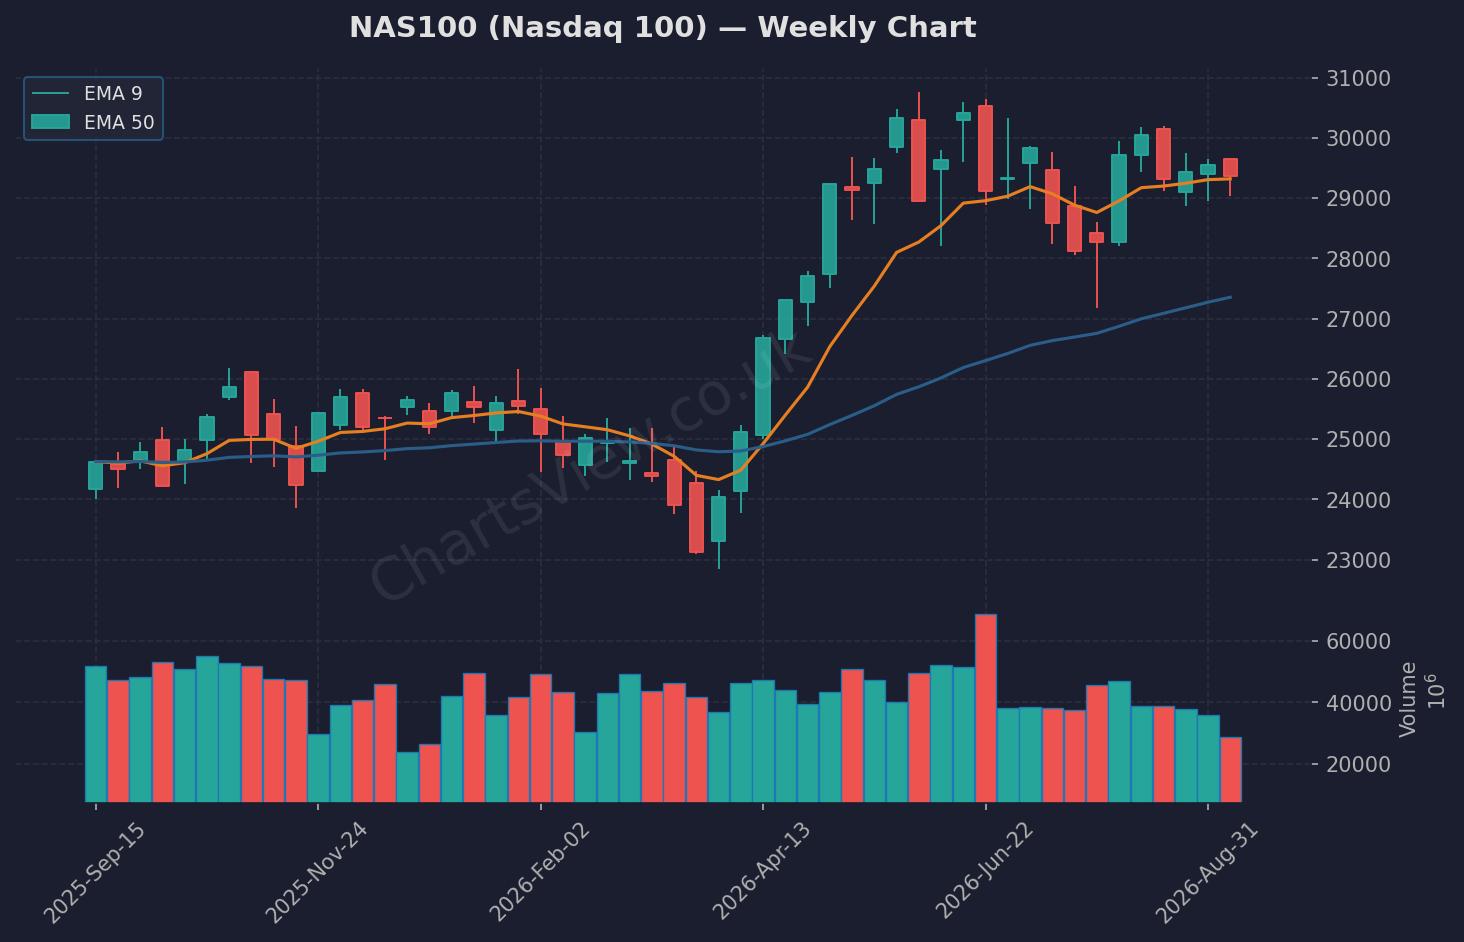
NAS100 (Nasdaq 100) Weekly Chart — EMA 9 (orange) & EMA 50 (blue) | Source: ChartsView
NAS100 closed at 29,368, down from the 5-day high of 29,655 but holding above the 5-day low of 29,038. The weekly close was relatively resilient compared to US30, printing a small bearish candle rather than a full rejection. Support is clear at 29,038 and the previous close at 29,103. Resistance sits at 29,655, with a break above that level opening the door to 30,000.
Tech has been under pressure from AI safety concerns and the Anthropic IPO delay narrative, but the structure here is cleaner than US30. My bias is neutral-to-bullish if we hold above 29,100. A reclaim of 29,500 would be the trigger for longs targeting 29,800-30,000. Below 29,000, I'd expect a flush towards 28,700. The key this week is whether tech can decouple from broader market weakness or if it gets dragged lower with the indices.
Quick Takes
S&P 500: Closed at 7,656, holding above the 5-day low of 7,580 but rejected from 7,750 — watching 7,600 as the line in the sand for bulls this week.
WTI Oil: Ripped 6.85% last week to 102.63 — resistance at 104.46 (5-day high), but geopolitical risk keeps the bid tone alive; watching for a breakout above 105.
GBP/USD: Slipped to 1.3504, down 0.32% — support at 1.3485 (5-day low) holding for now, but a break below would target 1.3400; resistance at 1.3570.
Key Events This Week
- Monday, 15:15 GMT — ECB President Lagarde Speech (EU): Medium importance. Lagarde's tone on inflation and rate policy could move EUR pairs and European indices. Any hawkish tilt would support the euro and weigh on risk assets.
This week's calendar is relatively light, which means price action will be driven more by technical levels and positioning than data. The Lagarde speech is the only notable event, so keep an eye on how EUR/USD reacts — any sharp moves could spill over into equity indices via the dollar.
The Week Ahead — My Game Plan
I'm starting the week with a cautious bias. US30 and the broader indices have shown weakness, and until we reclaim last week's highs, the path of least resistance is lower. I'm watching the 52,000-52,500 zone on US30 and 29,100 on NAS100 as the key levels — hold above and we could see a bounce; break below and I'm looking for continuation to the downside. Oil's strength is worth monitoring too — if crude keeps rallying, it could weigh on equities via inflation concerns. As always, no level is worth blowing your account over — manage your risk, wait for confirmation, and don't chase moves that have already happened.
Written by Remo, founder of ChartsView. This outlook reflects personal analysis and does not constitute financial advice. Always do your own research and manage your risk.