US tech staged an impressive comeback last week with NAS100 surging over 5%, while energy markets exploded higher on escalating Middle East tensions. This week, I'm watching whether the Dow can reclaim 50,000 and if crude's rally has legs — or if we're due for a sharp reversal.
Last Week in Review
Last week delivered a clear risk-on tone in US equities despite mounting geopolitical uncertainty. The NASDAQ 100 led the charge with a blistering +5.73% weekly gain, closing at 29,234.99, while the S&P 500 added +2.75% to finish at 7,398.93. The Dow Jones lagged with a modest +1.36% gain to 49,609.16, unable to sustain its push above 50,000. Meanwhile, energy markets went parabolic — WTI crude jumped +5.31% to 100.13 and Brent surged +4.33% to 105.66 as Iran conflict headlines kept the Strait of Hormuz effectively shut. The FTSE 100 was the outlier, dropping -1.26% to 10,233.07 as UK markets struggled with rising energy costs and weaker consumer sentiment.
US30 (Dow Jones) — Weekly Outlook
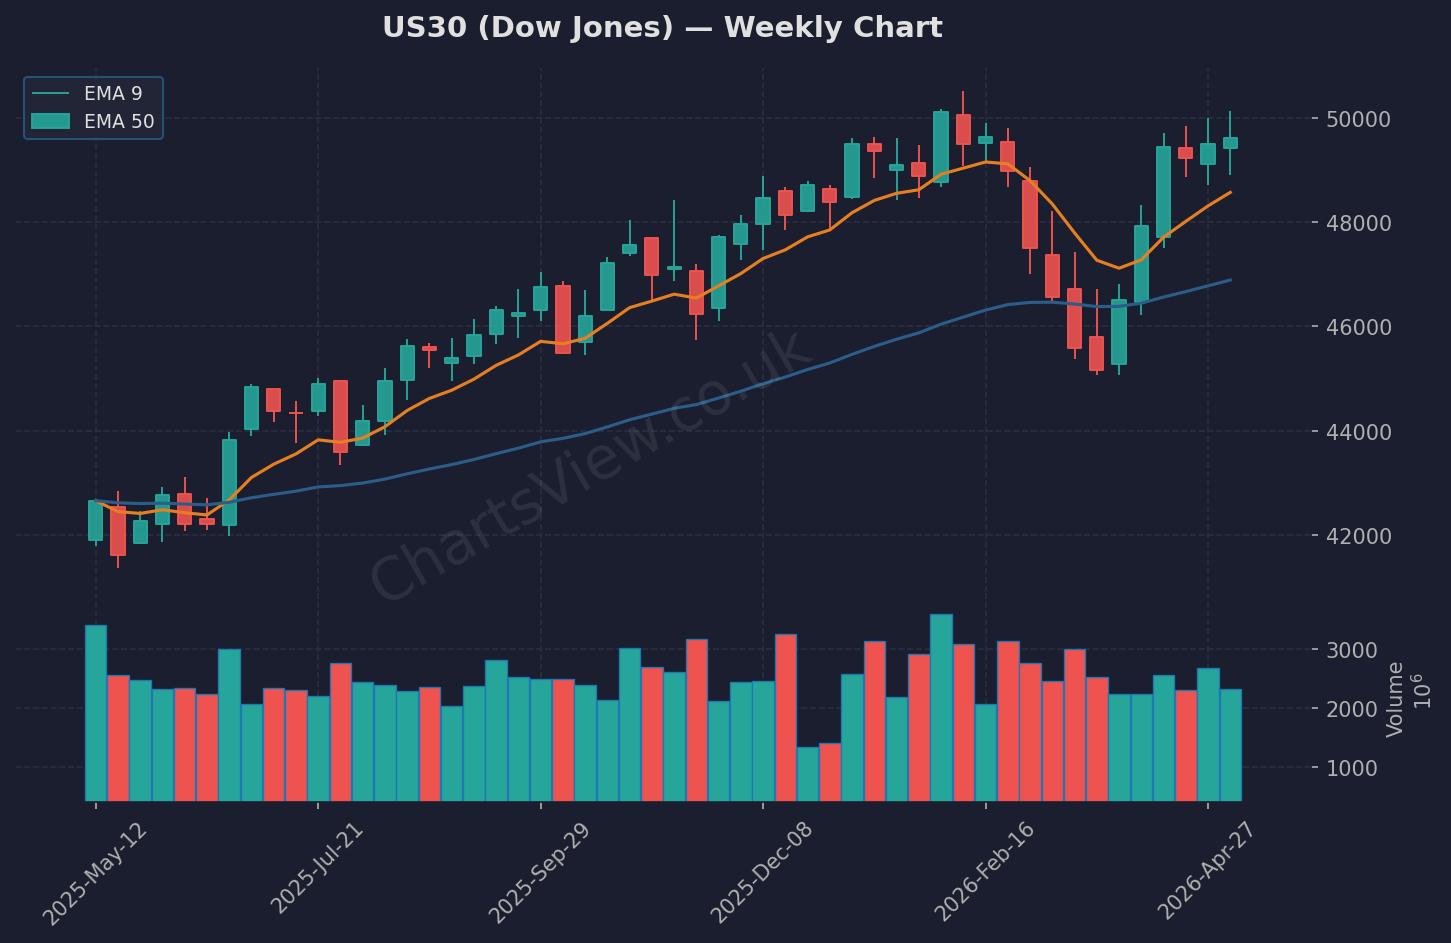
US30 (Dow Jones) Weekly Chart — EMA 9 (orange) & EMA 50 (blue) | Source: ChartsView
US30 closed the week at 49,609.16, printing a bullish weekly candle but failing to hold above the psychological 50,000 level. The 5-day high at 50,130.20 represents clear resistance — that's the level bulls need to reclaim for continuation. On the downside, support sits at the 5-day low of 48,913.06, with the previous close at 49,596.97 acting as a pivot.
My bias this week is cautiously bullish, but I need to see a clean break and hold above 50,000 before committing to longs. If US30 can reclaim 50,000 and hold it on a 4-hour close, I'm looking for a move towards 50,500. The setup would be invalidated on a break below 48,900, which would shift me neutral and have me watching for a retest of the 48,500 zone.
The challenge here is that the Dow is lagging tech significantly — if NAS100 stalls, US30 likely follows. I'm also watching oil closely; if crude rolls over from current levels, it could drag energy-heavy Dow components lower. For now, I'm waiting for price to show its hand above 50,000 before taking directional risk.
NAS100 (NASDAQ) — Weekly Outlook
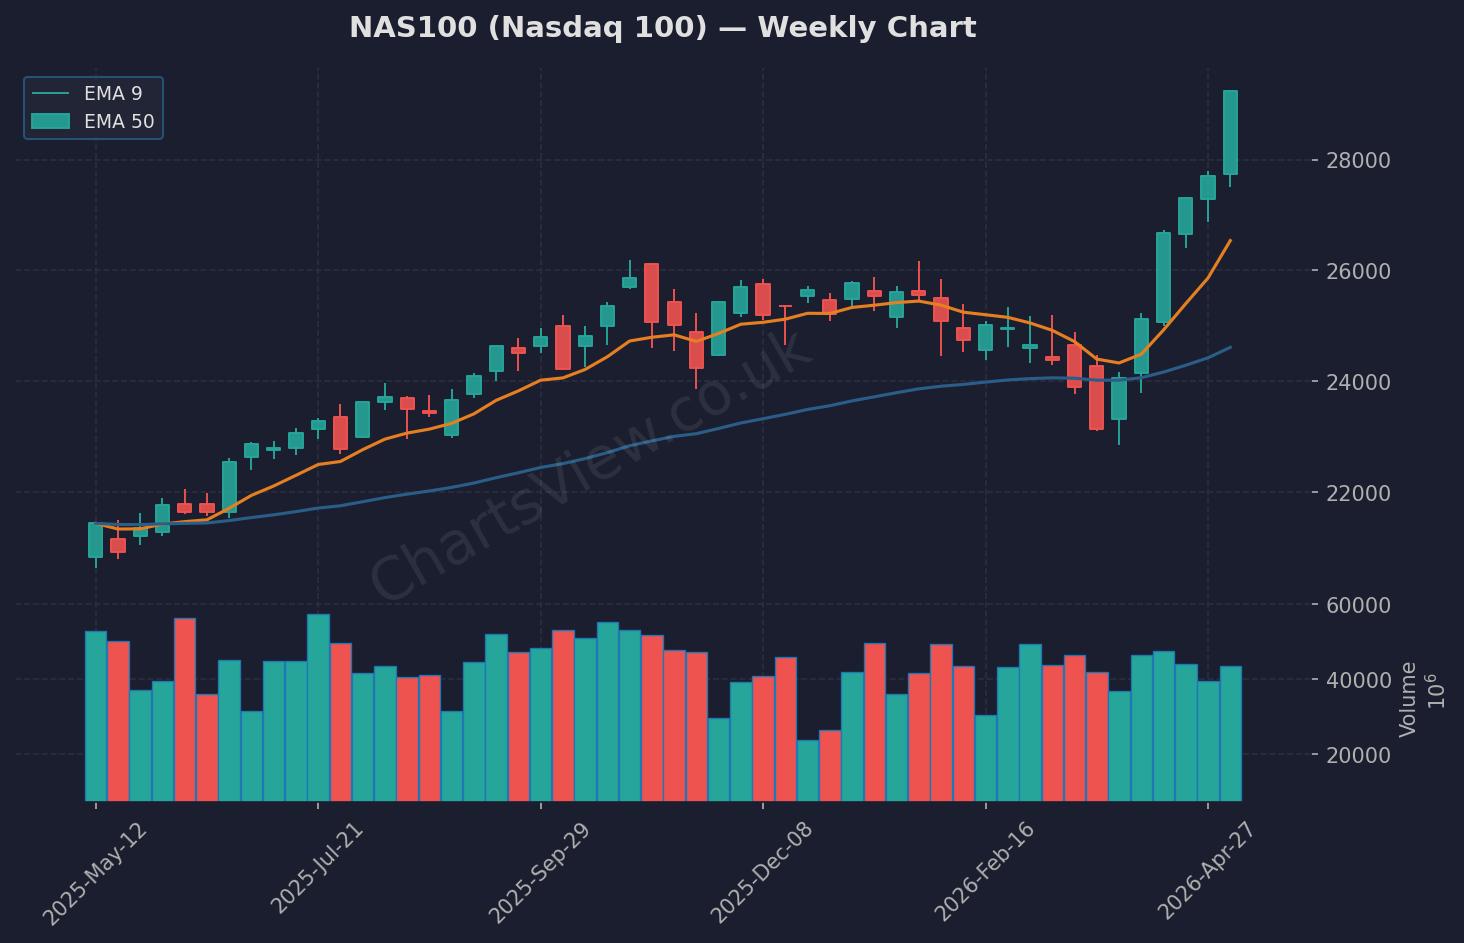
NAS100 (Nasdaq 100) Weekly Chart — EMA 9 (orange) & EMA 50 (blue) | Source: ChartsView
NAS100 absolutely ripped last week, closing at 29,234.99 — right at the 5-day high and up +5.73% on the week. This is a powerful momentum move, likely fuelled by the memory chip supercycle narrative and Big Tech earnings optimism. The weekly candle is strongly bullish with minimal upper wick, suggesting buyers are in full control.
Resistance is thin here given we're at fresh highs, but I'm watching 29,500 as the next psychological level. Support comes in at the previous close of 28,563.95, with stronger support at the 28,000 round number. My bias is bullish continuation, but I'm cautious of overextension — a +5.7% week doesn't happen often without some consolidation following.
If NAS100 holds above 28,500 and builds a base here, I'm looking for longs on any pullback towards 28,800 targeting 30,000. A break below 28,500 would invalidate the bullish structure and have me stepping aside. The Nvidia earnings later this month will be critical — any disappointment could trigger a sharp reversal from these elevated levels.
Quick Takes
S&P 500: Closed at 7,398.93, right at the 5-day high of 7,401.50 — bullish structure intact, watching for a break above 7,400 to confirm continuation towards 7,500.
WTI Crude: Explosive move to 100.13, up nearly 5% on the week — watching the 102.70 high as next resistance, but momentum is stretched and a pullback towards 95.00 wouldn't surprise me.
Gold: Relatively flat at 4,680.60 despite geopolitical chaos — support at 4,663.60 (5-day low) is key, break below shifts me bearish towards 4,600.
GBP/USD: Grinding higher to 1.3588, approaching the 5-day high of 1.3643 — if Cable breaks 1.3650, I'm looking for a run towards 1.3750.
Key Events This Week
- Monday, 14:00 GMT — US Existing Home Sales (Apr): Forecast 4.05M vs 3.98M prior. A beat could support the 'economy is resilient' narrative, but housing data has been increasingly disconnected from broader market moves given the Iran war dominates sentiment.
- Tuesday, 23:01 GMT — UK BRC Retail Sales Monitor YoY (Apr): Forecast 0.8% vs 3.1% prior. Sharp deceleration expected as surging petrol prices and falling consumer confidence hit spending — bearish for FTSE if it misses.
The biggest risk event this week isn't on the economic calendar — it's geopolitical. Any escalation or de-escalation headlines from the Iran conflict will move markets more than data. Trump-Xi summit chatter is also worth monitoring, though no firm date has been set.
The Week Ahead — My Game Plan
I'm leaning bullish on US indices, but I'm not chasing here — last week's rally was strong and we need to see if buyers can hold these levels before adding exposure. My focus is on US30 reclaiming 50,000 and NAS100 consolidating above 28,500 before I commit to longs. If we get a pullback early week, I'm looking to buy dips rather than breakouts. Oil is the wildcard — if crude reverses hard from 100+, it could drag the entire market lower, so I'm keeping stops tight and position sizes conservative. As always, protect your capital first — no level is worth blowing up your account over.
Written by Remo, founder of ChartsView. This outlook reflects personal analysis and does not constitute financial advice. Always do your own research and manage your risk.