US indices closed their best week since April, with the NAS100 surging over 3% as tech reclaimed leadership and the S&P 500 printed fresh all-time highs. But with Iran tensions flaring, a surprise jobs decline, and key inflation data due, this week could test whether buyers have the conviction to push higher or if we're due for a pullback.
Last Week in Review
Last week delivered a proper risk-on rally across the board. The S&P 500 gained 2.07% and the NAS100 ripped 3.29% higher, both posting their strongest weekly performances since April. Commodities joined the party — WTI crude surged 4.25%, Brent climbed 5.63%, and gold pushed 3.48% higher to close above $4,390. The week's tone was decisively bullish, though Friday's surprise jobs decline (-23,000 vs +83,000 expected) introduced a note of caution heading into the new week.
US30 (Dow Jones) — Weekly Outlook
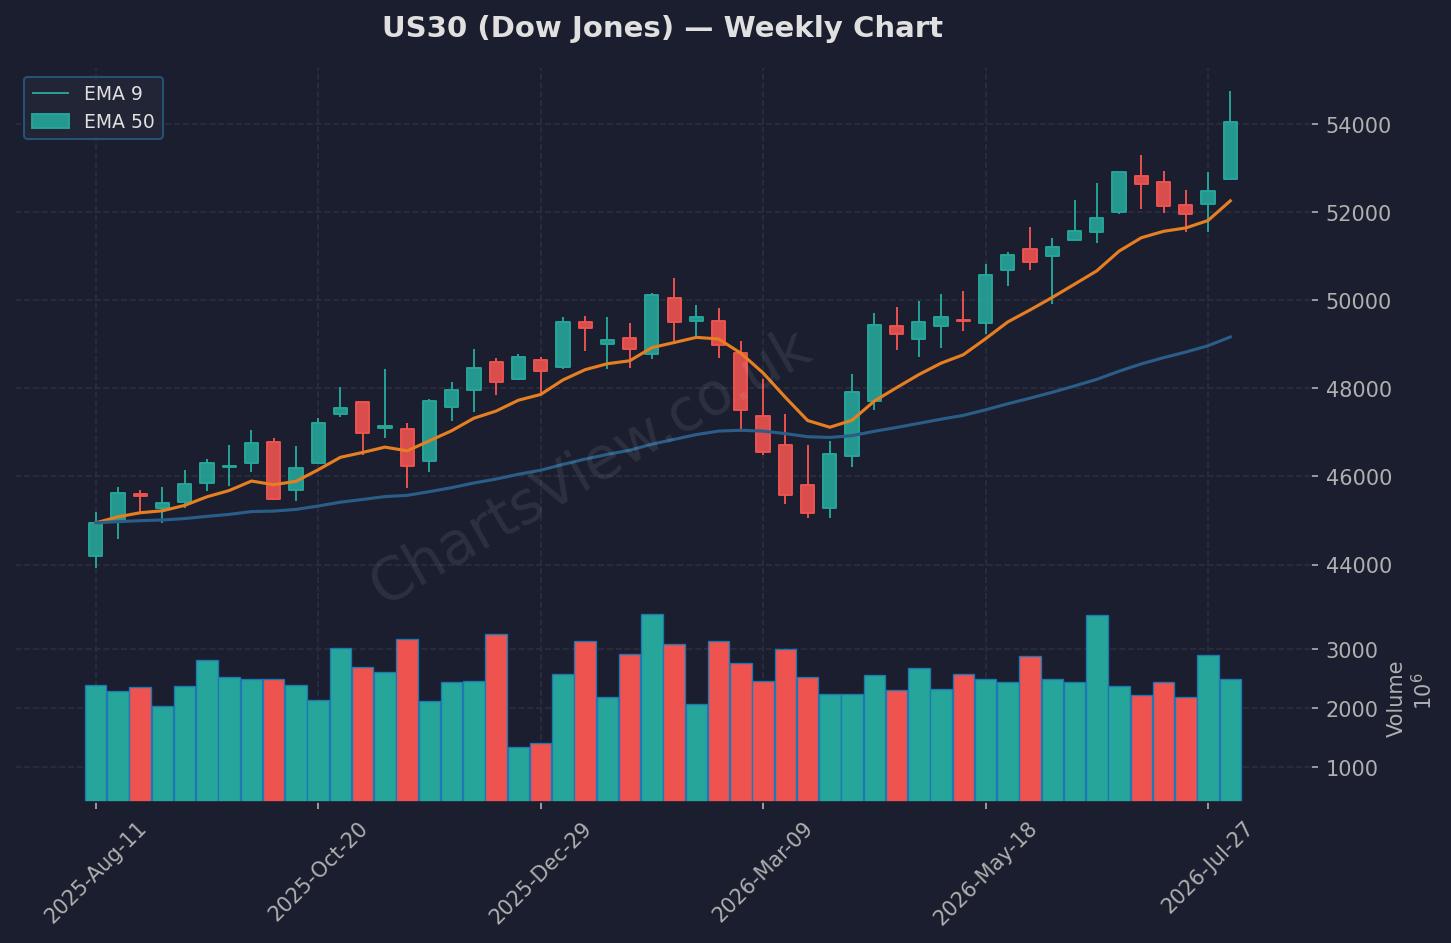
US30 (Dow Jones) Weekly Chart — EMA 9 (orange) & EMA 50 (blue) | Source: ChartsView
US30 closed the week at 54,036.93, up 1.61%, printing a strong bullish weekly candle after reclaiming the 54,000 handle. The 5-day range was wide — a low of 52,759.06 and a high of 54,744.33 — which tells me we had genuine two-way flow, not just a grind higher. Price is now sitting just below the weekly high, which is the immediate resistance to watch at 54,744. On the downside, support comes in at last week's close of 53,885, with stronger backing at the 5-day low of 52,759.
My bias this week is cautiously bullish. If US30 holds above 53,885 and reclaims 54,744, I'm looking for continuation towards 55,000. However, the jobs miss on Friday and ongoing Iran tensions around the Strait of Hormuz are wildcards. A break below 53,885 would shift me neutral, and a close under 52,759 invalidates the bullish structure entirely. The key is whether buyers defend the breakout zone or if we see profit-taking into the week's inflation data.
NAS100 (NASDAQ) — Weekly Outlook
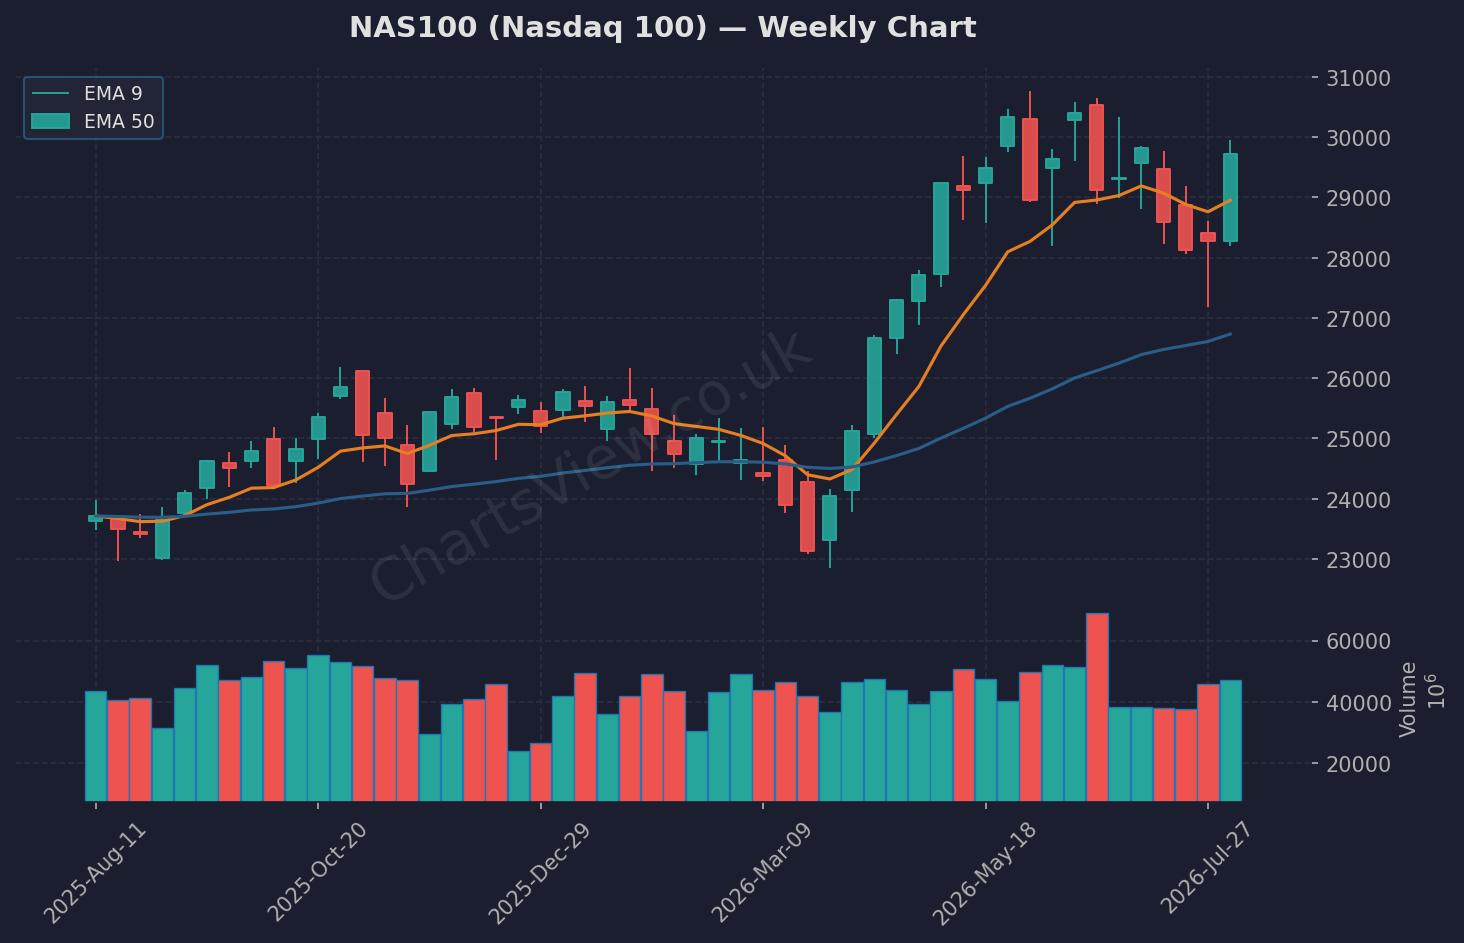
NAS100 (Nasdaq 100) Weekly Chart — EMA 9 (orange) & EMA 50 (blue) | Source: ChartsView
NAS100 was the star performer last week, rallying 3.29% to close at 29,722.30. The 5-day high of 29,946.94 is the level I'm watching — a clean break above 30,000 would be a psychological and technical breakout. Support sits at the previous close of 29,373, with the 5-day low at 28,196 acting as the line in the sand. Tech clearly regained leadership, and with the S&P 500 printing all-time highs, there's momentum behind this move.
I'm bullish above 29,373. If NAS100 can reclaim 29,946 and push through the 30,000 level, I'm targeting 30,500 as the next upside objective. The risk is that Friday's jobs data was a warning shot — if inflation comes in hot this week, tech could give back gains quickly. A failure to hold 29,373 would turn me neutral, and a break of 28,196 flips the bias bearish. Watch for any sector rotation signals — if money starts flowing back into defensives, this rally could stall.
Quick Takes
S&P 500: Closed at an all-time high of 7,757.64 after a 2.07% weekly gain — resistance at the 5-day high of 7,793.68 is the next test, with support at 7,709.96.
Gold: Surged 3.48% to $4,393.60, just shy of the 5-day high at $4,411.50 — geopolitical premium is back in play with Hormuz tensions, watching for a break above $4,411 to target $4,500.
WTI Crude: Up 4.25% to $78.42 as supply fears dominate the narrative — resistance at the 5-day high of $79.43, and a break there opens $80+; support at $77.29.
GBP/USD: Gained 0.46% to 1.3489, testing the 5-day high of 1.3508 — cable looks constructive above 1.3427, but needs to clear 1.3508 to confirm a run towards 1.3600.
Key Events This Week
- Monday, 23:01 GMT — UK BRC Retail Sales Monitor (Jul): Forecast 1.5% vs 1.7% prior. A softer print could weigh on GBP pairs, signalling weaker consumer demand heading into autumn.
- US Inflation Data (CPI/PPI): Not yet available in the calendar provided, but this is the week's biggest risk event. After Friday's jobs miss, any upside surprise in inflation could reignite Fed tightening fears and pressure indices.
- Strait of Hormuz Developments: Ongoing negotiations (or lack thereof) between the US and Iran will continue to drive oil and broader risk sentiment. Any escalation sends crude higher and could trigger a risk-off move in equities.
The Week Ahead — My Game Plan
I'm leaning bullish on US indices as long as the breakout zones hold — 53,885 on US30 and 29,373 on NAS100 are my lines in the sand. The momentum from last week was strong, but Friday's jobs data and this week's inflation numbers could easily flip the script. I'm watching for continuation above last week's highs, but I'm not chasing — I want to see buyers defend support first. If we get a pullback early in the week, I'll be looking for long entries at those key support levels rather than buying the highs. Risk management is critical here — geopolitical headlines can move markets fast, so keep your stops tight and don't overleverage into uncertainty.
Written by Remo, founder of ChartsView. This outlook reflects personal analysis and does not constitute financial advice. Always do your own research and manage your risk.