Tech got absolutely hammered last week, with NAS100 shedding nearly 5% in a sharp risk-off move that caught a lot of traders on the wrong side. This week, I'm watching whether US indices can find support here or if we're in for a deeper correction — the next 48 hours will be critical.
Last Week in Review
Last week was a tale of two markets. While the FTSE 100 held relatively flat with a modest +0.28% gain, US indices took a beating — the NASDAQ 100 plunged 5.10%, the S&P 500 dropped 2.85%, and the Dow Jones fell 1.35%. The tech sell-off was brutal, with Friday's session seeing the NASDAQ post its largest single-day point drop on record. Meanwhile, oil spiked over 4% on escalating Middle East tensions as Iran and Israel exchanged strikes, threatening the fragile ceasefire. It was a classic risk-off rotation, with money fleeing tech and seeking safety elsewhere.
US30 (Dow Jones) — Weekly Outlook
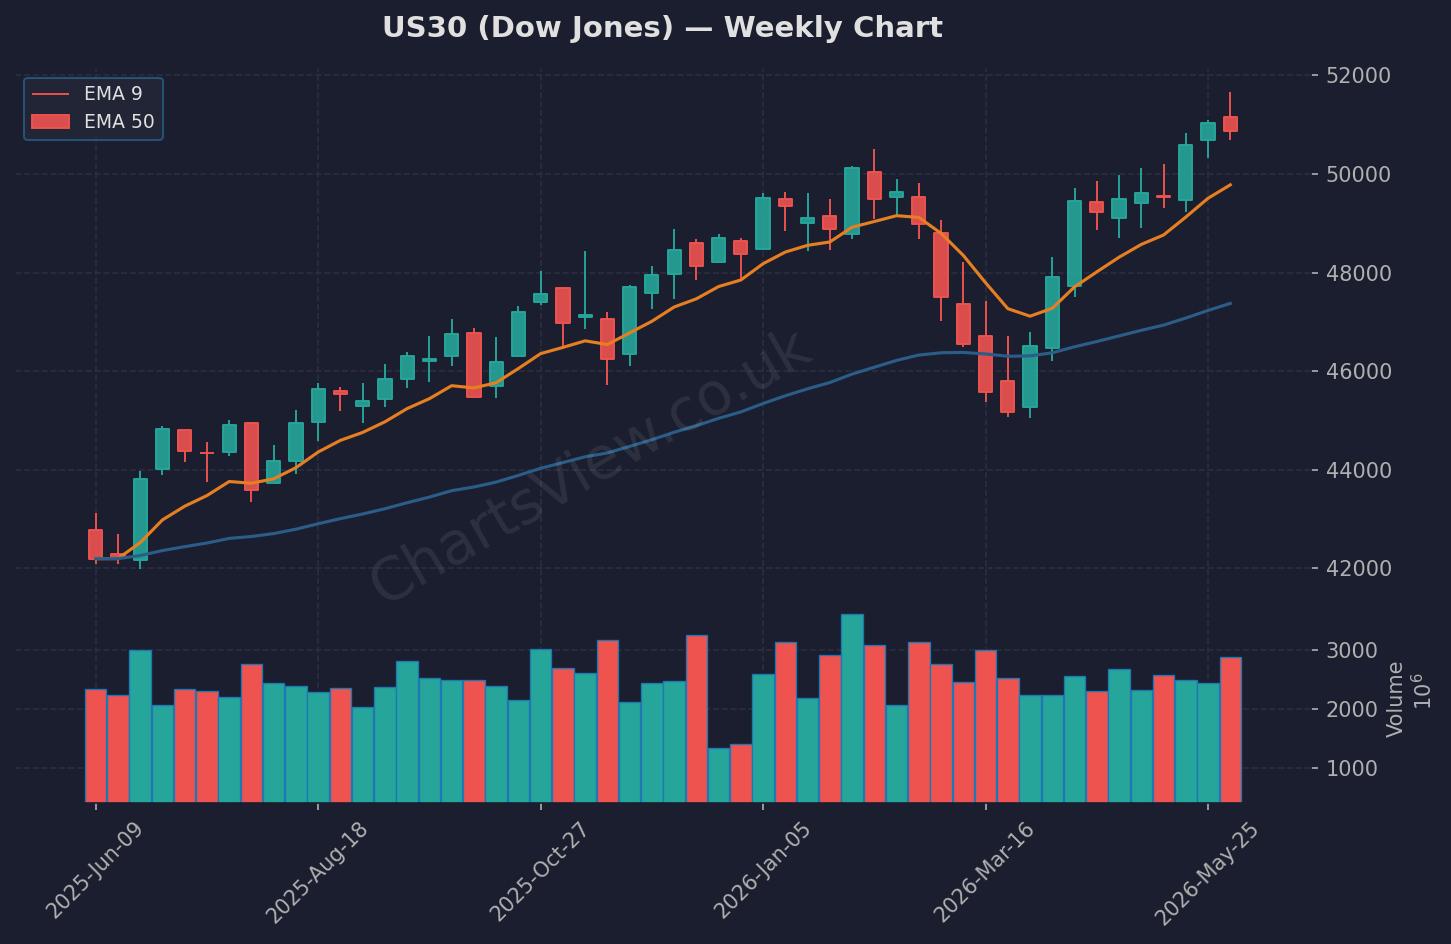
US30 (Dow Jones) Weekly Chart — EMA 9 (orange) & EMA 50 (blue) | Source: ChartsView
US30 closed the week at 50,866.78, down 1.35% and printing a bearish weekly candle that broke below the previous week's close of 51,561.93. The index tested a low of 50,687.07 during the week before bouncing slightly into the close. Key support now sits at that 50,687 level — if we lose that, I'm looking at a move towards the psychological 50,000 handle. Resistance is clearly defined at 51,660.40 (the 5-day high), with the previous close at 51,561.93 acting as a secondary barrier.
My bias this week is cautiously bearish unless we see a strong reclaim of 51,500. The weekly candle structure is weak, and with geopolitical tensions elevated and tech under pressure, I'm not rushing to catch this knife. If US30 holds above 50,687 and starts to reclaim 51,000, I'll reassess for potential longs targeting 51,500-51,660. But if we break 50,687 on volume, I'm looking for continuation lower. The invalidation for bears would be a decisive break and hold above 51,660 — that would signal the dip is being bought aggressively.
NAS100 (NASDAQ) — Weekly Outlook
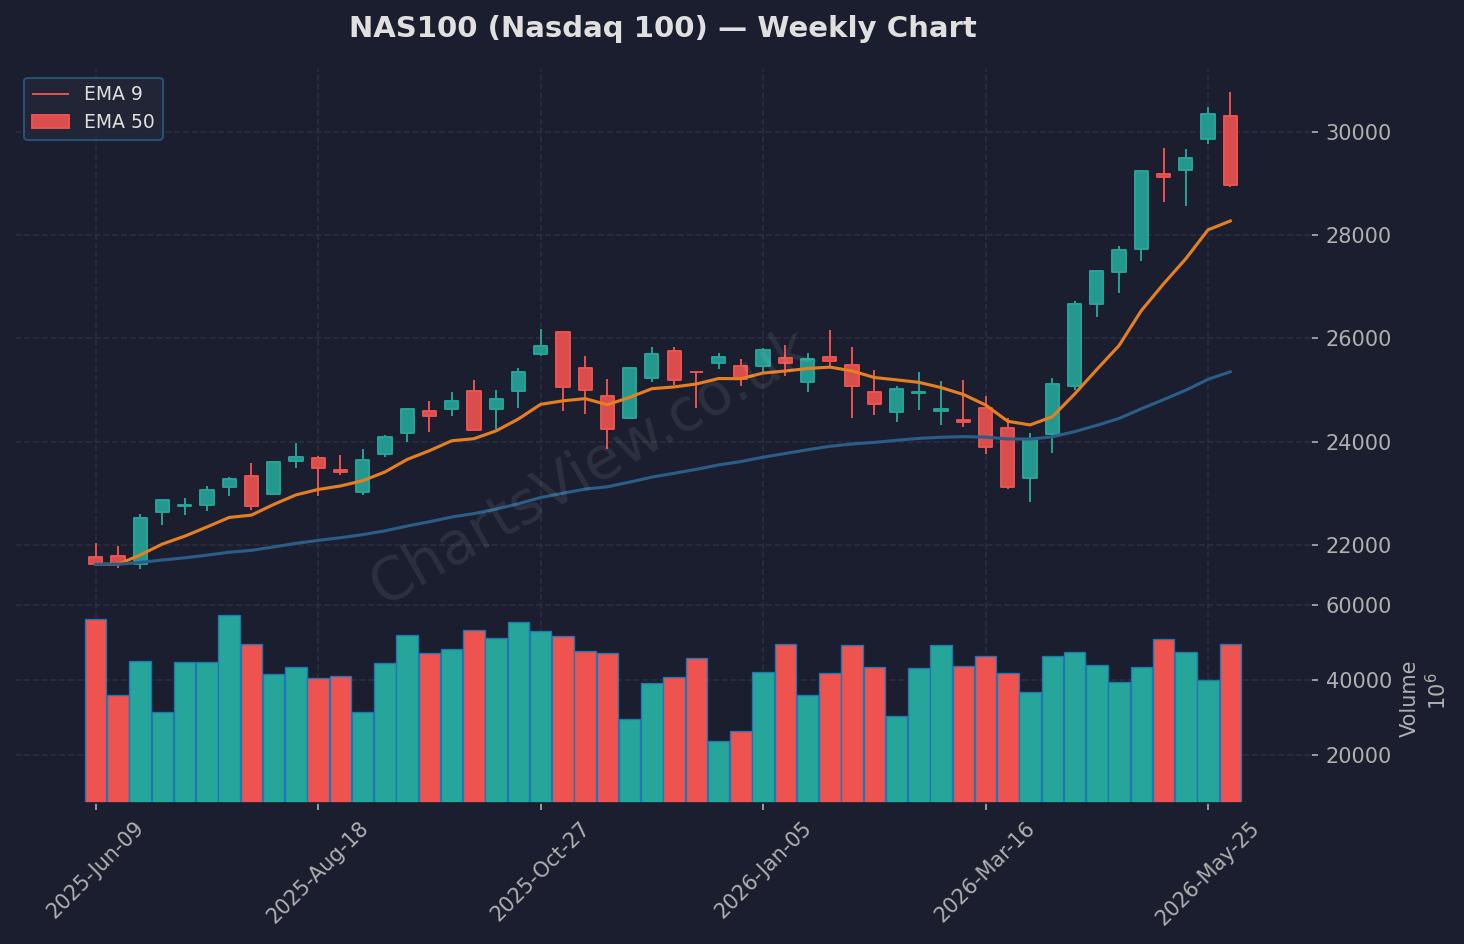
NAS100 (Nasdaq 100) Weekly Chart — EMA 9 (orange) & EMA 50 (blue) | Source: ChartsView
NAS100 was the week's biggest casualty, closing at 28,957.60 after a brutal 4.77% decline from the previous close of 30,407.81. The index printed a 5-day low at 28,929.88 and couldn't hold any meaningful bounce, closing near the lows. This is a clear breakdown, and the tech sector rotation is real — investors are dumping AI-linked names and moving into defensives.
Support is thin here. The 28,929 level is immediate support, but if that fails, we could see a flush towards 28,000. Resistance is now at 30,407 (previous close) and 30,762 (5-day high). My bias is bearish continuation unless we see a strong reversal candle on the daily. I'm watching for a potential dead cat bounce towards 29,500-30,000, which could offer a re-entry short opportunity. Only a reclaim above 30,400 would make me reconsider the bearish structure.
Quick Takes
S&P 500: Down 2.64% to 7,383.74 — sitting just above the 5-day low of 7,368.63. Break of that level opens the door to 7,200. Resistance at 7,584.
FTSE 100: The only major index holding its own, up 0.07% at 10,368.05. Watching 10,238 support and 10,415 resistance — range-bound and boring, but stability is attractive right now.
Gold: Flat at 4,333.80 despite the risk-off move. Failed to hold the 4,500 level (5-day high 4,509.90). Support at 4,319, and I'd expect a bounce there if equities continue to wobble.
WTI Oil: Spiked 4.10% to 94.25 on Middle East tensions. Watching 97.00 (5-day high) as next resistance. If geopolitical risk escalates further, we could see a run towards 100.
Key Events This Week
- Monday, 06:00 GMT — Germany Factory Orders (April): Forecast -1.2% vs previous +5.0%. A sharp contraction expected — could weigh on European sentiment and the DAX.
- Monday, 23:01 GMT — UK BRC Retail Sales Monitor (May): Forecast +0.6% vs previous -3.4%. A potential bounce in UK consumer spending — watch for GBP reaction if it beats.
This week's calendar is relatively light on major tier-one events, which means price action will likely be driven by geopolitical headlines (Iran/Israel tensions) and any further rotation out of tech. The biggest risk is headline-driven volatility — keep an eye on oil prices as a proxy for Middle East escalation risk.
The Week Ahead — My Game Plan
I'm approaching this week with a defensive mindset. The tech sell-off was violent, and until I see a proper reversal structure on NAS100 and SPX, I'm not interested in catching falling knives. My focus is on US30 — if it holds 50,687 and starts to reclaim 51,000, I'll look for tactical longs. Otherwise, I'm waiting for cleaner setups or potential short entries on any dead cat bounces into resistance. Risk management is everything in this environment — don't force trades, and keep your stops tight. Let the market show its hand before committing capital.
Written by Remo, founder of ChartsView. This outlook reflects personal analysis and does not constitute financial advice. Always do your own research and manage your risk.