

Last week delivered a classic risk-on rotation — equities pushed higher across the board whilst tech took a breather, and precious metals absolutely ripped as the dollar softened. This week, I'm watching whether US30 can finally crack 53,000 and whether NAS100 can reclaim 30,000 after Friday's pullback left it vulnerable.
Last Week in Review
Last week was a proper risk-on grind higher, with the Dow leading the charge at +1.97% and the S&P 500 adding +1.76%, whilst NAS100 lagged at just +0.72% as tech took profits after a monster run. The FTSE joined the party with +1.86%, and precious metals stole the show — Gold surged +3.49% to 4,163 and Silver ripped +4.69% to 62.27. The dollar weakened across the board, giving Cable a +0.65% boost to 1.3340, whilst oil drifted lower on OPEC+ output hike chatter. It was a week of rotation rather than panic, with money flowing out of mega-cap tech and into cyclicals, metals, and the Dow.
US30 (Dow Jones) — Weekly Outlook
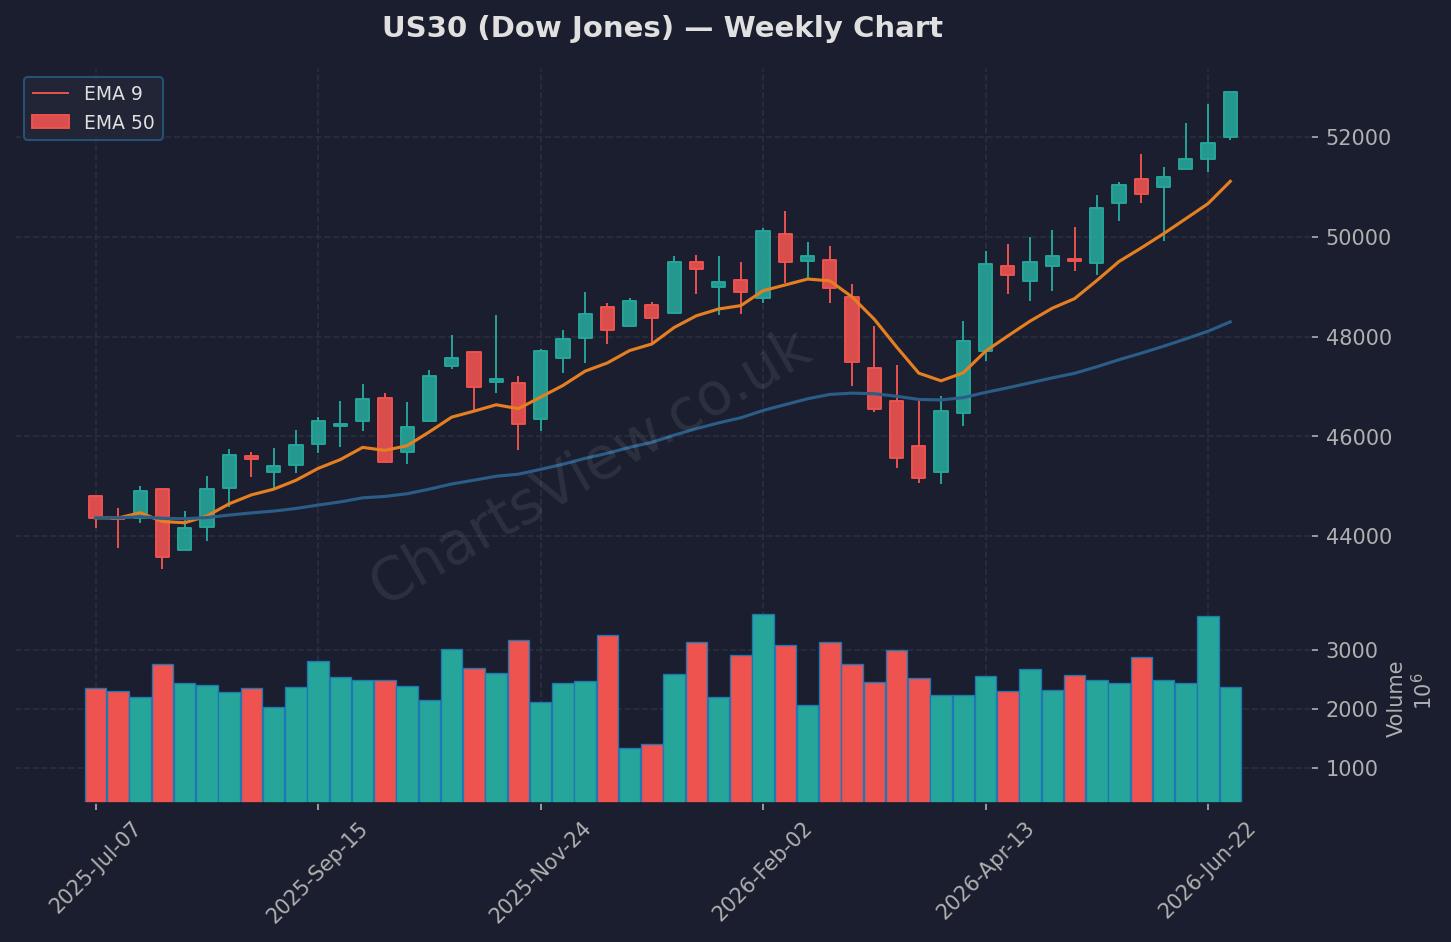
US30 (Dow Jones) Weekly Chart — EMA 9 (orange) & EMA 50 (blue) | Source: ChartsView
US30 closed the week at 52,900, just shy of the 5-day high at 52,903 — a bullish weekly candle with a strong close near the highs. This is classic breakout behaviour, and the index is now within touching distance of 53,000, a level it's never seen before. Support is rock solid at the previous close of 52,305, with deeper support at the 5-day low of 51,614. My bias this week is bullish continuation — if US30 holds above 52,300 and takes out 52,903, I'm looking for a push towards 53,200-53,500. The momentum is there, the weekly candle is clean, and the Dow is outperforming tech, which tells me institutional money is rotating into value and cyclicals. Invalidation comes if we lose 52,300 and close back below 52,000 — that would signal a failed breakout and open the door to a retest of 51,600. The setup I'm watching: a Monday or Tuesday reclaim of 52,903 with volume, then I'm targeting 53,200 on the first wave. Keep stops tight below 52,300.
NAS100 (NASDAQ) — Weekly Outlook
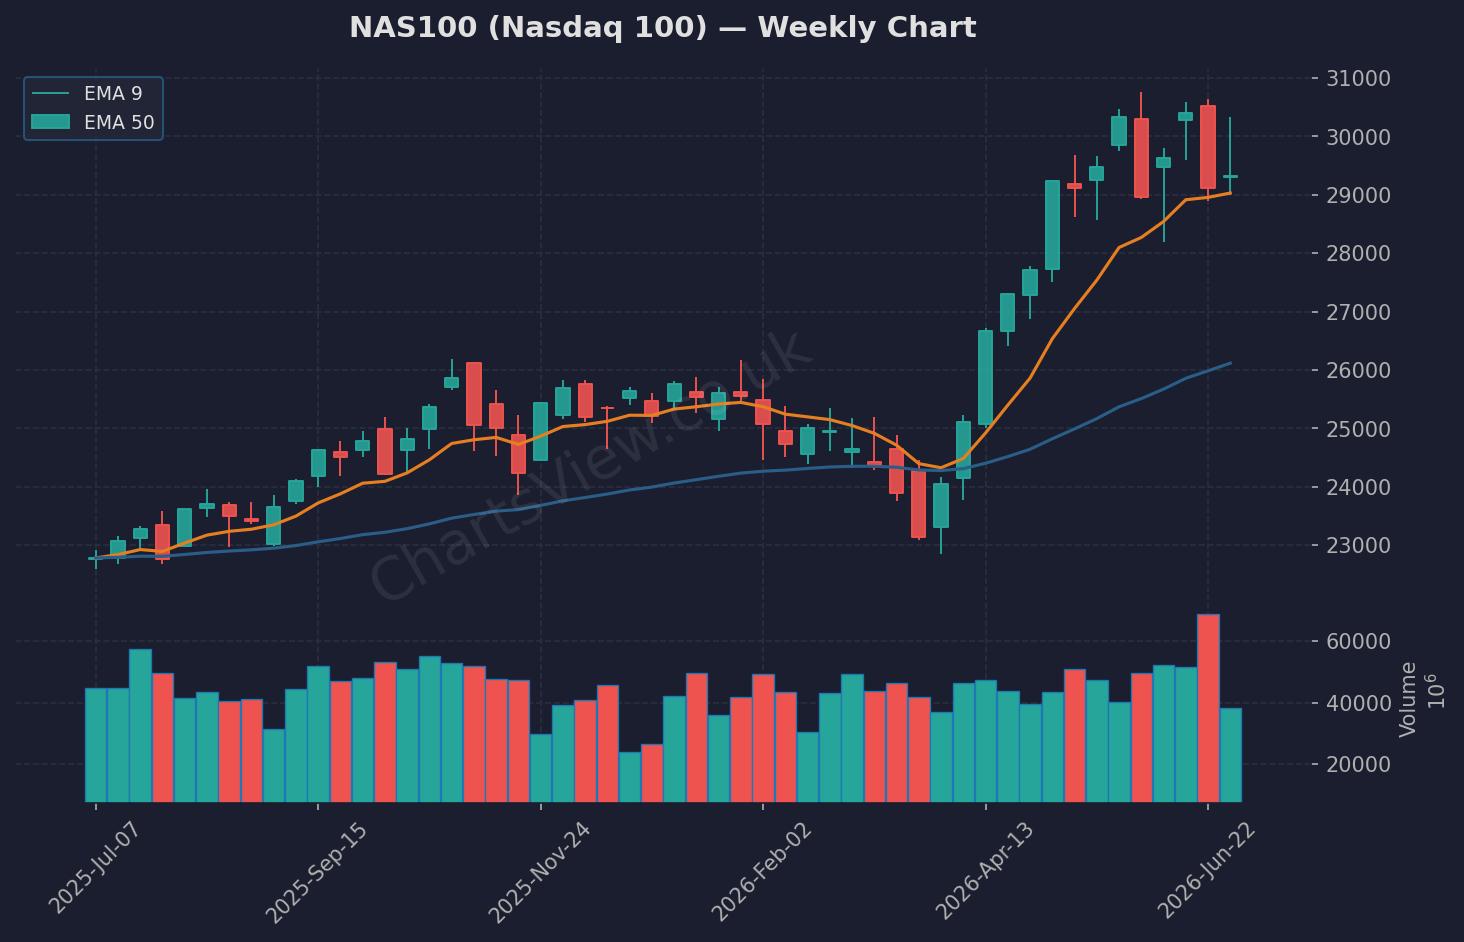
NAS100 (Nasdaq 100) Weekly Chart — EMA 9 (orange) & EMA 50 (blue) | Source: ChartsView
NAS100 closed at 29,329, down -1.61% on Friday and well off the 5-day high of 30,328 — this is a bearish engulfing daily candle that's put a dent in the recent rally. The weekly gain of +0.72% is the weakest of the major indices, and the rejection from 30,328 is significant. Support sits at the previous close of 29,809, then 28,890 (the 5-day low). My bias here is cautiously bearish to neutral — NAS100 needs to reclaim 29,809 and push back above 30,000 to regain bullish structure. If it fails and breaks 28,890, we could see a deeper pullback towards 28,500. The Nvidia delay news (next-gen AI racks pushed to 2028) is weighing on sentiment, and tech is clearly losing momentum to the Dow. I'm not shorting aggressively here, but I'm also not chasing longs unless we reclaim 30,000 with conviction. Watch for a bounce off 29,000 — if it holds, we might get a second leg up. If it breaks, step aside.
Quick Takes
S&P 500: Closed at 7,483 after a -0.21% Friday pullback, but still up +1.76% on the week — holding above 7,294 support keeps the bullish structure intact, watching for a push towards 7,540 resistance.
Gold: Absolute monster move to 4,163 (+3.49% weekly), smashing through 4,112 resistance — if it holds above 4,112 on a retest, I'm looking for 4,215 next, then 4,300.
GBP/USD: Cable rallied to 1.3340 (+0.65%), testing the 5-day high at 1.3385 — a break above 1.3385 opens the door to 1.3450, but a rejection here could see a pullback to 1.3254 support.
WTI Oil: Drifted lower to 68.73 (-1.11%) on OPEC+ output hike talk — support at 67.04 is critical; a break below opens 65.00, but a bounce here could retest 71.60 resistance.
Key Events This Week
- Monday 14:00 GMT — US ISM Services PMI (Jun): Forecast 54.2 vs 54.5 prior. This is the biggest risk event of the week — a miss below 54 could spark a risk-off move in equities, whilst a beat keeps the bullish momentum alive. Watch US30 and NAS100 closely into the 14:00 release.
- Monday 09:00 GMT — Eurozone Retail Sales MoM (May): Forecast +0.2% vs -0.4% prior. A rebound here supports the EUR and could give European indices a lift, but it's secondary to the US data.
- Monday 16:00 GMT — ECB President Lagarde Speech: Lagarde's been hinting at an early exit to enter French politics — any clarity here could move EUR/USD and European equities. Watch for dovish/hawkish tones on rates.
- Monday 15:00 GMT — Fed Waller Speech: Waller's been a hawk recently — any comments on rate cuts or inflation could shift USD and indices. Less impactful than the ISM data, but worth monitoring.
- Monday 08:30 GMT — UK S&P Global Construction PMI (Jun): Forecast 40.1 vs 38.2 prior. A slight improvement, but still deep in contraction — limited impact on FTSE unless it's a major surprise.
The Week Ahead — My Game Plan
This week, I'm leaning bullish on US30 and cautious on NAS100 until it proves it can reclaim 30,000. The rotation into cyclicals and value is clear, and the Dow is setting up for a historic breakout above 53,000. I'm watching the ISM Services PMI at 14:00 GMT today — a beat keeps the bulls in control, a miss could trigger a sharp pullback. My primary setup is a US30 long above 52,903 targeting 53,200, with a stop below 52,300. On NAS100, I'm waiting for a reclaim of 29,809 before committing — no point fighting the tape when tech is lagging. As always, risk management is non-negotiable — size down into key events, honour your stops, and don't chase breakouts without confirmation. Let's make it a profitable week.
Written by Remo, founder of ChartsView. This outlook reflects personal analysis and does not constitute financial advice. Always do your own research and manage your risk.