US indices staged a solid recovery last week despite oil's worst collapse in six years, as weekend US-Iran talks offered hope for a resolution to the Strait of Hormuz crisis. This week, I'm watching whether US30 can reclaim 48,000 and hold it, or if we're setting up for another leg lower as inflation data keeps the Fed sidelined.
Last Week in Review
Last week delivered a proper risk-on rally across US indices, with the NASDAQ leading the charge at +3.82%, followed by the S&P 500 at +3.10% and US30 at +2.67%. The dominant theme was relief — oil crashed nearly 15% as US-Iran weekend talks raised hopes for reopening the Strait of Hormuz, whilst equities shrugged off sticky inflation data (CPI came in at 3.3% YoY, driven by energy). It was a trending week, not choppy — indices climbed steadily off Monday lows, though US30 still closed 269 points below its 5-day high of 48,323.95. The FTSE lagged at just +1.57%, weighed down by energy sector losses.
US30 (Dow Jones) — Weekly Outlook
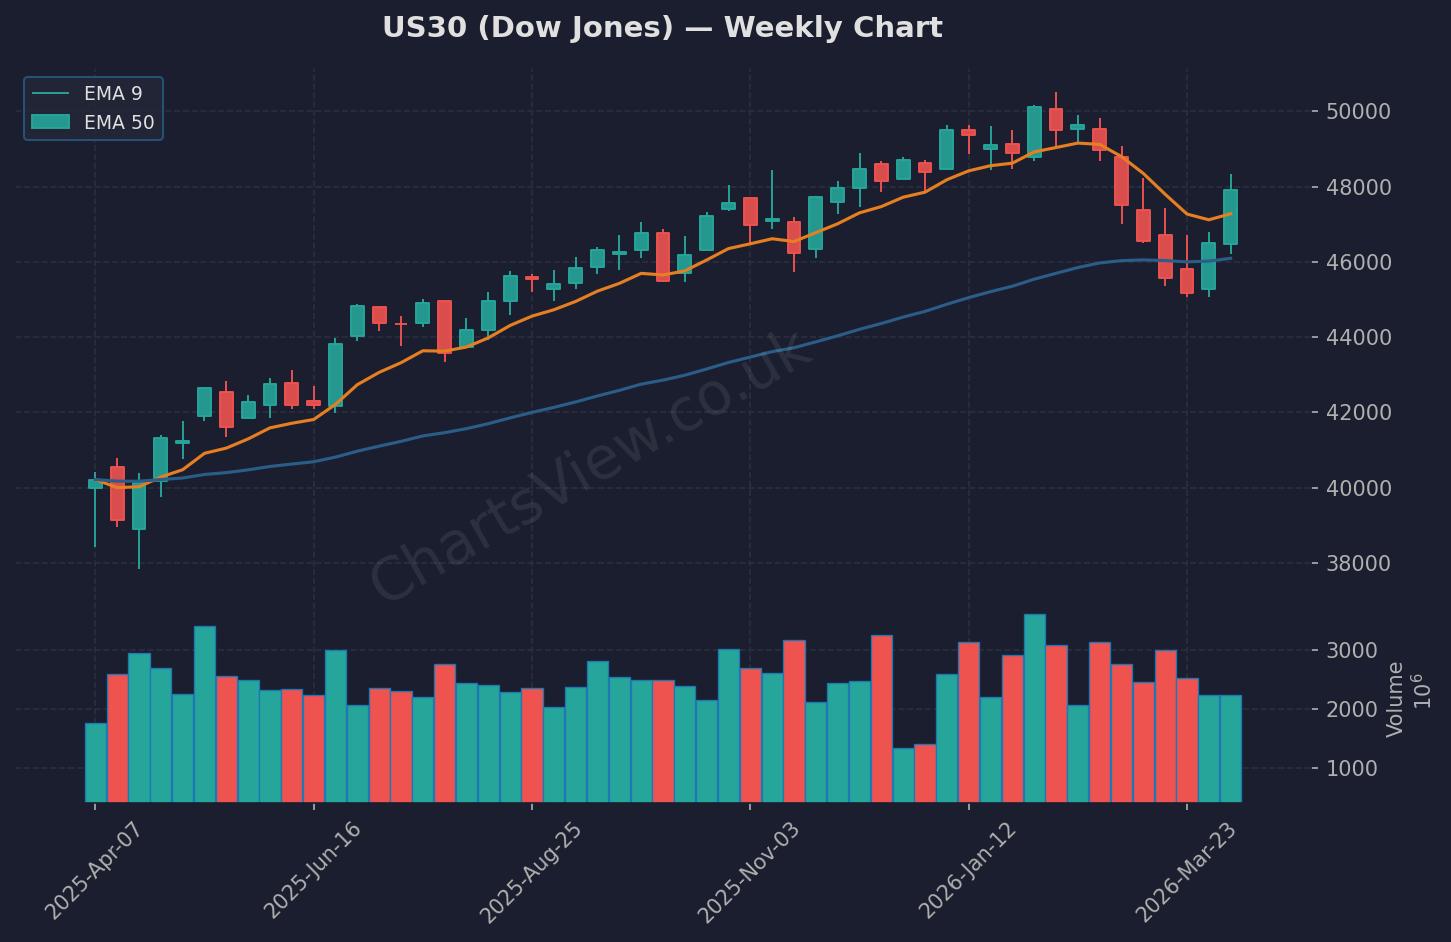
US30 Weekly Chart — EMA 9 (orange) & EMA 50 (blue) | Source: ChartsView
US30 closed the week at 47,916.57, up 2.67% but still forming a lower high relative to the 48,323.95 peak earlier in the week. The weekly candle is bullish, but we've failed to reclaim the psychological 48,000 level convincingly. Key support now sits at the previous close of 48,185.80 (which we're currently below), with stronger support at the 5-day low of 46,214.77 — that's the line in the sand. Resistance is clear: 48,185.80 must be reclaimed, then 48,323.95 is the gate to further upside.
My bias this week is cautiously bullish IF we can reclaim and hold 48,000. The Iran talks and collapsing oil should be equity-positive, but consumer sentiment just hit a record low (47.6 vs 53.3 prior), and inflation isn't cooperating. If US30 reclaims 48,185 and holds above it on a daily close, I'm looking for longs targeting 48,300, then 48,500. Invalidation is simple: a break below 47,500 flips me neutral, and a daily close under 46,800 turns me bearish. This week is about reclaim or reject — no middle ground.
NAS100 (NASDAQ) — Weekly Outlook
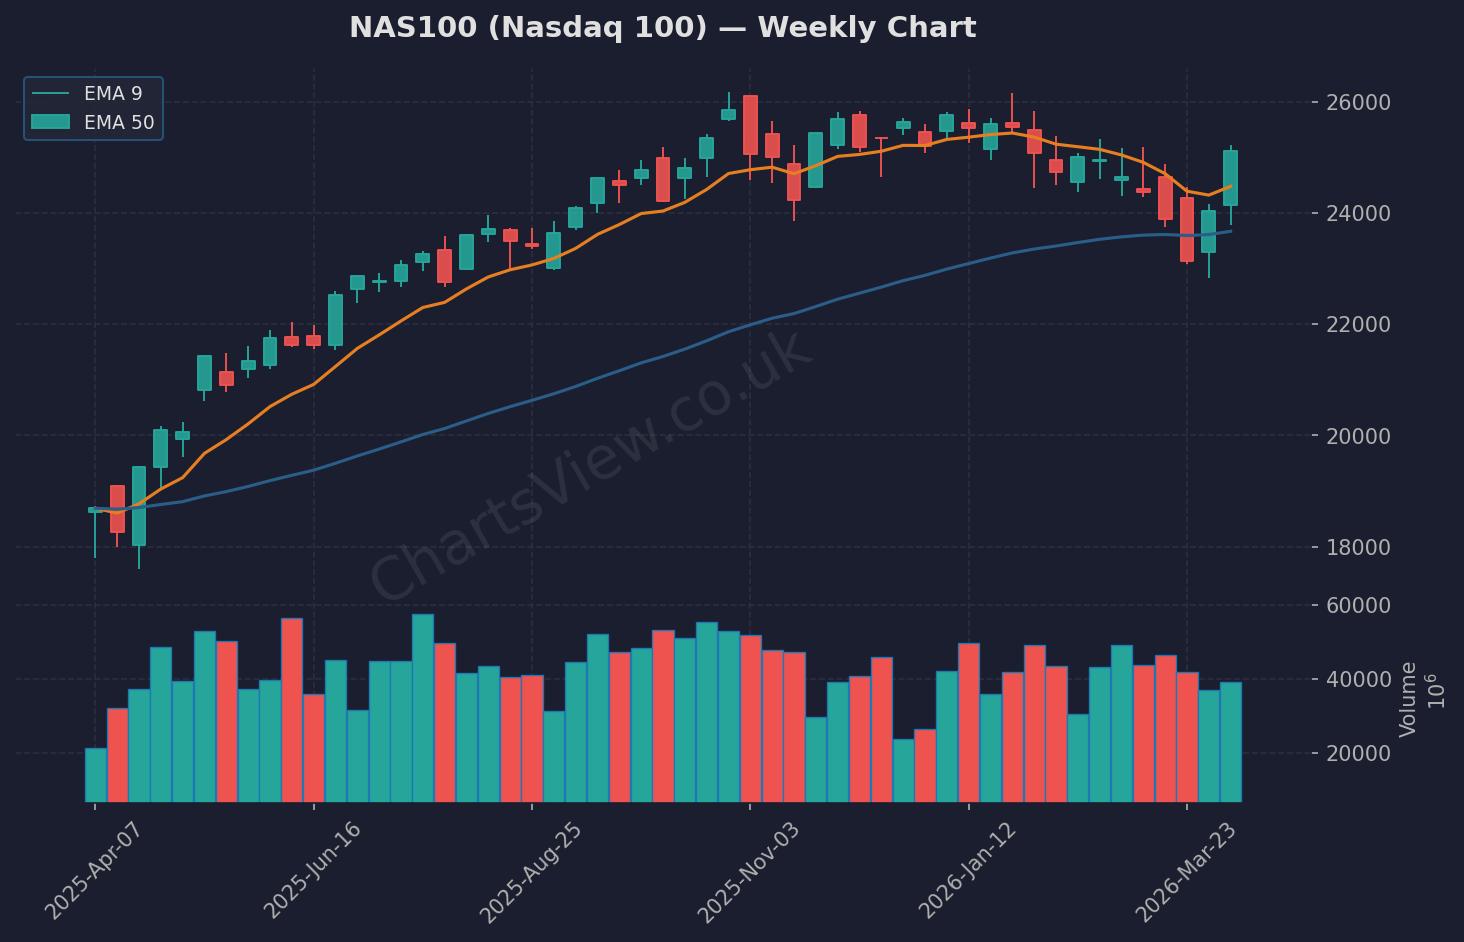
NAS100 Weekly Chart — EMA 9 (orange) & EMA 50 (blue) | Source: ChartsView
NAS100 closed at 25,116.34, up 3.82% and showing the strongest relative strength of the major indices. The weekly candle is a solid bullish engulfing, and we're now testing the 5-day high of 25,226.06 as immediate resistance. Tech caught a bid as AI names rebounded (despite the Altman Molotov cocktail drama), and the sector is ignoring inflation for now. Support is at the previous close of 25,082.09, with stronger support at 24,500 if we roll over.
I'm bullish NAS100 this week as long as we hold above 25,000. A break and hold above 25,226 opens the door to 25,500+. The 5-day low of 23,779.85 is ancient history now — we've left that behind. Invalidation: a daily close back below 24,800 would concern me, suggesting the rally is exhausted. Watch for any Fed speak that could reignite rate concerns, but for now, tech is leading and I'm following.
Quick Takes
S&P 500: Closed at 6,816.89, up 3.10% — holding above the previous close of 6,824.66 would be ideal, but we're slightly below; watching 6,845.77 (5-day high) as the next resistance.
WTI Oil: Collapsed 14.93% to 95.63 — worst week in six years; if Iran talks succeed, we could see 90.00 or lower, which is bullish for equities but watch for a relief bounce first.
Gold: Up 2.45% to 4,771.00 — safe-haven bid remains intact despite equity strength; resistance at 4,851.00 (5-day high), support at 4,605.00.
GBP/USD: Surged 2.08% to 1.3461 on dollar weakness; now testing 5-day high of 1.3484 — a break above opens 1.3600, but watch for mean reversion if dollar finds support.
Key Events This Week
- Monday, 12:30 GMT — US Core Inflation Rate YoY (Mar): Came in at 2.6% vs 2.7% forecast — slightly cooler than expected, but still elevated. This keeps the Fed on hold.
- Monday, 12:30 GMT — US Inflation Rate YoY (Mar): Hit 3.3% as expected, driven by energy. The headline number matters more to consumers than traders, but it's feeding into sentiment.
- Monday, 14:00 GMT — Michigan Consumer Sentiment Prel (Apr): Crashed to 47.6 vs 52.0 forecast — record low. This is the biggest risk event from last week still echoing into this one. If consumers are this pessimistic, spending could stall.
- Monday, 14:00 GMT — US Factory Orders MoM (Feb): Flat at 0% vs -0.2% forecast — not a market mover, but confirms manufacturing is treading water.
The Michigan sentiment print is the one that concerns me most — it's a leading indicator for consumer spending, and if that rolls over, equities won't hold these levels for long.
The Week Ahead — My Game Plan
I'm leaning bullish this week, but it's conditional: US30 needs to reclaim 48,000 and NAS100 needs to hold 25,000. If those levels hold, I'm looking for continuation to 48,300 and 25,500 respectively. The Iran talks are the wildcard — a breakthrough could send oil lower and equities higher, but a breakdown could reverse everything. I'm keeping stops tight and watching daily closes, not intraday noise. If we lose Friday's lows, I'm flat until we find a new range. Risk management isn't optional in this environment — size down, use stops, and don't chase breakouts without confirmation. Let's see if the bulls can follow through.
Written by Remo, founder of ChartsView. This outlook reflects personal analysis and does not constitute financial advice. Always do your own research and manage your risk.