US indices closed the week modestly higher despite Friday's sharp intraday volatility, whilst the dollar took a hammering following coordinated intervention from the US and Japan to support the yen. This week, all eyes are on the US jobs report and ISM data — both capable of shifting sentiment quickly if they surprise.
Last Week in Review
Last week delivered modest gains across US indices, with the S&P 500 up 1.03%, NASDAQ 100 up 0.84%, and the Dow Jones adding 0.53%. The standout story was the coordinated US-Japan intervention to prop up the yen, which sent USD/JPY tumbling 4.47% and sparked a sharp rally in cable and the euro. WTI crude collapsed 5.86% as Middle East tensions eased following Trump's announcement that planned strikes on Iran were called off. It was a week of headline-driven whipsaws rather than clean trending moves — classic late-summer price action.
US30 (Dow Jones) — Weekly Outlook
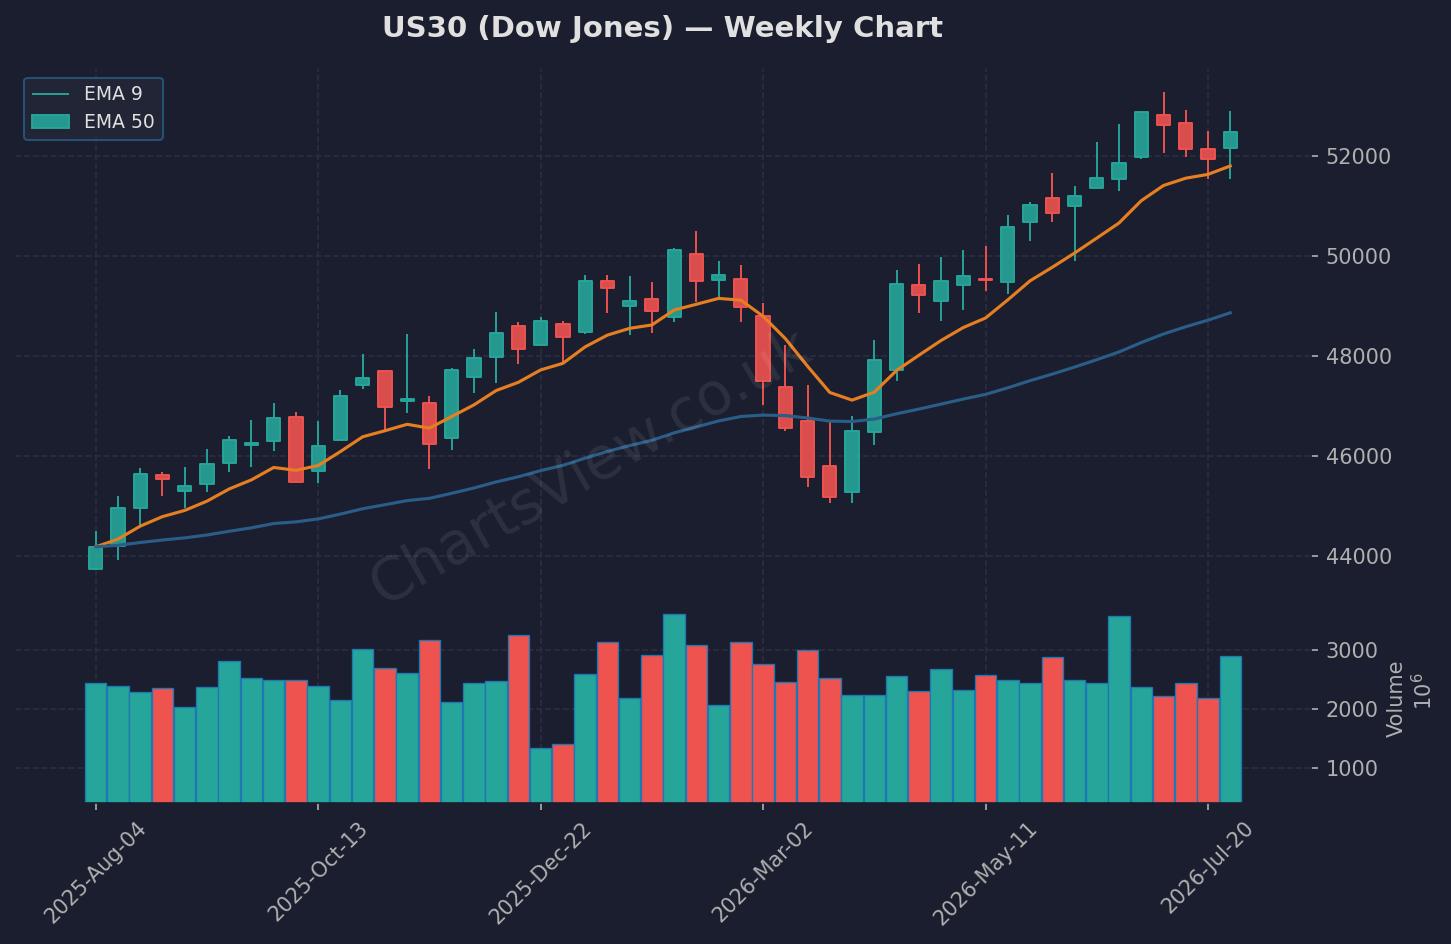
US30 (Dow Jones) Weekly Chart — EMA 9 (orange) & EMA 50 (blue) | Source: ChartsView
US30 closed the week at 52,485.03, up 0.53%, printing a small-bodied bullish candle with wicks on both sides — a sign of indecision after testing both the 5-day high at 52,901.87 and the 5-day low at 51,551.18. That's a 1,350-point range, and we're sitting in the upper third of it, which tells me buyers are still in control — but only just. Key support sits at the previous close of 52,208, with the 5-day low at 51,551 acting as the line in the sand. If that breaks, we're likely heading back towards 51,000. On the upside, resistance is clear at the 5-day high of 52,901, and a clean break above that opens the door to 53,500. My bias this week is cautiously bullish — I'm looking for a hold above 52,200 and a reclaim of 52,900 to confirm continuation. If we get that, I'm targeting 53,500 on longs. Invalidation is simple: a break and close below 52,000 flips me neutral, and sub-51,550 turns me bearish. The jobs report on Friday is the wildcard — a hot number could fuel the breakout, whilst a miss could see us flush back into the range.
NAS100 (NASDAQ) — Weekly Outlook
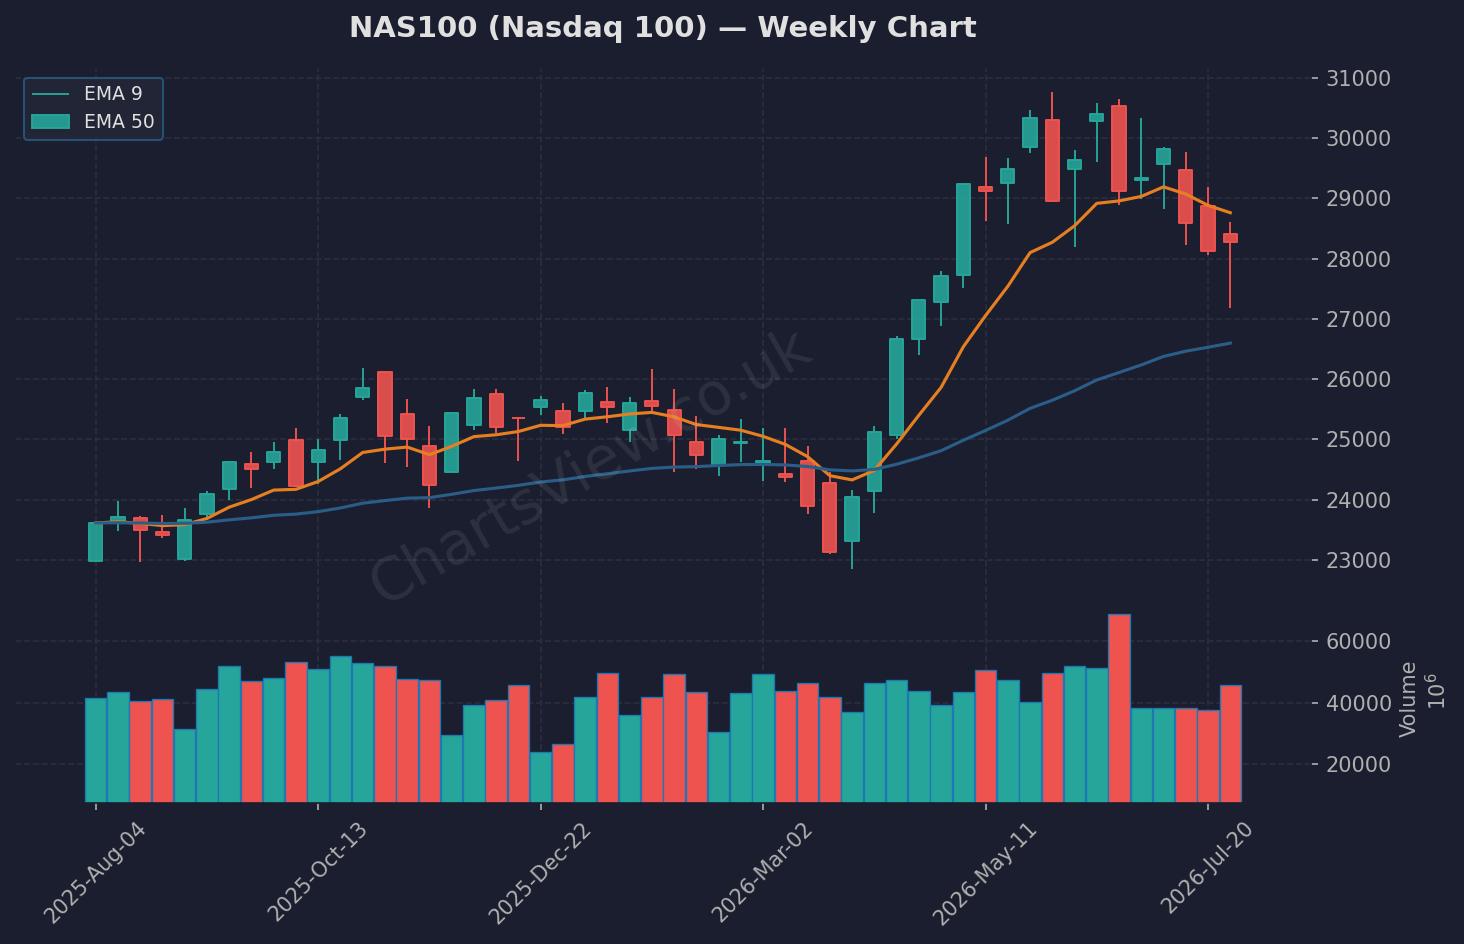
NAS100 (Nasdaq 100) Weekly Chart — EMA 9 (orange) & EMA 50 (blue) | Source: ChartsView
NAS100 closed at 28,274.19, up 0.60%, after a volatile week that saw it spike to a 5-day high of 28,606.78 before pulling back. The weekly candle is a bullish hammer with a long lower wick down to 27,176.03 — a clear rejection of lower prices and a sign that dip buyers are still active. That 5-day low at 27,176 is now critical support; lose that and we're likely heading sub-27,000. On the upside, the 5-day high at 28,606 is the immediate resistance, and a break above that level puts 29,000 in play. My bias is bullish as long as we hold above 28,100 (previous close at 28,106.35). Big Tech earnings momentum has been strong, and the sector rotation into financials hasn't derailed the NASDAQ yet. I'm watching for a reclaim of 28,600 to trigger longs targeting 29,000. Invalidation: sub-28,000 makes me cautious, and a break of 27,500 flips me bearish. This week's ISM data and Friday's jobs report will dictate whether we break out or roll over.
Quick Takes
S&P 500: Closed at 7,489.72, up 0.70%, sitting just below the 5-day high of 7,512.04 — a break above that confirms bullish continuation towards 7,600.
Gold: Relentless. Now at 4,111.70, up 1.55% on the day and 1.91% on the week. Support at 4,050 (previous close 4,049.10), resistance at the 5-day high of 4,145.50 — watching for a breakout above 4,150 to target 4,200.
GBP/USD: Cable ripped 1.38% higher to 1.3473 following the dollar's collapse. The 5-day high at 1.3506 is the next target — a break there opens 1.3600. Support sits at 1.3290 (previous close).
WTI Oil: Plunged 6.09% to 79.51 as geopolitical risk premiums unwound. The 5-day low at 78.78 is key support — lose that and we're heading to 75.00. Resistance at 84.67 (previous close).
Key Events This Week
- Monday, 14:00 GMT — US ISM Manufacturing PMI (Jul): Forecast 54 vs 53.3 prior. A beat here would support the bullish case for indices and pressure the dollar further. This is the week's first major data point.
- Monday, 06:00 GMT — Germany Retail Sales MoM (Jun): Forecast -0.5% vs 1.1% prior. A weak print could weigh on European sentiment and the euro.
- Friday (time TBC) — US Non-Farm Payrolls (Jul): Data not yet available, but this is the week's biggest risk event. A hot jobs number could reignite dollar strength and cap equity upside, whilst a miss could fuel further rallies in indices and precious metals.
The Week Ahead — My Game Plan
My bias this week is cautiously bullish on US indices, but I'm not chasing — I need confirmation. I'm watching US30 above 52,200 and NAS100 above 28,100 as my green lights for long setups. The ISM data today and Friday's jobs report are the two events that could either validate or invalidate this bias, so I'm keeping position sizes tight and stops disciplined. If we break above resistance on both indices early in the week, I'll be adding to longs targeting 53,500 on US30 and 29,000 on NAS100. If we fail and roll over, I'm flat — no heroics. Risk management isn't optional in this environment; it's the only reason you'll still be trading next month. Let's make it a profitable week.
Written by Remo, founder of ChartsView. This outlook reflects personal analysis and does not constitute financial advice. Always do your own research and manage your risk.