US indices closed May on a strong note with the Nasdaq leading the charge at +2.89% for the week, whilst the FTSE lagged behind in negative territory. This week brings ISM Manufacturing data and a test of whether the bulls can push US30 through 51,100 or if we're setting up for a pullback from these elevated levels.
Last Week in Review
Last week delivered a solid risk-on session across US markets, with the Nasdaq 100 surging +2.89% and the Dow Jones grinding +0.90% higher to close at 51,032. The S&P 500 added +1.43%, continuing its march towards record territory. In contrast, the FTSE 100 slipped -0.54% to 10,409, weighed down by Sterling weakness and profit-taking. Commodities were mixed — Natural Gas exploded +10.49% on supply concerns, whilst Gold consolidated near $4,550 after a +2.35% weekly gain. The week's price action was trending rather than choppy, with US indices holding higher lows throughout and tech stocks continuing to attract institutional flows.
US30 (Dow Jones) — Weekly Outlook
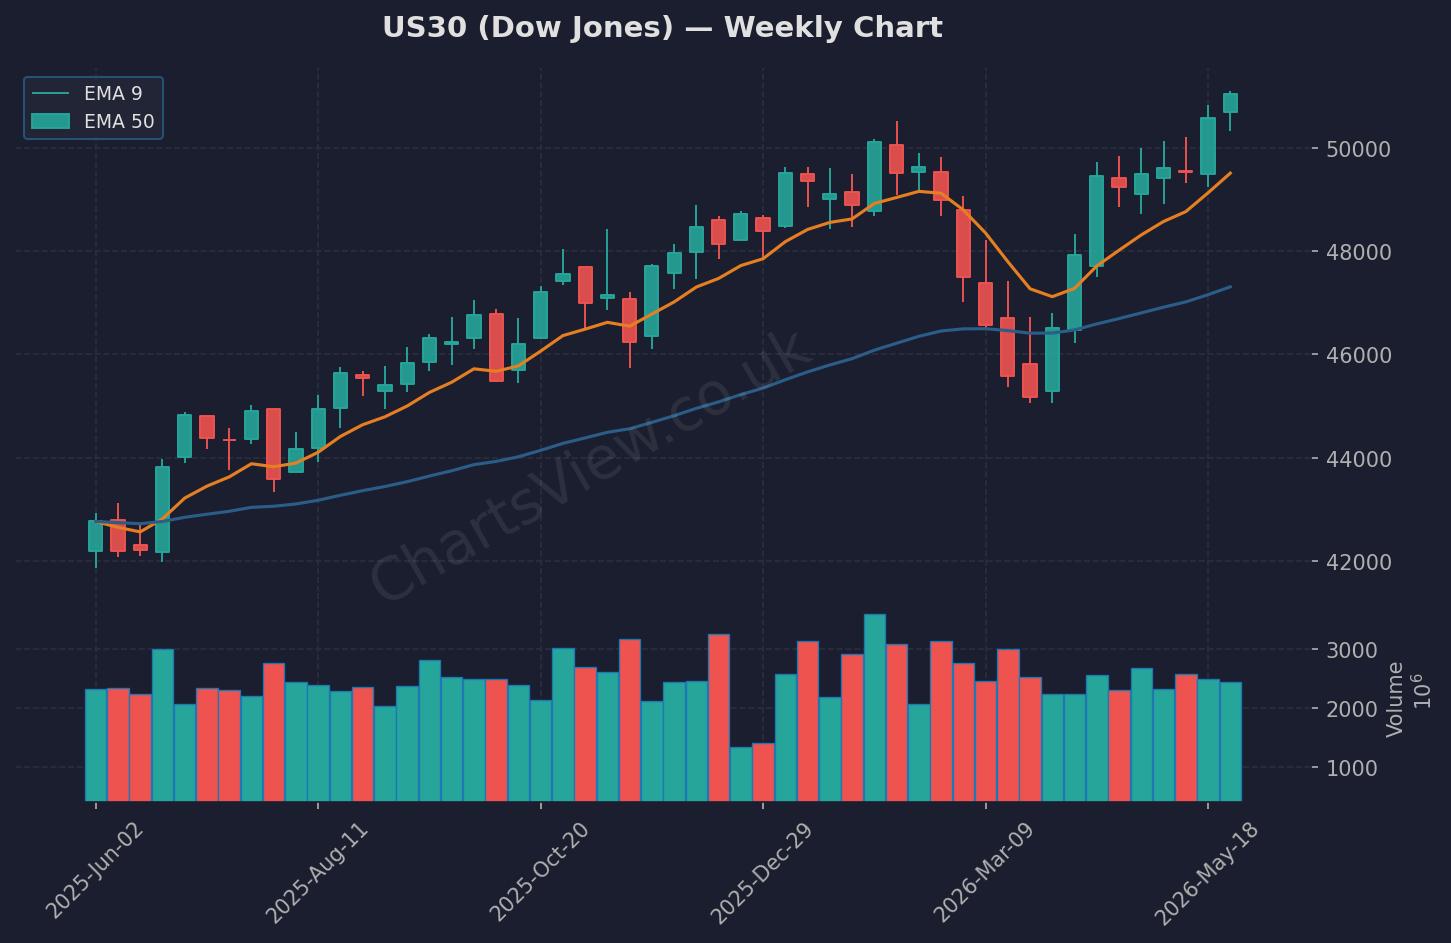
US30 (Dow Jones) Weekly Chart — EMA 9 (orange) & EMA 50 (blue) | Source: ChartsView
US30 closed the week at 51,032, up +0.72% on Friday and printing a bullish weekly candle with a higher high and higher low. The index is now testing the upper end of its recent range, with the 5-day high at 51,094 acting as immediate resistance. A clean break and hold above 51,100 would open the door to further upside, potentially targeting the psychological 51,500 level. On the downside, support sits at the previous close of 50,669, with the 5-day low at 50,314 marking the key level that must hold to keep the bullish structure intact.
My bias this week is cautiously bullish above 50,650. If US30 holds above this level and reclaims 51,100 on a 4-hour close, I'm looking for continuation longs targeting 51,500. However, a failure to break 51,094 followed by a move back below 50,650 would invalidate the bullish setup and signal a potential retracement towards 50,300. The ISM Manufacturing PMI on Monday will be critical — a strong print above 52.6 should fuel further upside, whilst a miss could trigger profit-taking from these elevated levels. Watch for how price reacts at 51,094 — a rejection here with heavy volume would be an early warning sign.
NAS100 (NASDAQ) — Weekly Outlook
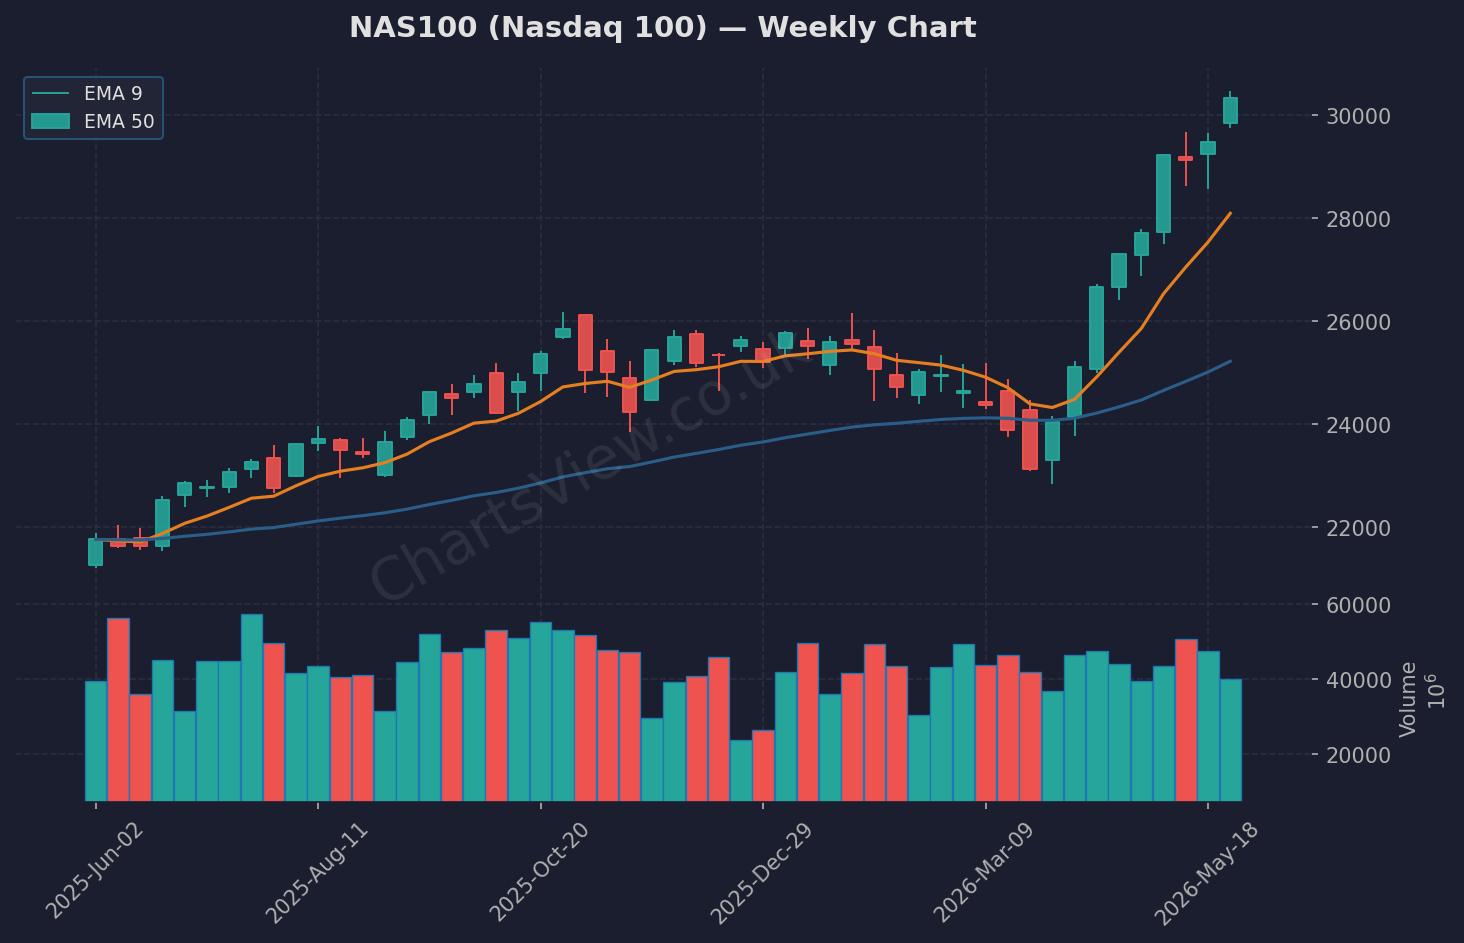
NAS100 (Nasdaq 100) Weekly Chart — EMA 9 (orange) & EMA 50 (blue) | Source: ChartsView
The Nasdaq 100 was last week's star performer, rallying +2.89% to close at 30,333 and printing a strong bullish engulfing candle. The index is now consolidating just below its 5-day high of 30,470, which represents the immediate resistance to watch. Tech continues to lead the market, with Nvidia's new Arm-based PC chip announcement and AI expansion headlines providing fundamental tailwinds. Support is well-defined at the previous close of 30,224, with stronger support at the 5-day low of 29,424.
I'm bullish on NAS100 as long as it holds above 30,200. A break above 30,470 would confirm continuation and open up a run towards 30,800. The setup is cleaner here than on US30 — tech has momentum, institutional flows are positive, and the weekly candle structure is textbook bullish. Invalidation comes on a break below 30,200, which would shift the bias to neutral and bring 29,800 into play. This week, I'm watching for a retest of 30,200-30,250 to provide a low-risk entry for longs targeting the breakout above 30,470.
Quick Takes
S&P 500: Closed at 7,580 (+1.43% for the week) and holding above 7,563 support — bullish above this level with 7,599 resistance in focus.
FTSE 100: Weak close at 10,409 (-0.54%) with resistance at 10,557 capping upside — needs to reclaim 10,450 to stabilise, otherwise 10,381 support is at risk.
Gold: Consolidating at $4,551 after a +2.35% weekly gain — holding the $4,560 level is key; a break below opens $4,363, whilst a push above $4,591 targets $4,650.
WTI Oil: Spiked +2.64% to $89.67 on Middle East tensions — watching whether it can hold above $87.36 or if we see a fade back towards $86.35 support.
Key Events This Week
- Monday 14:00 GMT — US ISM Manufacturing PMI (May): Forecast 52.6 vs 52.7 prior. This is the week's biggest risk event — a beat could fuel further upside in US indices, whilst a miss below 52.0 may trigger profit-taking from record highs.
- Monday 06:00 GMT — UK Nationwide Housing Prices (May): MoM forecast -0.1% vs +0.4% prior. A weaker print could weigh on Sterling and the FTSE, particularly if it signals broader consumer weakness.
- Monday 09:00 GMT — Eurozone Unemployment Rate (April): Expected to hold at 6.2%. Stability here supports the EUR, but any uptick could pressure European equities.
- Monday 06:00 GMT — Germany Retail Sales (April): MoM forecast -0.4% vs -2.0% prior. Germany's consumer data remains weak — another negative print reinforces concerns about European growth.
The Week Ahead — My Game Plan
This week, I'm leaning bullish on US indices as long as they hold above last week's breakout levels — 50,650 on US30 and 30,200 on NAS100. The setup favours continuation, but we're at levels where profit-taking is a real risk, especially if Monday's ISM data disappoints. I'm watching for a pullback to support zones early in the week to provide cleaner entries rather than chasing at these highs. If we get a strong ISM print and US30 clears 51,100, I'll be looking to add to longs with tight stops. As always, manage your risk — these are extended levels, and a reversal candle at resistance could come fast. Trade what you see, not what you think, and let the market prove the breakout before committing size.
Written by Remo, founder of ChartsView. This outlook reflects personal analysis and does not constitute financial advice. Always do your own research and manage your risk.