Alphabet has gapped clear of the Feb–March range on results and printed a fresh all-time high at 386.76. Trend, momentum and volume confirm the breakout, but RSI at 82.54 leaves the chart vulnerable on the first failed test of gap support at 349.29.
Daily Chart
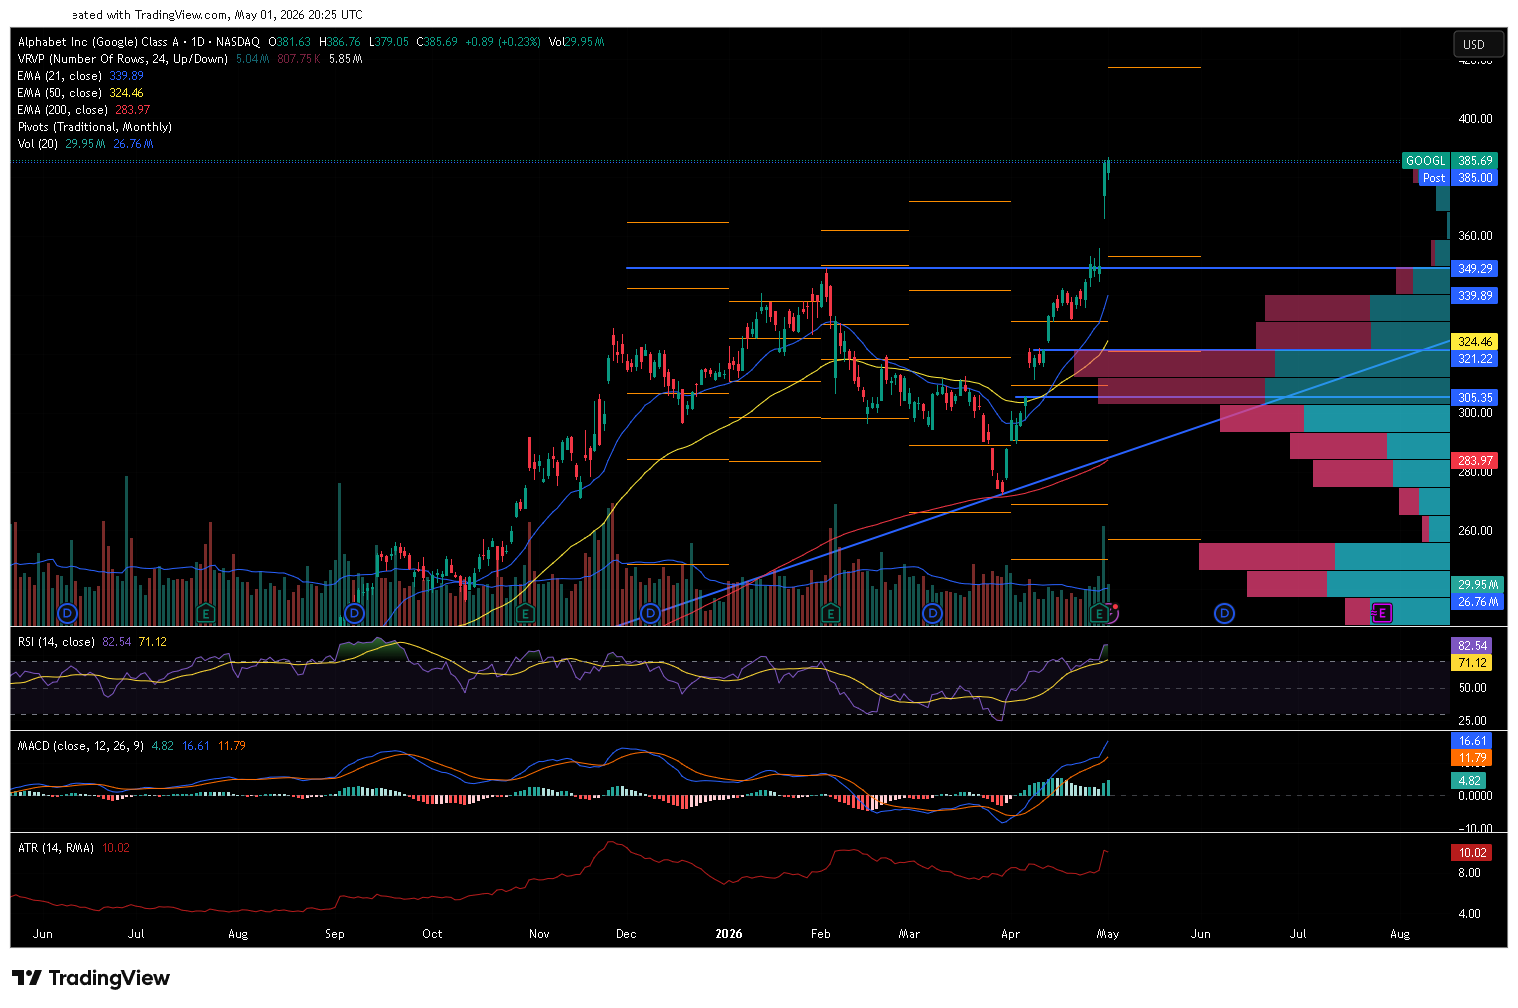
GOOGL daily chart, 1 May 2026 — 21/50/200 EMA, RSI(14), MACD(12,26,9), ATR(14), Volume with 20-day MA, Monthly Pivot Points, Fibonacci retracement, and Visible Range Volume Profile. Yesterday's earnings gap from 349.94 to 384.80 cleared the prior swing high; today's 29.95M shares confirms continuation, though the 1.414 extension at 384.84 sits exactly where price stalled.
Trend and Structure
The trend is unambiguous. Price sits 36% above the 200 EMA at 283.97, 18.9% above the 50 EMA at 324.46, and 13.5% above the 21 EMA at 339.89, with all three stacked bullishly. The April 30 earnings gap printed a textbook break of structure, clearing both the February swing high near 360 and the prior consolidation top at 349.29 in a single session. The longer-term rising trendline anchored at the late-2025 base remains intact and now sits well below the action.
Key Levels
The level that matters today is 349.29 — yesterday's gap support and the prior breakout zone. Holding above it keeps the breakout valid; a return through it is your warning the move was a one-day spike. The 1.414 fib extension at 384.84 explains today's stall almost to the cent.
| Type | Level | Why it matters |
|---|---|---|
| Fib 1.618 ext | 397.08 | Next upside target into the 400 round number |
| Resistance | 386.76 | Today's high — first hurdle for continuation |
| Fib 1.414 ext | 384.84 | Gap-day extension — explains today's pause |
| Current | 385.69 | Last close |
| Support | 384.80 | Yesterday's close — first hold-or-fail level |
| Support | 349.29 | Gap support and prior breakout — invalidation if lost |
| Support | 339.89 | 21 EMA — first dynamic support |
| Support | 324.46 | 50 EMA — deeper retracement level |
Fibonacci is anchored to the February swing high near 360 and the March swing low near 300. The 1.414 extension at 384.84 sits at confluence with today's intraday low at 379.05 and explains the day's narrow range; the 1.618 at 397.08 lines up with 400 as the next magnet. A retrace of yesterday's gap to its 0.618 at 363.75 would still leave the trend intact.
Momentum and Volume
RSI(14) at 82.54 is deep into overbought territory, with the RSI-based MA at 71.12 confirming momentum but flagging the stretched condition. MACD remains bullish — line at 16.61 above signal at 11.79, histogram still expanding at 4.82 — and the zero-line position has been positive since early April. ATR(14) at 10.02 is elevated by the gap session; pre-gap it sat near 7.9. Today's 29.95M shares ran 11.9% above the 20-day average of 26.76M, and yesterday's 72.04M was 269% above average — the move came on real participation, not drift. The visible-range volume profile shows the heaviest historical activity sitting in the 305–340 zone, leaving the current spot in low-volume air with little overhead supply until 397–400.
Bull Case
A daily close above today's high at 386.76 with another above-average volume session opens the path to the 1.618 extension at 397.08 and the 400 round number. As long as 349.29 holds, the breakout structure remains valid, and any pullback into the 372–375 partial-gap-fill zone becomes a high-probability dip-buy area for trend-followers.
Bear Case
RSI at 82.54 with the 1.414 extension acting as a ceiling sets up the textbook overbought pullback. A daily close back below 384.80 invites a partial gap fill toward 372, and a loss of 349.29 turns the earnings move into a failed breakout — the kind that traps late longs and accelerates downside toward the 21 EMA at 339.89 and ultimately the 50 EMA at 324.46.
Trade Scenarios
| Direction | Trigger | Stop | Target |
|---|---|---|---|
| Long | Daily close above 386.76 | 369.70 (1.7× ATR below trigger) | 397.08, then 420 |
| Short | Daily close below 349.29 | 369.30 (2× ATR above trigger) | 324.46, then 305.35 |
Risk warning: Technical analysis reflects probability, not certainty. Levels are reference points, not signals. Capital at risk. This is educational content, not investment advice.