RDW has broken out of a 15-month descending channel on its strongest volume in months, clearing the trendline and pushing above all three EMAs for the first time since 2024. The next test is $14.61 — the first horizontal resistance in the path to $17–18.
Daily Chart
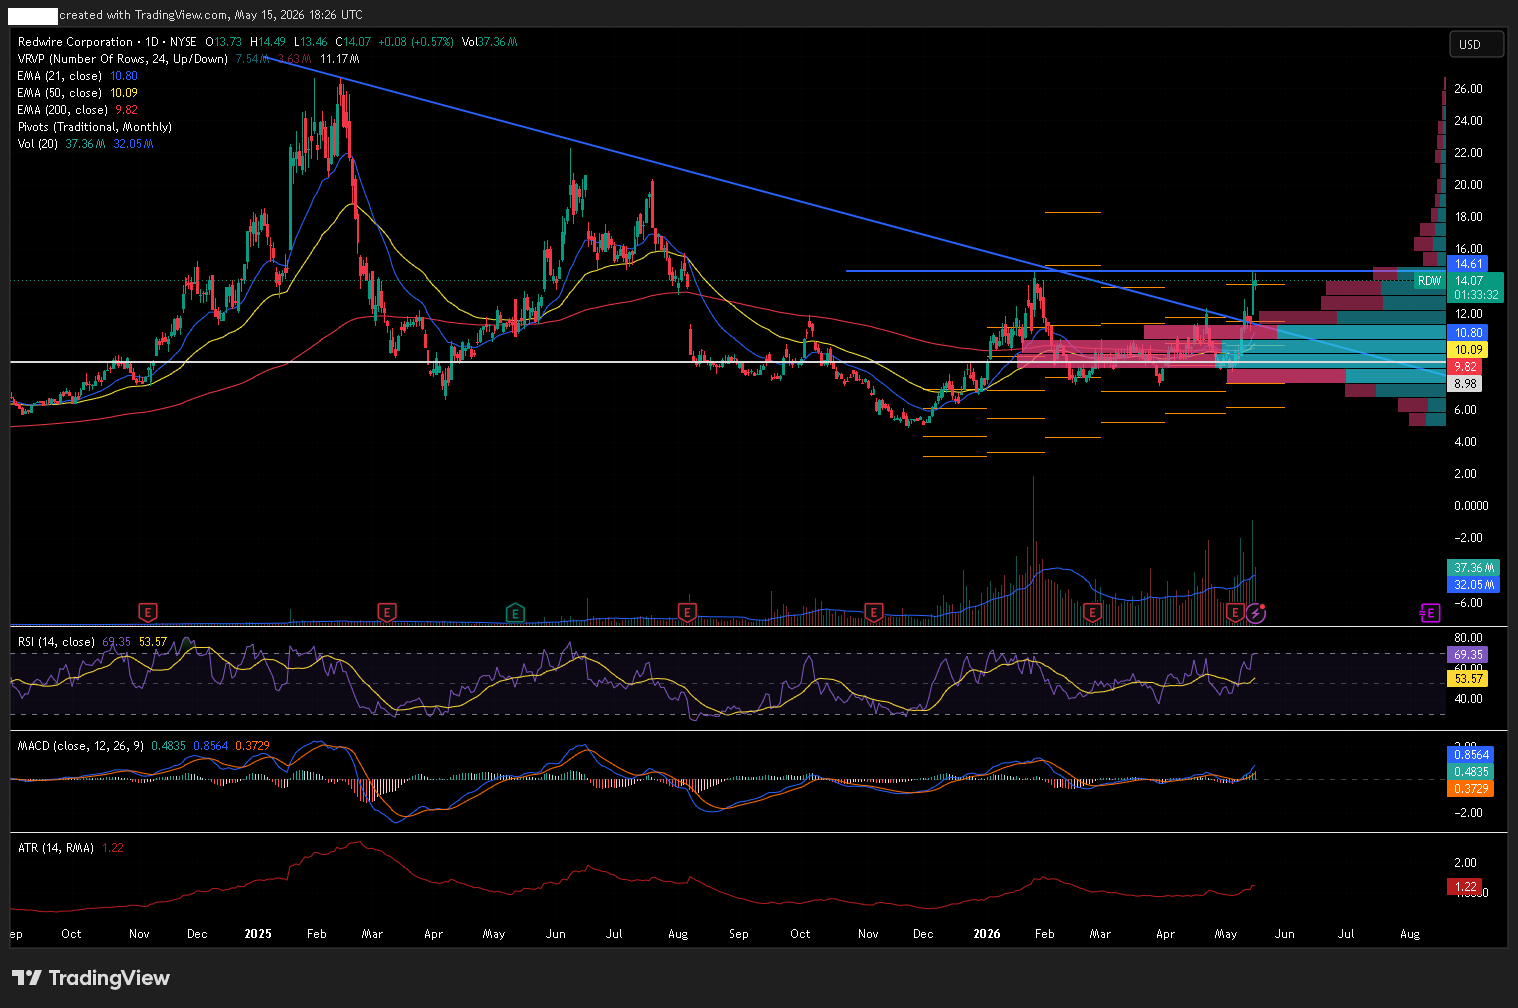
RDW daily chart, 15 May 2026 — 21/50/200 EMA, RSI(14), MACD(12,26,9), ATR(14), Volume with 20-day MA, Monthly Pivot Points, and Visible Range Volume Profile. The 15-month descending trendline from the February 2025 peak has been broken; $14.61 is now the first horizontal resistance standing between current price and the $17–18 zone.
Trend and Structure
The chart is defined by a descending trendline running from the February 2025 high near $26, which capped every rally attempt over the following year. RDW spent most of late-2025 into early 2026 base-building between $8 and $11, before an explosive surge in late April and early May drove the stock clean through that trendline and above $14. The trendline break is confirmed — not a test of it. Price is now above EMA21 (10.80), EMA50 (10.09), and EMA200 (9.82) simultaneously, a configuration last seen at the 2024 peak, and the structure of recent sessions represents a genuine change of character after a sustained sequence of lower highs. The next level to resolve is $14.61, a prior horizontal swing high that is entirely separate from the trendline and now the first meaningful ceiling above current price.
Key Levels
The $14.61 level is the first significant horizontal resistance now that the descending trendline has been broken — a clean prior swing high sitting directly in the path of the current move. Below it, the VRVP's point of control near $9.82 aligns with EMA200, making that zone the structural floor underpinning the whole move.
| Type | Level | Why it matters |
|---|---|---|
| Resistance | $18.00 | Prior swing high from the August 2025 recovery attempt — next meaningful ceiling above $14.61 |
| Resistance | $14.61 | Prior swing high resistance — first meaningful horizontal ceiling above current price following the confirmed trendline break |
| Current | $14.07 | Last close (chart legend, 18:26 UTC); CSV export captured $14.03 mid-session — intrabar timing difference, benign |
| Support | $12.00 | Round number and base of the breakout thrust — a close below here questions the validity of the move |
| EMA 21 | $10.80 | Short-term dynamic support; price is ~30% above it, first target on any deeper pullback |
| EMA 50 | $10.09 | Medium-term trend MA, confluent with the upper edge of the VRVP's high-volume node |
| Volume POC | $9.82 | EMA200 and VRVP point of control in tight confluence — the structural floor of the new trend |
| Support | $8.98 | Pre-breakout consolidation floor and ultimate invalidation level for the bull thesis |
No clean Fibonacci extension is in play yet — the breakout is still young and the relevant swing anchor has not fully established. Fibonacci targets will be more meaningful once the $14.61 test resolves in either direction.
Momentum and Volume
RSI(14) sits at 69.35, approaching the overbought threshold without yet piercing it — the RSI-based MA at 53.57 confirms the surge is genuine momentum rather than a single-session spike. MACD (0.8564) is well above its signal line (0.3729) with the histogram at 0.4835, expanding from the prior session's 0.4060, so momentum is still accelerating rather than fading. ATR(14) has risen to 1.22, reflecting the increased daily range of the breakout phase — stops and targets should be sized to that range, not pre-breakout values. Volume today is 37.36M versus the 20-day average of 32.05M, running approximately 16.6% above the norm — consistent buying pressure rather than a climactic blow-off, which is the better kind of confirmation. The VRVP on the right side of the chart shows heavy historical volume concentrated in the $9–11 zone where the stock spent months consolidating; above $13, the profile thins markedly, meaning price has moved into lower-resistance air where moves tend to be faster and both continuation and reversal can accelerate.
Bull Case
The trendline break is already done — that battle is won. A daily close above $14.61 on firm volume extends the move through the first horizontal ceiling and opens the path to $17–18. The thin VRVP above $13 offers limited historical supply, so the move could accelerate once $14.61 gives. The bull case stays intact as long as price holds above $12.00 on any pullback — that is the line a buyer should not want to see broken on a closing basis.
Bear Case
Even with the trendline broken, $14.61 is a clean horizontal prior high that can cap the move. A rejection there — particularly a shooting star or bearish engulfing candle on volume without a close above — would set up a reversion to $12.00 or the EMA21 at $10.80. The stock has moved from $9 to $14 in weeks with RSI nudging 70; a mean-reversion pullback from this level would be entirely normal and would not negate the trendline break.
Trade Scenarios
| Direction | Trigger | Stop | Target |
|---|---|---|---|
| Long | Daily close above $14.61 | $12.17 (2× ATR below trigger) | $17.50–$18.00 |
| Short (fade) | Bearish reversal candle at $14.61, no close above | $16.44 (1.5× ATR above entry) | $12.00 |
Risk warning: Technical analysis reflects probability, not certainty. Leve