- Posts: 898
- Thank you received: 2318
XEL
13 years 5 months ago #2926
by Jackozy
Yes, I agree with that hence I'm waiting. There has to be a higher low at some point and that will set up the 123-low. It's just a question of at what price it will occur.
Please Log in or Create an account to join the conversation.
13 years 5 months ago #2922
by remo
Id wait for the retrace before jumping in.
The retrace may set up the 123 low formation required for a possible low forming.
id target the 97 area for longs with stops below 90 if you were to pre-empt the 123 low.Bit risky
That area will be the 50%fib retrace from the low to the current high. This all presumes the current high is the high so bear that in mind.If xel goes higher then you would have to re-adjust the fibs to incorporate this.

dyor
The retrace may set up the 123 low formation required for a possible low forming.
id target the 97 area for longs with stops below 90 if you were to pre-empt the 123 low.Bit risky
That area will be the 50%fib retrace from the low to the current high. This all presumes the current high is the high so bear that in mind.If xel goes higher then you would have to re-adjust the fibs to incorporate this.
dyor
The following user(s) said Thank You: Elena Saratov, annes goal, CT79, Wreckless Eric, Patient Penguin, buffet, cautious tone
Please Log in or Create an account to join the conversation.
13 years 5 months ago #2919
by Jackozy
Here's the standard daily p&f chart with 1x3 box setting based on closing prices:
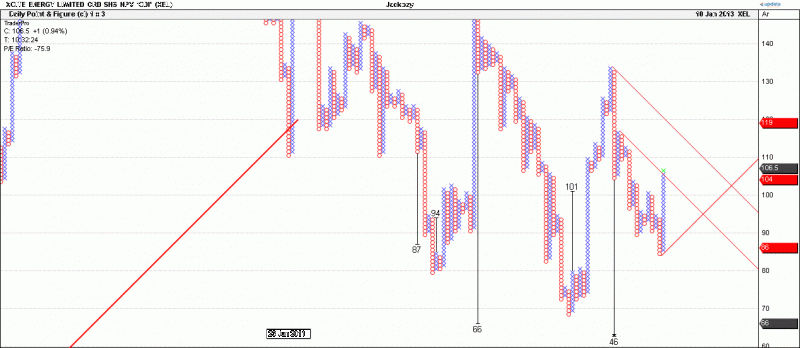
dl.dropbox.com/u/20815047/XELdailyp%26f10_01_13.gif
It's only if we use high/low prices instead of closing ones that we get an active upside target of 116p:
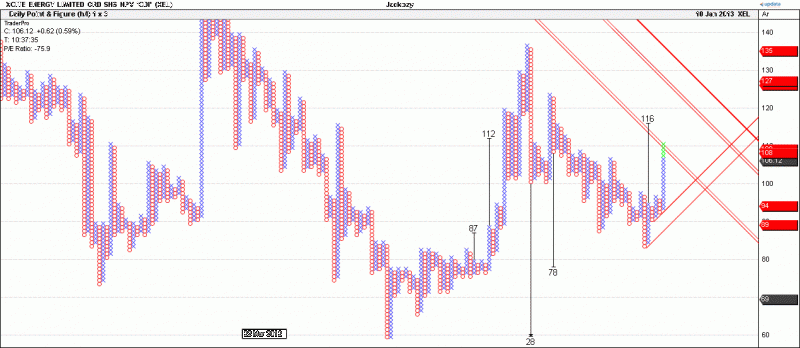
dl.dropbox.com/u/20815047/XELdailyp%26fhl10_01_13.gif
The daily closing prices p&f chart has a (met) target of 105.25 but only when we use a 0.25 x 3 box size.
As you can see, we have to manipulate the p&f settings to get what we want to see. A few days of consolidation like a bull flag would soon generate some targets though.
Hope that helps more than my previous answer!")
dl.dropbox.com/u/20815047/XELdailyp%26f10_01_13.gif
It's only if we use high/low prices instead of closing ones that we get an active upside target of 116p:
dl.dropbox.com/u/20815047/XELdailyp%26fhl10_01_13.gif
The daily closing prices p&f chart has a (met) target of 105.25 but only when we use a 0.25 x 3 box size.
As you can see, we have to manipulate the p&f settings to get what we want to see. A few days of consolidation like a bull flag would soon generate some targets though.
Hope that helps more than my previous answer!
Please Log in or Create an account to join the conversation.
13 years 5 months ago #2911
by Jackozy
I agree that the close looked strong but, rather strangely, there are no upside targets on the main P&F charts. I can get some but I have to use unusual box sizes to generate them. I suspect that this is because there hasn't been a correction since the 83p low - you need a correction in order to trigger the upside target from the previous rise for P&F.
Please Log in or Create an account to join the conversation.
- waverider2
-

- Offline
- Junior Boarder
-

Less
More
- Posts: 262
- Thank you received: 202
13 years 5 months ago #2898
by waverider2
Replied by waverider2 on topic XEL
Has anyone got any P&F targets? The momentum looks really strong especially looking at the close today. Tomorrow's opening could potentially be orgasmic lol
The following user(s) said Thank You: Elena Saratov
Please Log in or Create an account to join the conversation.

13 years 5 months ago #2893
by AdeMcG
thanks for the chart Jackozy, I nearly bought the spike again and added...but remembered the 106p from last time....I went for a walk...glad I did.
I want one final chunk in the ISA to average down then leave it until take over or production, I look forward to the 400p days again !!
I want one final chunk in the ISA to average down then leave it until take over or production, I look forward to the 400p days again !!
Please Log in or Create an account to join the conversation.
Moderators: remo
Time to create page: 0.094 seconds