ChartsView - Stock Trading Community

One of the UK's Longest Running Stock Trading Communities

Join thousands of traders discussing FTSE 100, shares, and market strategies. Free membership, live chat, weekly share tips, and trading education.

✓ Free forever   ✓ No credit card needed   ✓ Active since 2012

Resistances are the opposite of support levels. This is when buyers are out numbered by the sellers in the market.

This level is normally identified by a previous peak, this is the level that you should take profits.


Resistance comes in many forms:

• Previous reaction high

• Downtrend lines

• Gaps

• Fibs

• Moving averages

• Ichimuku cloud tops


Once a resistance is penetrated it normally becomes support, never buy at resistance. 

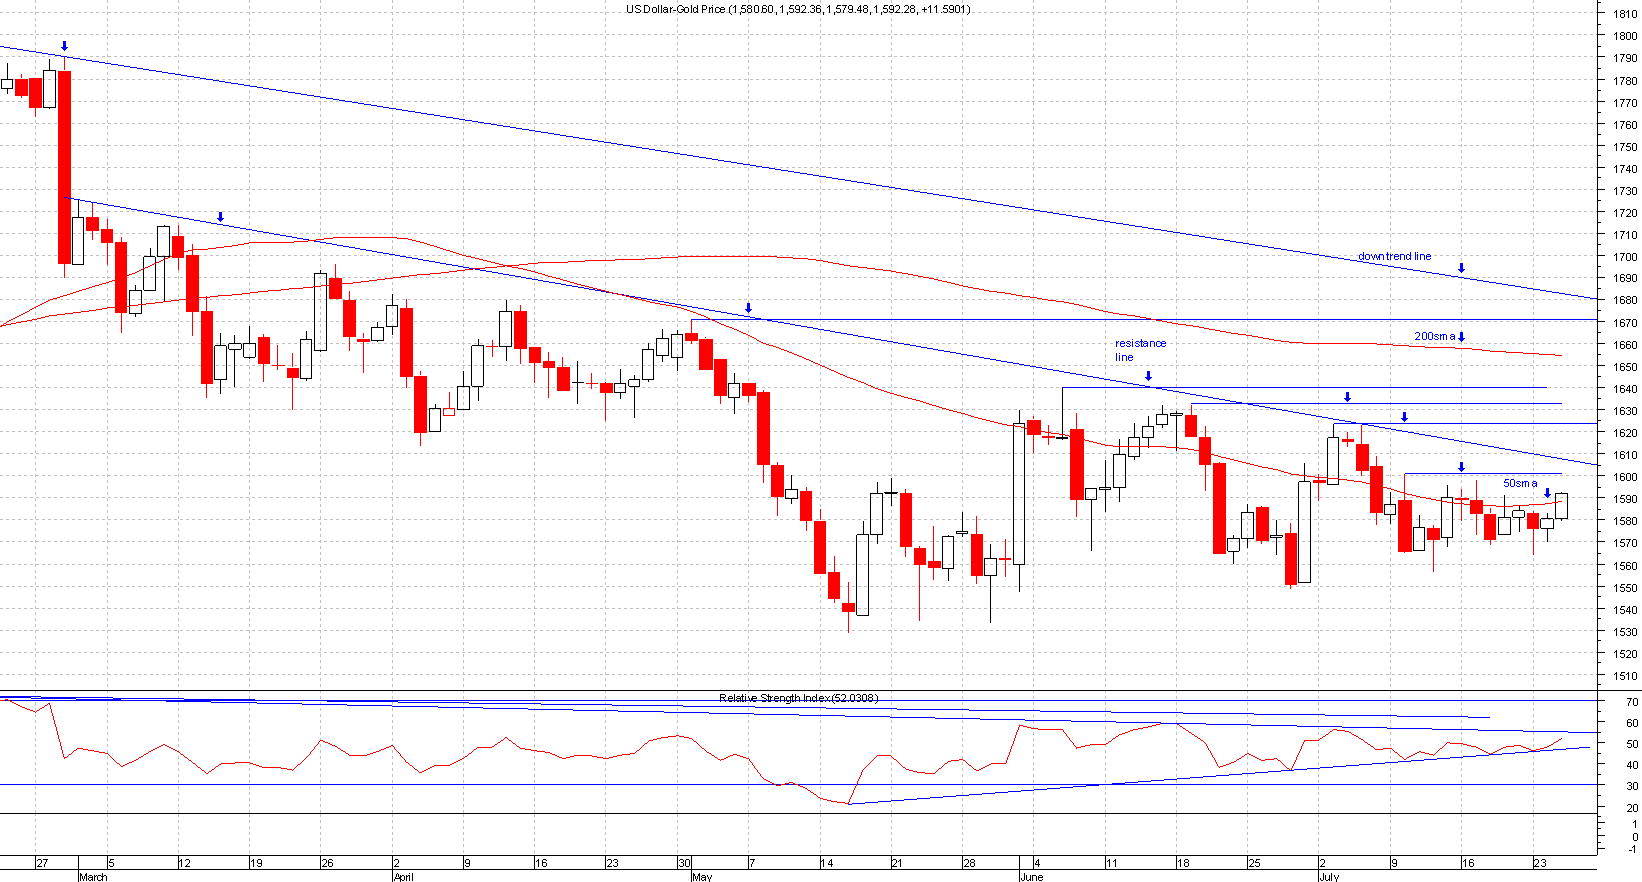
If you study the chart below you should be able to tell how to draw resistance, the chart below shows examples of resistances on gold.


Please click on chart below for larger image


resistance


Loading...
Loading...

Latest Forum Topics

remo
Compass Pathway
remo — 12 Mar 2026 14:46
remo
Blue field Solar Income: BSIF
remo — 10 Mar 2026 12:57
remo
New Website
remo — 09 Mar 2026 08:36
remo
DOW
remo — 02 Mar 2026 20:45
remo
Feed
remo — 02 Mar 2026 15:35
remo
Tips and stuff
remo — 27 Feb 2026 14:40
remo
Portfolio
remo — 27 Feb 2026 14:30
annes goal
OXB
annes goal — 19 Jan 2026 15:24
remo
NASDAQ 100
remo — 06 Jan 2026 20:49
Trendfriend
Empire Metals - EEE
Trendfriend — 03 Jan 2026 20:46

Market News

Loading...

Market Sentiment