
The price-to-earnings ratio is one of the most widely used metrics in stock investing. Whether you're browsing the FTSE 100, screening for value stocks, or trying to decide between two similar companies, the P/E ratio will almost certainly be part of your analysis. But what does it actually tell you, and how should you use it?
What Is the P/E Ratio?
The P/E ratio measures how much investors are willing to pay for each pound of a company's earnings. It's calculated by dividing the current share price by the earnings per share (EPS).
For example, if a company's shares trade at 500p and its earnings per share over the last twelve months were 25p, the P/E ratio is 20. This means investors are paying 20 times the company's annual earnings for each share.
Another way to think about it: the P/E ratio tells you how many years of current earnings it would take to "pay back" the share price — assuming earnings stay constant (which they rarely do, but it's a useful mental model).
Quick Example
Company A has a share price of 800p and EPS of 40p. Its P/E ratio is 20.
Company B has a share price of 300p and EPS of 30p. Its P/E ratio is 10.
Company B is "cheaper" relative to its earnings, but that doesn't automatically make it a better investment. The P/E ratio is a starting point for analysis, not a conclusion.
What Is a "Good" P/E Ratio?
This is the question every beginner asks, and the honest answer is: it depends. There's no universal number that separates a good P/E from a bad one. Context matters enormously.
As a rough guide, the long-term average P/E for the FTSE 100 sits somewhere between 13 and 16. So a FTSE 100 stock with a P/E of 10 might look cheap, while one at 25 might look expensive — but both could be entirely justified depending on the company's growth prospects.
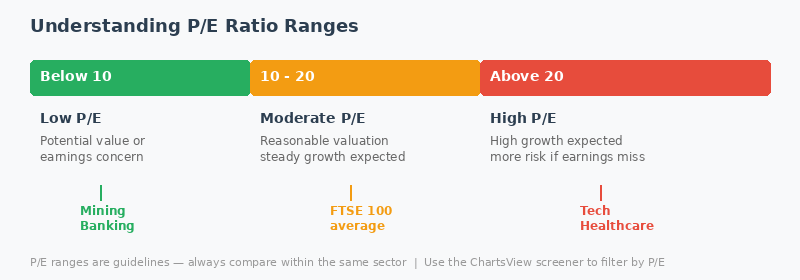
Low P/E (Below 10)
A low P/E can signal an undervalued stock — the market might be underestimating the company's future. But it can also signal that the market expects earnings to decline. Cyclical companies at the peak of their earnings cycle often have low P/E ratios because investors know the peak won't last. Always ask: why is this stock so cheap?
Moderate P/E (10 to 20)
Most established UK companies trade in this range. A P/E of 10-20 typically reflects reasonable market expectations — steady but not spectacular growth. This is where you'll find many solid dividend payers and blue-chip stocks.
High P/E (Above 20)
A high P/E indicates the market expects strong future earnings growth. Technology companies and high-growth businesses often command P/E ratios of 25, 30, or even higher. The risk is that if growth disappoints, the share price can fall sharply as the high P/E contracts. The higher the P/E, the more optimism is "priced in."
P/E Ratios by Sector
Different sectors naturally trade at different P/E levels. Comparing a technology company's P/E to a utility company's P/E is like comparing apples and oranges. Always compare a stock's P/E to its sector average rather than the market as a whole.
| Sector | Typical P/E Range | Why |
|---|---|---|
| Technology | 20 - 40+ | High growth expectations |
| Healthcare | 15 - 30 | Pipeline potential, defensive |
| Consumer Goods | 15 - 25 | Brand value, stable demand |
| Financial Services | 8 - 15 | Cyclical, regulatory risk |
| Energy | 8 - 15 | Commodity price dependent |
| Utilities | 12 - 18 | Stable earnings, low growth |
| Mining | 5 - 15 | Highly cyclical |
The ChartsView screener lets you filter by P/E ratio within specific sectors, making it easy to find stocks that are relatively cheap compared to their peers rather than the market as a whole.
Trailing P/E vs Forward P/E
There are two versions of the P/E ratio, and understanding the difference is important.
Trailing P/E
The trailing P/E uses actual earnings from the past twelve months. It's based on real numbers and is therefore more reliable — but it looks backwards. If a company's earnings are about to change dramatically (up or down), the trailing P/E might give a misleading picture.
Forward P/E
The forward P/E uses forecast earnings for the next twelve months. It reflects what analysts expect to happen, which is arguably more relevant for investment decisions. The catch is that forecasts can be wrong — sometimes very wrong.
Most experienced investors look at both. If the forward P/E is significantly lower than the trailing P/E, it means analysts expect earnings to grow. If it's higher, they expect earnings to decline. The gap between the two tells you about market expectations for the company's future.
Which P/E Should You Use?
For a quick screening exercise, trailing P/E is fine — it's consistent and based on real data. When you're doing deeper analysis on a specific stock, look at the forward P/E as well to understand what the market is expecting. Use the ChartsView comparison tool to evaluate both metrics side by side across multiple companies.
Common P/E Mistakes to Avoid
Assuming Low P/E Always Means Good Value
A low P/E can be a value trap. If a company's earnings are about to collapse — because of structural industry changes, losing a major contract, or facing regulatory action — the P/E will look artificially low right before the bad news hits. Check the fundamentals behind the number. Use the daily briefing and community feed to stay informed about developments that might explain a stock's valuation.
Comparing P/E Across Sectors
As we covered above, different sectors have different normal P/E ranges. A mining stock with a P/E of 15 might be expensive, while a tech stock with the same P/E might be cheap. Always compare within the same sector.
Ignoring Negative P/E
If a company is making a loss, it technically has a negative P/E ratio — but this is usually not displayed. Many AIM stocks and growth companies are loss-making in their early years. For these companies, the P/E ratio is simply not a useful metric. Look at revenue growth, cash burn rate, and path to profitability instead.
Using P/E in Isolation
The P/E ratio is one tool among many. A complete valuation analysis considers price-to-book, price-to-sales, dividend yield, debt levels, cash flow, and growth rates. Use P/E as a quick filter to narrow your search via the screener, then investigate further using other metrics and the comparison tool.
Using P/E in Your Investment Process
Here's a practical workflow for incorporating P/E analysis into your investment research:
Start with the ChartsView screener and filter by P/E ratio to find stocks in your target range — perhaps a P/E between 8 and 15 for value investing, or 15-25 for growth at a reasonable price. Add a sector filter to keep comparisons relevant. Review the shortlist and use the comparison tool to evaluate candidates side by side. For each promising stock, check the stock page for chart trends and the daily briefing for recent news.
Remember that the P/E ratio tells you what the market thinks about a company's future. Your job as an investor is to decide whether the market is right, too optimistic, or too pessimistic. That's where the real opportunity lies.
Screen by P/E Ratio Today
Use the ChartsView screener to find UK stocks at valuations that match your investment strategy. Filter by P/E ratio, sector, dividend yield and more — completely free.
Try the Screener