We’ve just shipped the biggest upgrade to ChartsView in years — a completely rebuilt portfolio tracker that goes far beyond a simple “list of stocks and a P&L number.” If you’re already a member, log in and head to chartsview.co.uk/portfolio to see it. If you’re new here, this post is a tour of what the tool does, why we built it, and how to get the most out of it.
The short version: we set out to build the portfolio dashboard that we wanted to use every morning before the open. Live prices from professional-grade sources, real fundamentals, news from multiple feeds, a proper transaction ledger, a snapshot history, an embedded TradingView chart for every holding, and — yes — a Claude AI research layer that gives you a structured analyst-style take on your stocks. All under one URL, all tied to your ChartsView login, all private to you.
Let’s walk through it.
Why we rebuilt it
The old portfolio page was useful but limited. It told you how much a holding was worth and roughly how much it had moved. That’s it. There was no chart, no news, no research notes, no transaction history, and certainly nothing that resembled investment analysis. If you wanted to look at your holdings and think about them properly, you had to flick between five different websites.
The new build collapses all of that into one workspace. We’ve leaned on the same kind of stack a professional desk would use — TradingView for charts and fundamentals, Yahoo Finance as a fallback for the long tail of UK and international tickers, Google News for headline coverage, and the Anthropic API for the AI layer — and stitched it into a single dashboard that lives behind your member login.
The dashboard at a glance
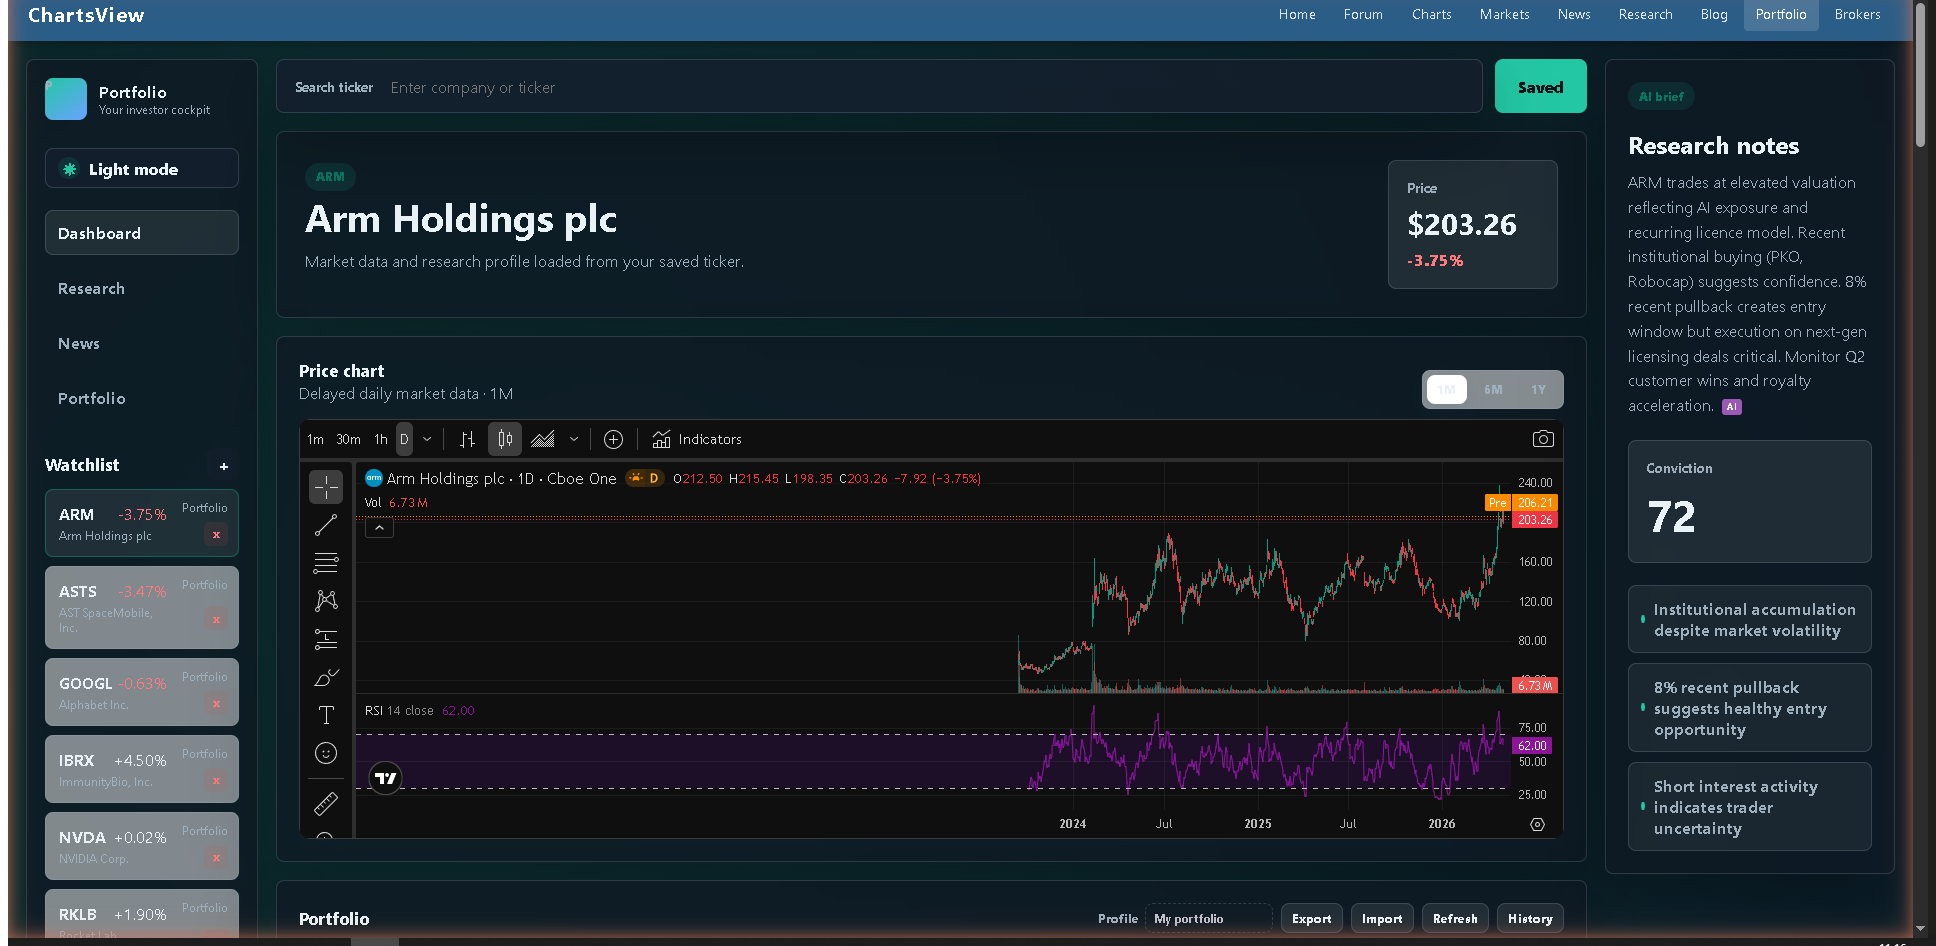 The dashboard for ARM Holdings — watchlist sidebar (live percentages updating in real time), hero panel with the active company, embedded TradingView chart, and the AI brief panel showing the research summary, conviction score and key signals.
When you open the portfolio page you get a full investor cockpit:
A left rail with quick navigation between Dashboard, Research, News and Portfolio sections, plus your watchlist. A main workspace with a hero panel showing the active company, its live price and percentage change, an embedded TradingView Advanced Chart, your full holdings table, and below that a Research panel and a Latest News panel. A right-hand insight panel with a research summary, conviction score, and bullet-point signals.
There is also a built-in light/dark mode toggle at the top of the side rail, so you can read it at 7 in the morning without burning your retinas, or switch to the bright theme when you’re working in daylight.
Live, professional-grade market data
Every price you see on the page is live, not delayed CSV scraping. The system pulls quotes primarily through TradingView’s scanner — the same data infrastructure that powers TradingView’s web charts — and falls back to Yahoo Finance for tickers that need it (which is particularly useful for UK names where some ETFs and smaller LSE-listed stocks aren’t in the primary feed).
You can pick the data source manually if you want — Auto, TradingView, or Yahoo Delayed — using the dropdown at the top of the portfolio panel. For most members, Auto is the right answer: it uses TradingView when it can and falls back gracefully when it can’t.
UK stocks are handled correctly throughout. Pence-denominated quotes (the way LSE prices most stocks) are converted to pounds where it matters, and we display values in GBP across your portfolio total even when individual holdings are priced in USD or other currencies. There’s a live FX rate endpoint behind the scenes that keeps the conversion accurate.
A proper holdings table — not just a list
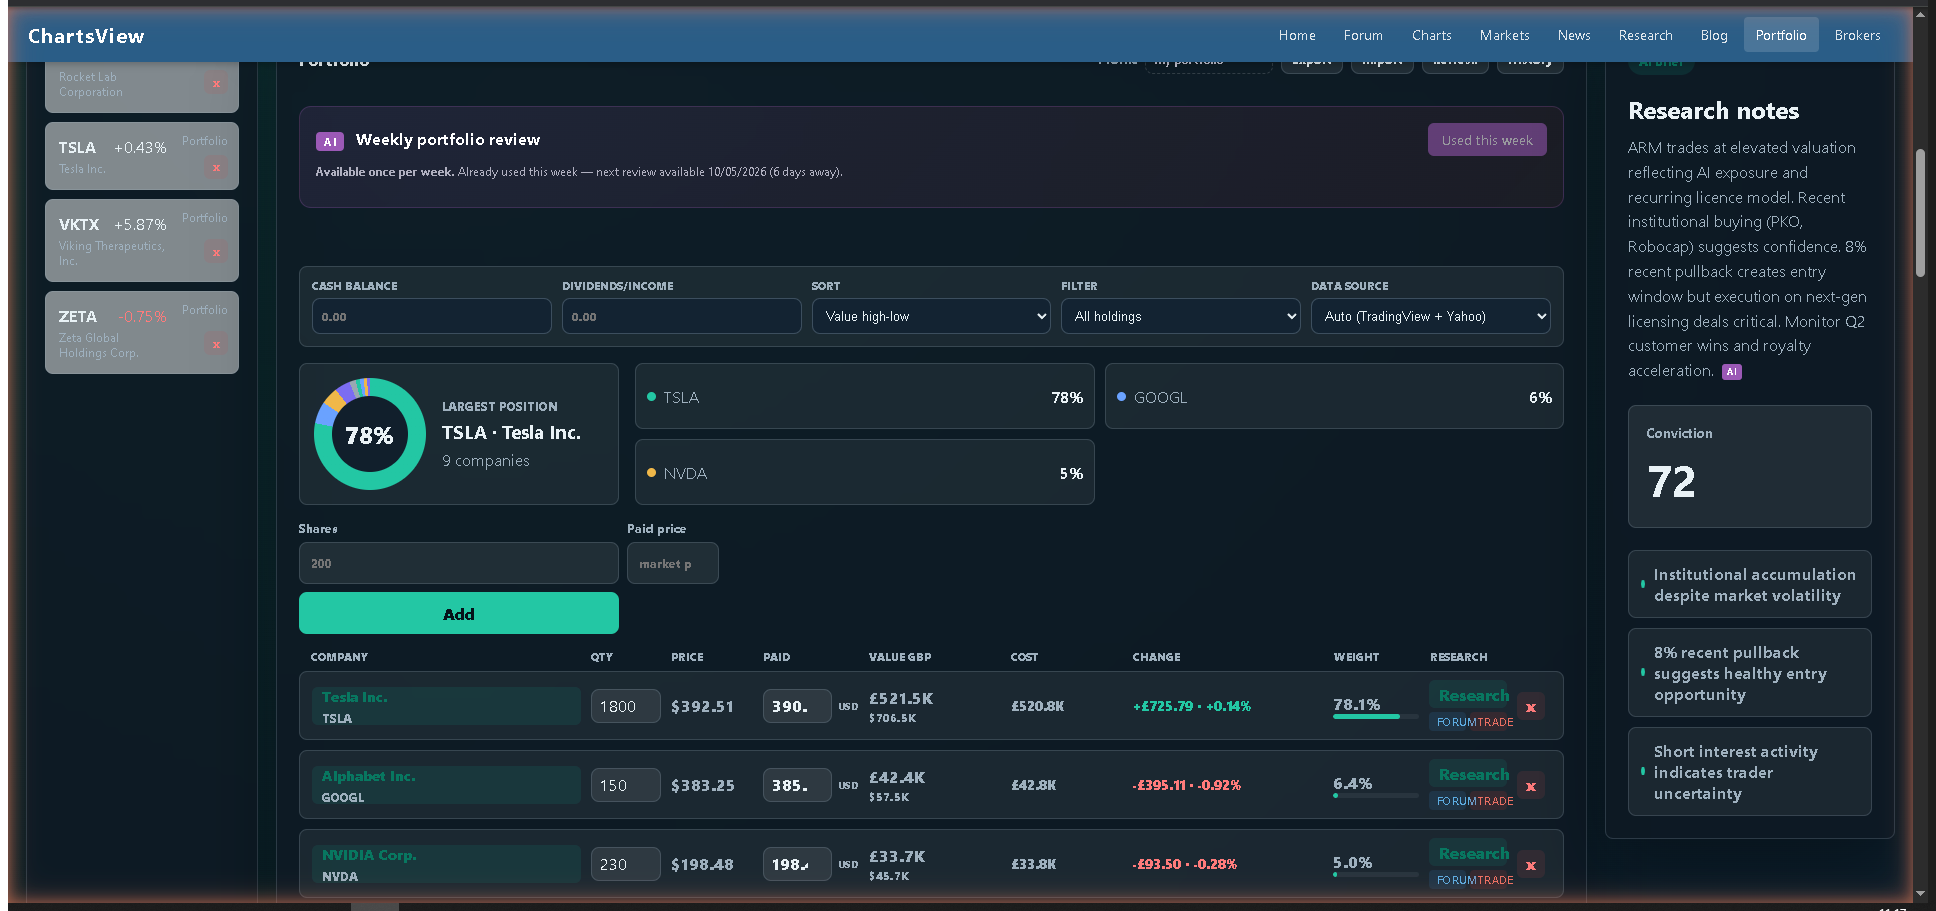 The portfolio panel header: the Weekly AI review banner (shown here in its rate-limited “used this week” state), the allocation donut highlighting your largest position, sort/filter/data-source controls, and the beginning of the holdings table.
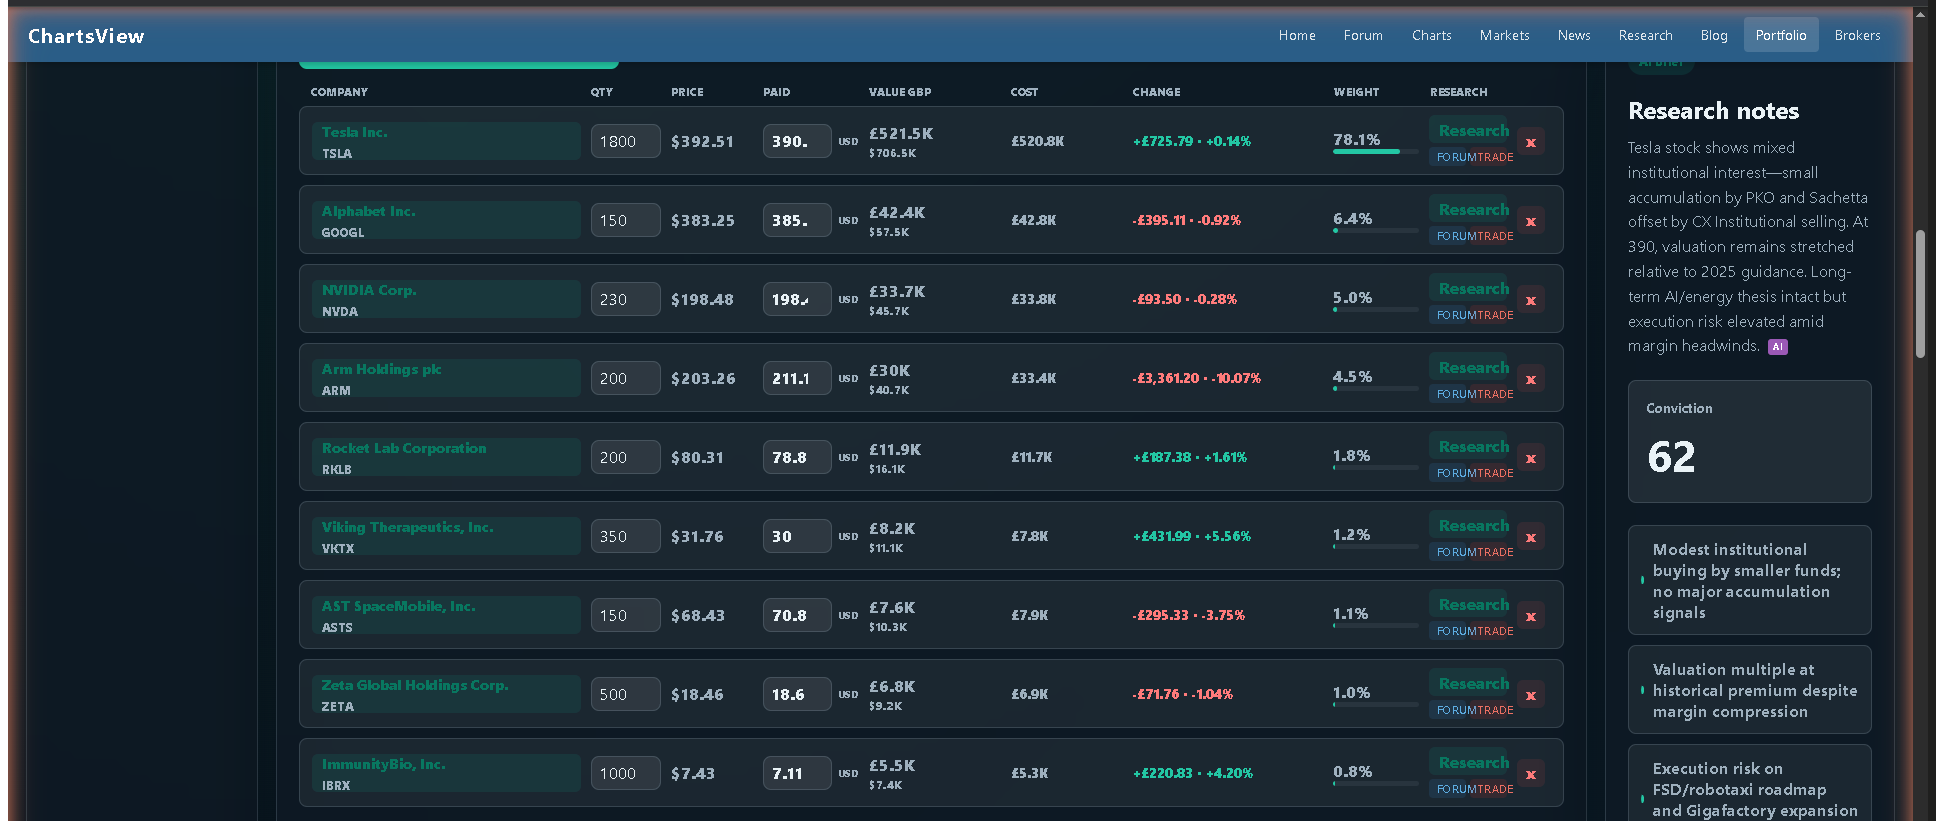 The full holdings table: every position you own on a single screen with quantity, live price, your paid price, value in GBP, cost basis, total change, weight, and a per-row Research button (plus a Forum link and Trade affiliate that aren’t shown above the fold here).
The holdings table shows everything you need on one row per stock:
Company name, quantity, current price, the price you actually paid, current value in GBP, total cost basis, change since you bought it, percentage weight in your portfolio, and a Research button that takes you straight to the research panel for that stock. There’s a per-row Forum link that takes you straight to the ChartsView forum search for that ticker, and a “Trade on IC Markets” affiliate link for members who want to take a position.
Above the table, you can sort by value, weight, best/worst change, cost, or alphabetically by name; and filter by all holdings, UK only, US only, winners, loss-makers, or just the high-weight positions. The donut chart on the left shows your largest position visually so you can spot concentration risk at a glance.
A portfolio risk grid sits beneath the table and surfaces summary metrics about your overall exposure — useful when you’re deciding whether to add to a winner or trim a position that’s grown too large.
Cash, dividends and a real transaction ledger
This is the bit that separates a toy tracker from something you can actually run a portfolio with.
You can record a cash balance so the portfolio total reflects what’s actually in your account, not just the equity value. You can record a separate dividends and income total. And — crucially — there’s a full transactions form where you log every Buy, Sell or Dividend with the date, quantity, paid price, fees in GBP, and an optional note.
Every transaction lands in your transaction history, and the portfolio recalculates your cost basis, P&L and weights from the underlying ledger rather than just storing a single “average paid” number. If you sell half a position, that’s recorded properly. If you receive a dividend, that’s a separate income event you can track over time.
You can also export your entire portfolio to JSON or CSV at any time, and import an existing portfolio in either format. So if you’ve been keeping a spreadsheet, you can move it across once and never touch the spreadsheet again.
TradingView charts, embedded for every holding
The chart panel on the dashboard is no longer a hand-drawn SVG line — it’s TradingView’s full Advanced Chart widget, embedded directly into the page, with all the same indicators, drawing tools and timeframes you’d get on TradingView itself. Click any holding and the chart re-renders for that ticker. Toggle dark mode and the chart re-themes too.
For UK stocks, we map the symbol to the right TradingView prefix (LSE, AIM, etc.) automatically so the chart actually loads. If TradingView happens to be blocked on a particular network the panel falls back gracefully with a message rather than breaking the whole page.
Real fundamentals, not made-up numbers
Every company opens to a metrics row showing Revenue (TTM), EPS (TTM), P/E (TTM) and Market cap, all pulled live from TradingView’s fundamentals feed and currency-aware. So when you open BAE Systems you see GBP revenue and GBP EPS; when you open Nvidia you see USD. Numbers are formatted compactly ($1.5T, £94.8B, £42.3M) so the row stays readable.
These aren’t placeholders. If TradingView updates the TTM revenue number tomorrow morning, the next time you open the portfolio it will be reflected.
News from multiple sources, deduped
The Latest News panel pulls from Google News and Yahoo Finance in parallel for the active ticker, normalises titles, attributes the publisher (BBC, Reuters, Bloomberg, FT, etc.), and shows the most recent headlines first. Click any headline to read the full article in a new tab.
Because we hit two feeds and merge them, you see coverage that a single-source tracker would miss — particularly for UK stocks, where Yahoo’s UK feed picks up names that Google News sometimes underweights.
Thesis tracker — write down why you bought it
This is the feature that quietly does more for your investment results than any chart. Beneath the Research panel there’s a Thesis tracker where, per company, you can write:
- Why I own or watch it
- What would make me sell
- Status (Owned, Watching, Waiting for price, Waiting for catalyst, Rejected)
- Next review date
Saving a thesis is a one-click affair, and it’s stored privately to your member account. Six months later when the stock has doubled or halved, you can come back and see what you actually thought at the time — which is the single best discipline an active investor can have. No more “I don’t really remember why I bought this.”
 The transactions form (Buy / Sell / Dividend) and the thesis tracker — saved per company, with a status and a next-review date.
The AI research layer (use it wisely)
This is the bit everyone wants to know about, so let’s be specific.
When you click the “Analyse my portfolio” button at the top of the portfolio section, the system sends every holding in your portfolio to Claude Haiku 4.5 (Anthropic’s fast research model) along with the latest live price, the latest news headlines, and basic context about the company. Claude returns a structured analyst-style take for each holding, and the results are then patched into your Research panel so the page becomes genuinely opinionated rather than generic.
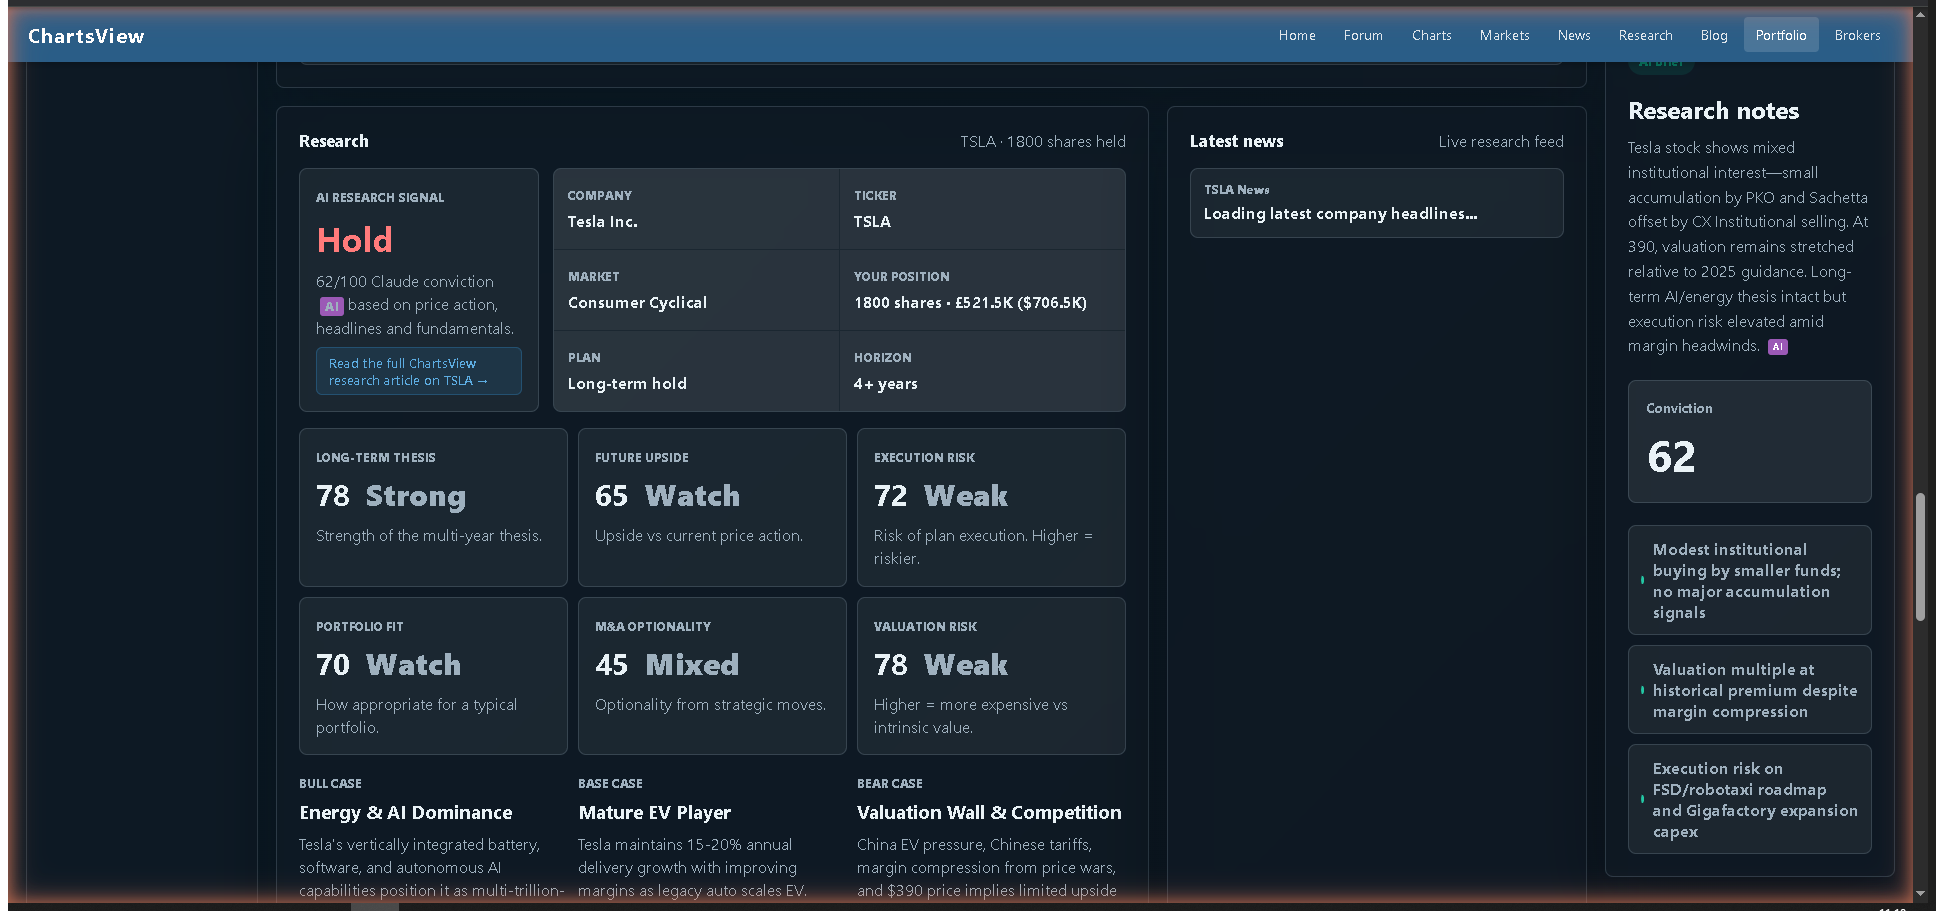 A live AI research panel — this one for Tesla. The Hold rating, conviction score, six scorecards and three structured cases are all generated by Claude Haiku 4.5 against live price action, recent headlines and the company’s fundamentals.
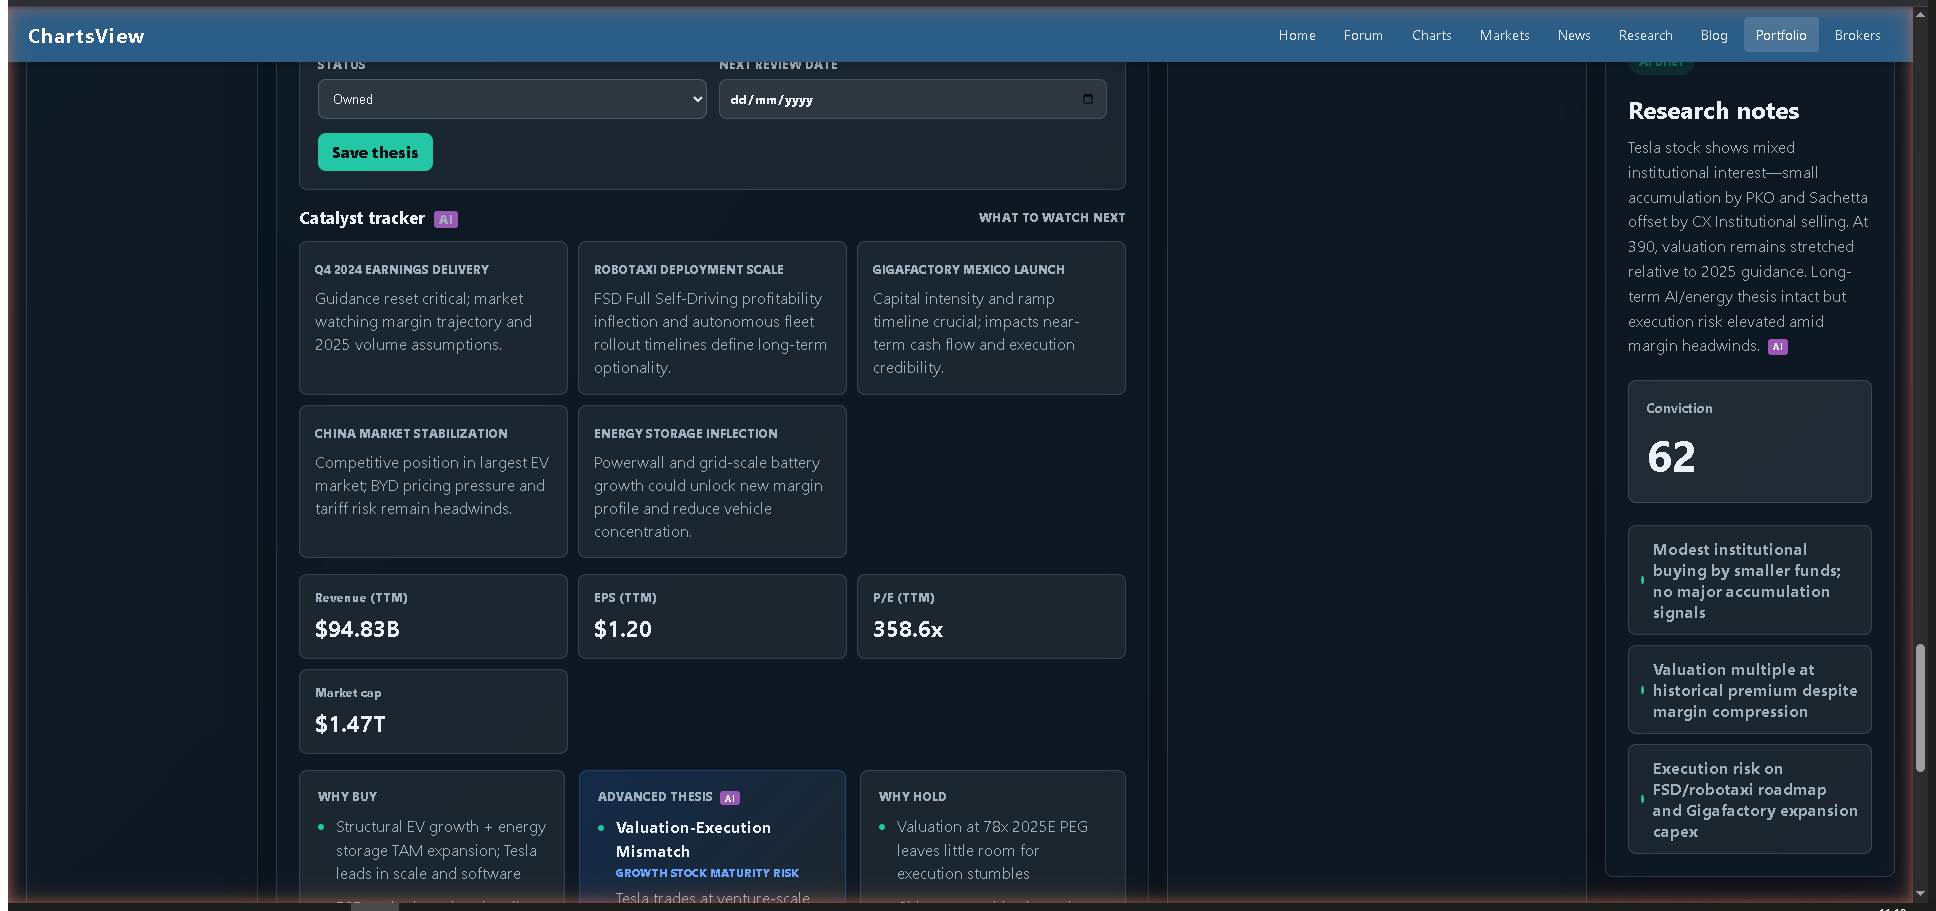 Below each AI rating sits the catalyst tracker — what to watch next for this stock — plus live TTM fundamentals (revenue, EPS, P/E, market cap), and an Advanced thesis block tagged with a risk label.
For each stock, the AI take includes:
- A Buy / Hold / Sell rating with a conviction score out of 100
- Six scorecard metrics: Long-term thesis, Future upside, Execution risk, Portfolio fit, M&A optionality, Valuation risk
- A short Bull case, Base case and Bear case
- A research summary note
- Three signals to watch
- 4–5 catalysts (earnings, product/strategy milestones, regulatory, M&A potential, sector signals)
- Why-buy and why-sell reason lists
- An advanced thesis with a labelled risk profile (e.g. “HIGH-UPSIDE PROJECT RISK”)
- “What must work”, “Risks” and “Next checks” lists
Every AI block is clearly badged as AI, and every research panel ends with a plain-English disclaimer: this is AI-generated research, not personal financial advice — use it as a starting point for your own due diligence.
Important: one full review per week, per member
The AI portfolio review is limited to once per week per member. We’ve built this deliberately. There are two reasons:
- Quality over noise. Research doesn’t change meaningfully from one day to the next. A weekly cadence forces you to actually act on what the analysis says rather than constantly re-querying it for reassurance.
- Cost. Each AI call is a paid API request to Anthropic. Running an unlimited button would mean every member could rack up large bills against the site, and we’d rather keep the feature included with membership than have to gate it behind a paywall.
The practical implication: before you click Analyse my portfolio for the week, make sure your portfolio is actually set up the way you want it. Add all your holdings, log the right quantities and paid prices, and double-check it before you trigger the review. If you click it with one stock in the portfolio you’ll get one stock’s analysis — and that’s your AI take for the week.
Per-ticker results are cached for 7 days across all members, so if another member already analysed AAPL today, your review of AAPL will use that same fresh analysis without spending another API call. Different members can still get their own personalised review of the same stocks; the underlying analysis is just shared.
Snapshots — undo for your portfolio
Every time you save a meaningful change, the system writes a snapshot of your portfolio to disk. Click the Snapshot history button and you’ll see the last 30 versions, each timestamped. If you mistakenly deleted a holding, mass-edited the wrong rows, or just want to compare your portfolio today vs a month ago, you can restore any prior snapshot with one click.
Think of it as Time Machine for your portfolio. We use it ourselves whenever we’re testing changes.
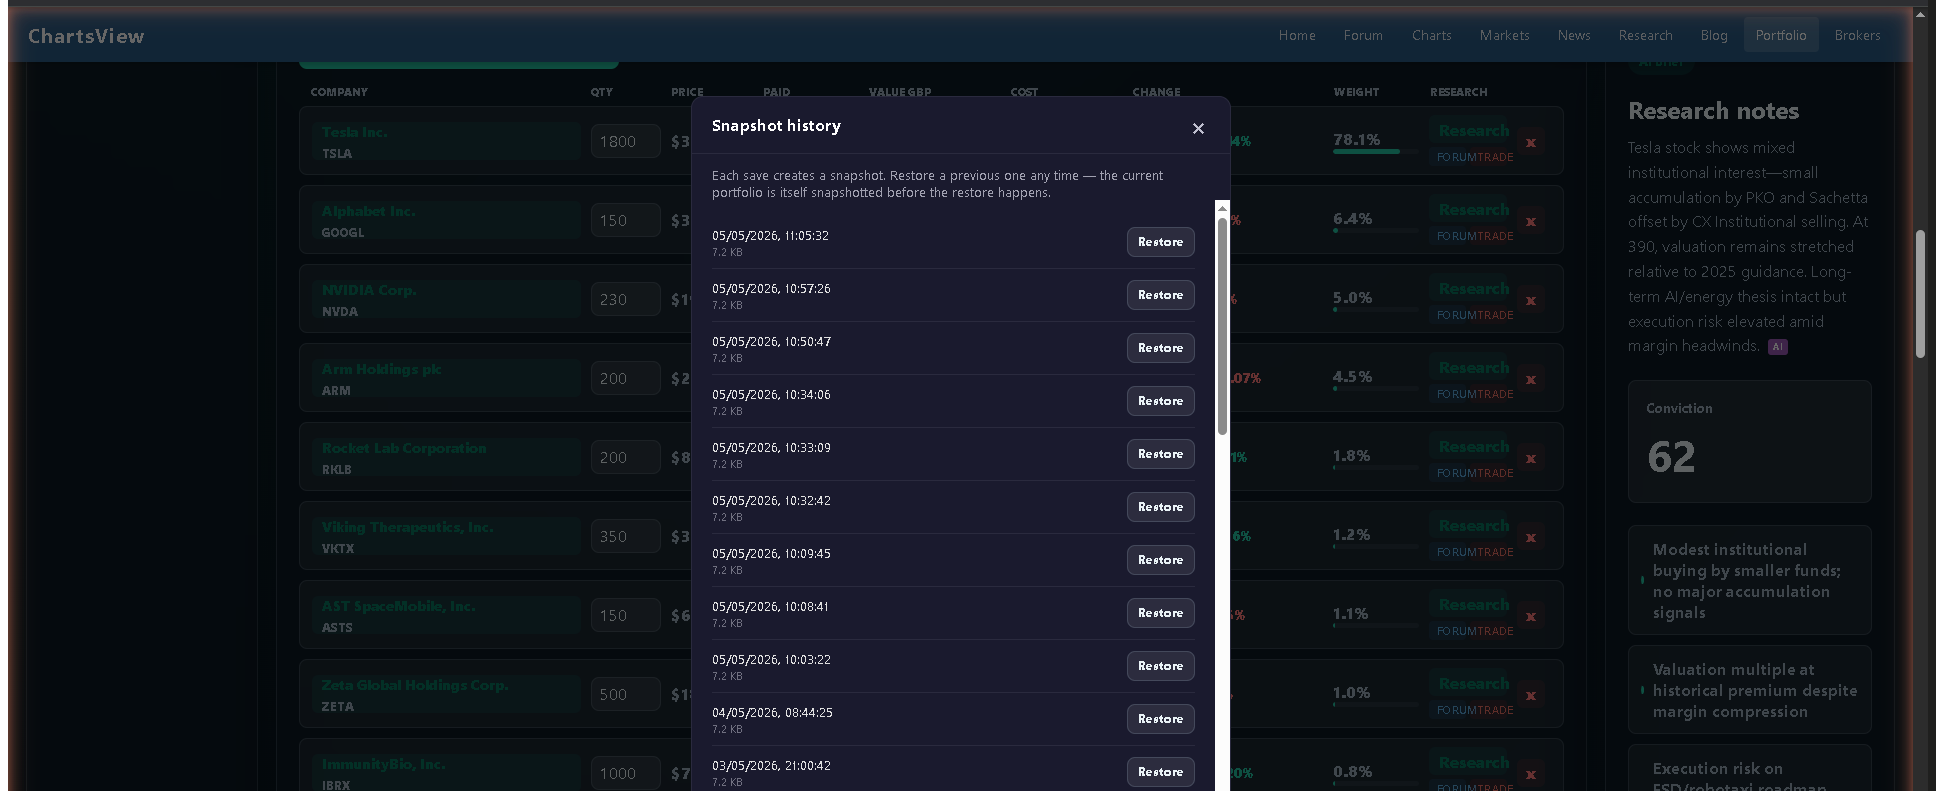 The snapshot history modal in action: every save creates a snapshot, and any prior version can be restored with a single click — the system even snapshots the current portfolio before performing the restore, so you can undo the undo.
Privacy and data ownership
Your portfolio is private to your member account. Each member’s data is stored in its own file on the server with permissions locked down so no one else — not other members, not casual visitors — can read it. The Node service that powers the portfolio binds to localhost only and is reachable only through the authenticated bridge, which checks your Joomla session cookie before forwarding any request.
You can export your portfolio at any time. You own your data. If you ever want to leave, click Export and you’ll have a clean JSON or CSV file you can take elsewhere.
How to get started
If you’re an existing ChartsView member: log in, click Portfolio in the main nav, and the page will open in member mode with your private workspace. Add your holdings, log a few transactions to set your cost basis correctly, and you’re done. Then — and only then — click Analyse my portfolio to use your weekly AI review.
If you’re not yet a member: signup is instant and free. Head to chartsview.co.uk and create an account. Once you’re logged in, the Portfolio page is yours.
What’s next
This release is the foundation. Coming soon: Brevo-powered watchlist alerts (so you get an email when a stock you’re tracking moves through a price level or has a major news event), a market dashboard page with sector heatmaps, and a share tips leaderboard where members can post and track tip performance over time.
If you’ve got feature requests or feedback on the new portfolio, drop them in the forum — we read every thread, and the best ideas usually ship within a week or two.
Welcome to the new ChartsView portfolio. Go set yours up.
Updates since launch (5 May 2026)
A few quality-of-life upgrades since this post went live, based on early member feedback.
Pencil button to edit any holding
Every row in the holdings table now has a pencil icon. Click it and a modal opens with two tabs:
- Edit — change the quantity, paid price, currency, or purchase date in one place. The cost basis recalculates and a buy transaction gets logged automatically.
- Sell shares — record a sale: enter the qty and sell price, optionally hit "Sell all", and the position is reduced (or fully closed) with the right cost basis adjustment.
The modal shows your live current price and your current share count at the top, so you can never sell from the wrong context.
Sold positions tab
A new segmented control above the holdings table lets you flip between Open positions and Sold positions. The Sold tab shows every closed trade with realised P&L, weighted-average buy and sell prices, holding period in days, and exit date. Sorted most-recent first.
Add holding moved to the topbar
The "Shares + Paid price + Add" form now sits next to the Search bar, with a new Currency picker (Auto / USD / GBP / GBX / EUR / CAD / AUD). Search a ticker, type your shares and paid price, click Add — all in one row, no scrolling. There's a contextual "Adding to portfolio: TICKER · Name" header so you always know what you're operating on.
UK stocks display in pence
LSE-listed stocks now read in pence end-to-end the way every UK broker shows them. Scottish Mortgage (SMT.L) reads as 1,431p, not £14.31. Barclays as 426p. Lloyds as 95.5p. Cost basis, change %, and portfolio totals all calculate correctly behind the scenes — you just type prices the same way you see them on your broker statement.
Smaller fixes
The Paid column now shows the full price with currency symbol (e.g. $425.00) — no more truncation to "$390." or similar. Change% recomputes correctly after a manual edit. Edits save to both the server and your browser's localStorage so reloads always reflect your latest changes, and an automatic re-sync on each browser session keeps device-to-device consistency rock-solid.
ChartsView is a UK-based financial trading community. The information on this page is general market commentary and is not personal financial advice. Trading involves risk of loss; AI-generated research is a starting point for your own due diligence, not a recommendation.