Buying stocks is only the beginning. The real work starts after you've invested — monitoring your holdings, measuring performance, and knowing when to make changes. Yet many investors spend hours researching what to buy and almost no time managing what they already own. In this guide, we'll show you how to track your stock portfolio effectively using free tools.
Why Portfolio Tracking Matters
It's easy to assume that once you've bought a stock, you can simply wait and check back in a few years. While long-term thinking is important, completely ignoring your portfolio is a recipe for problems. Companies issue profit warnings, sectors fall out of favour, and your asset allocation can drift significantly from your original plan.
Regular portfolio tracking helps you spot these issues early. It lets you see whether your portfolio is still aligned with your goals, whether any single position has grown too large (or too small), and whether the reasons you originally bought a stock still hold true.
Tracking doesn't mean obsessing over daily price movements. It means having a clear, up-to-date picture of your investments so you can make informed decisions when action is needed. The difference between successful investors and unsuccessful ones often comes down to this discipline.
What You Should Track
Effective portfolio tracking goes beyond just knowing your stock prices. Here are the key metrics every UK investor should monitor:
Individual Stock Performance
For each holding, track the current price, your average purchase price, and the percentage gain or loss. This tells you which investments are working and which aren't. The ChartsView portfolio tracker calculates all of this automatically once you enter your holdings.
Overall Portfolio Return
Your total portfolio return is the single most important number to track. It tells you whether your investment strategy is actually working. Compare this against relevant benchmarks — if you're investing in UK stocks, measure yourself against the FTSE 100 or FTSE All-Share index. If your portfolio consistently underperforms the benchmark, it may be time to reassess your approach.
Sector Allocation
Diversification protects you from sector-specific risks. If 60% of your portfolio is in financial stocks because they've performed well, you're exposed to significant downside if the banking sector hits trouble. Track your sector allocation and rebalance when any single sector exceeds your target weighting.
Dividend Income
If you're building an income portfolio, tracking dividend payments is essential. Monitor which stocks are paying dividends, when payments are due, and whether yields have changed. A sudden dividend cut can signal deeper problems at a company. Use the screener to find stocks with consistent dividend histories.
Position Sizes
No single stock should dominate your portfolio unless you're making a deliberate concentrated bet. Track what percentage each holding represents of your total portfolio. A common guideline is that no single position should exceed 10-15% of your portfolio — though this depends on your risk tolerance and strategy.
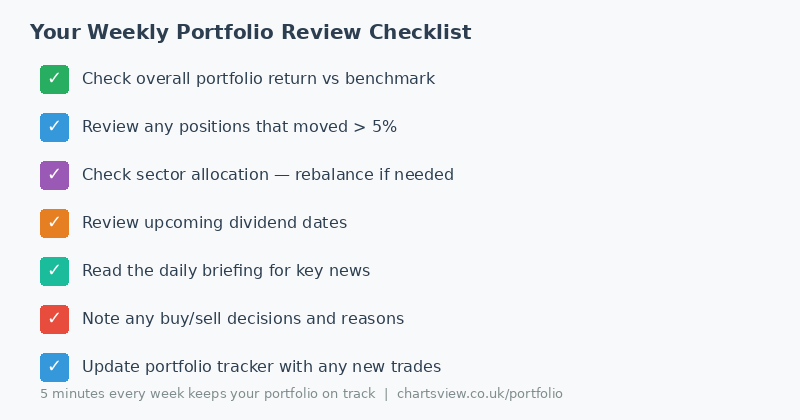
The 5-Minute Weekly Review
You don't need to check your portfolio daily. A focused five-minute review once a week is enough for most investors. Check your overall return, scan for any significant price movements, and read the daily briefing to catch up on any news you missed. This keeps you informed without encouraging overtrading.
Step-by-Step: Setting Up Your Portfolio Tracker
Step 1: Gather Your Holdings Data
Before you set up any tracking tool, collect the basic information for each stock you own: the ticker symbol, the number of shares, and the price you paid (or your average price if you've bought in stages). If you have stocks across multiple brokers, gather data from all of them — the goal is a complete picture of your investments.
Step 2: Enter Your Holdings
Add each holding to the ChartsView portfolio tracker. Enter the stock, the quantity, and your purchase price. The tracker will automatically pull in current pricing and calculate your unrealised gains or losses. This gives you an instant snapshot of where your portfolio stands today.
Step 3: Review Your Allocation
With all your holdings entered, look at your sector breakdown and position sizes. Are you more concentrated than you realised? Is one stock dominating your portfolio because it's performed well? Use the comparison tool to evaluate whether concentrated positions are justified or whether you should diversify further.
Step 4: Set Your Benchmarks
Decide what you're measuring your performance against. For a UK-focused portfolio, the FTSE 100 or FTSE All-Share are natural benchmarks. If you're invested in smaller companies, the FTSE 250 or AIM All-Share might be more appropriate. Your benchmark should reflect the type of stocks you actually hold.
Step 5: Establish a Review Schedule
Commit to a regular review cadence. For most investors, weekly or fortnightly is ideal. Set a specific time — perhaps Sunday evening — to spend five minutes reviewing your portfolio. Check the daily briefing for any significant developments during the week and note anything that requires further investigation.
Step 6: Monitor and Act
Tracking is only valuable if it leads to informed action. When your review reveals something noteworthy — a stock that's fallen significantly, a sector that's become overweight, or a company that's issued a profit warning — investigate further. Use the stock pages for chart analysis and the community feed for other investors' perspectives before making any changes.
Portfolio Tracking Methods Compared
| Method | Pros | Cons |
|---|---|---|
| Dedicated tracker (ChartsView) | Automatic pricing, easy to use, UK-focused | Requires initial setup |
| Spreadsheet (Excel/Sheets) | Fully customisable, formulas | Manual price updates, time-consuming |
| Broker platform | Shows actual holdings | Only shows one broker, limited analysis |
| Pen and paper | No technology needed | No automation, easy to lose |
For most UK investors, a dedicated portfolio tracker like ChartsView offers the best balance of simplicity and functionality. It handles the data automatically while giving you the analysis tools you need. If you use multiple brokers, it's particularly valuable as a single view across all your holdings.
Common Portfolio Tracking Mistakes
Checking Too Frequently
Looking at your portfolio every hour leads to anxiety and impulsive trading. Stock prices fluctuate daily — that's normal. Set your review schedule and stick to it. Constant monitoring creates emotional responses that rarely lead to good investment decisions.
Ignoring Costs
Your real return isn't just the price change — it includes dividends received minus trading costs, platform fees, and stamp duty. Make sure you're tracking your true net performance, not just the headline share price movement.
Anchoring to Purchase Price
Many investors refuse to sell a losing stock because they're anchored to what they paid for it. Your purchase price is irrelevant to the stock's future prospects. The question isn't "am I up or down?" but "would I buy this stock at today's price?" If the answer is no, consider whether it still deserves a place in your portfolio.
Not Tracking Cash
If you have uninvested cash sitting in your ISA or trading account, include it in your portfolio view. Cash is a position — sometimes a deliberate one. Knowing how much of your portfolio is in cash versus invested helps you understand your true exposure to the market.
Forgetting to Rebalance
Over time, your best performers will grow to represent a larger share of your portfolio while underperformers shrink. Without rebalancing, your portfolio drifts away from your original allocation. Review your weightings quarterly and consider trimming outsized positions to maintain your target diversification.
Rebalancing Rule of Thumb
Consider rebalancing when any single position drifts more than 5 percentage points from your target allocation. For example, if your target for financial stocks is 20% and they've grown to 26%, it may be time to trim. Use the screener to find new opportunities to reinvest the proceeds.
Building Better Investment Habits
Portfolio tracking is really about building good investment habits. The investors who consistently perform well over the long term aren't necessarily the smartest stock pickers — they're the most disciplined ones. They have a process, they follow it, and they make adjustments based on evidence rather than emotion.
Start simple. Set up your tracker, establish a weekly review, and commit to recording the reasons for every buy and sell decision. Over time, this creates a valuable log of your investment thinking that you can learn from. You'll start to notice patterns — perhaps you consistently hold losers too long, or sell winners too early — and correct them.
The tools available to UK investors today are better than ever. Between the ChartsView portfolio tracker, screener, comparison tool, and daily briefing, you have everything you need to manage your investments professionally — all completely free. The only thing required is the discipline to use them consistently.
Start Tracking Your Portfolio Today
Set up your portfolio on ChartsView in minutes. Enter your holdings, see your performance at a glance, and take control of your investment journey with free, powerful tracking tools.
Set Up Your Portfolio Tracker