Articles
This pattern is considered as a key method in candlestick charting because it provides a great deal of clues and information about the sentiment in the market.
The pattern consists of two different formations: Gap Ups and Gap Downs, we will look at both in turn.
Gap Up
This pattern consists of two candles representing two consecutive days, it is created when the opening price of the candle on day 2 is higher than the closing price of the candle on day 1 thus literally creating a gap of white space between the two candles.
This pattern indicates that the sentiment is positive and that the bulls have taken control by starting at a high therefore this pattern would indicate a bullish signal.
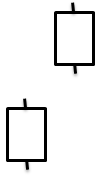
Gap Down
This pattern consists of two candles representing two consecutive days, it is created when the opening price of the candle on day 2 is lower than the closing price of the candle on day 1 thus literally creating a gap of white space between the two candles.
This pattern indicates that the sentiment is negative and that the bears have taken control by starting at a low therefore this pattern would indicate a bearish signal.

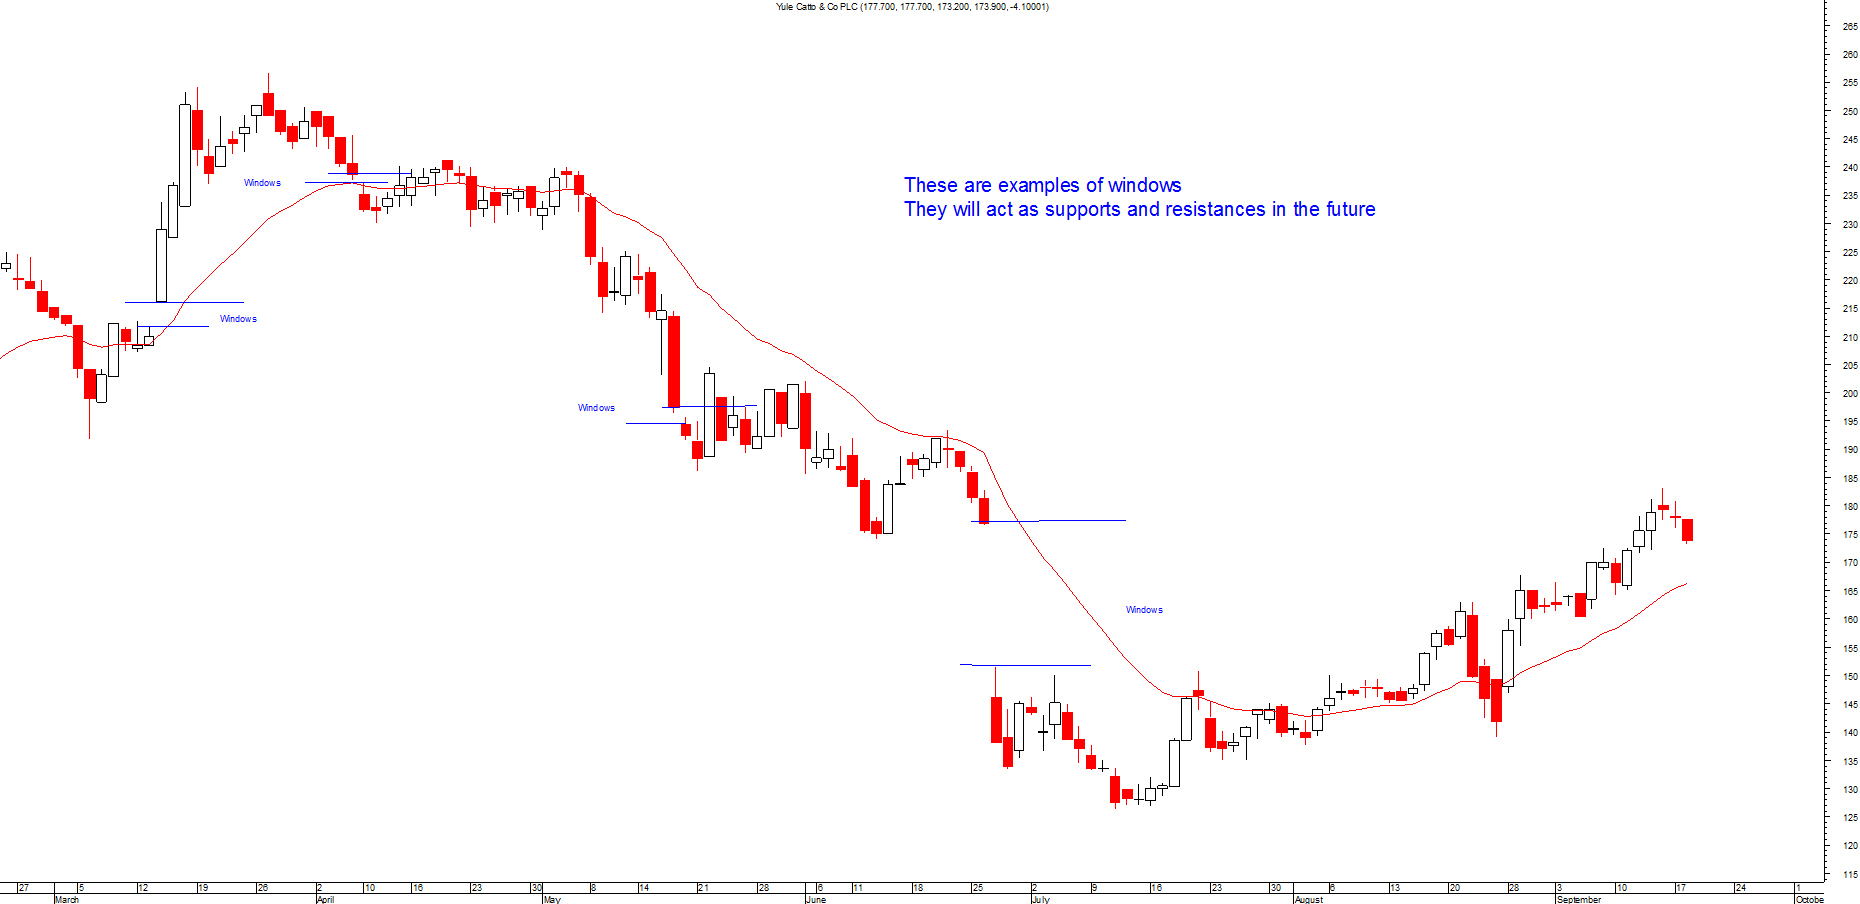
Please click on picture above to get a larger picture
Most candlestick patterns should appear close to previous resistance or support levels depending on what type it is. You should only trade a candlestick pattern if it's near these levels.
Don't trade using these patterns if it's not at the top or bottom of a trend. These patterns appear a great deal so you have to make certain you only trade at the right level.
This is very important as you will end up over trading them and you will end up losing more money than you imagined.