Articles
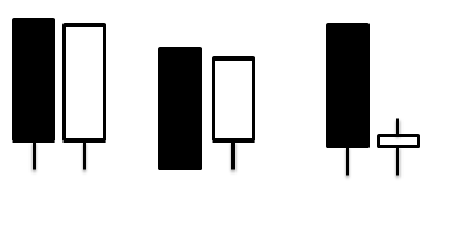
This pattern consists of two candles representing two consecutive days. Usually found at the end of a down trend, it starts bearish with a large black candle on the first day however things soon change on the second day.
The bulls are in complete control as they open at the same price as the previous day but draw the price up to a new high on which it closes.
The extremes are roughly the same, taking the shape of a tweezer. This pattern can signal a change of feeling in the market to more of a bullish nature.
Please click on picture above to get a larger picture
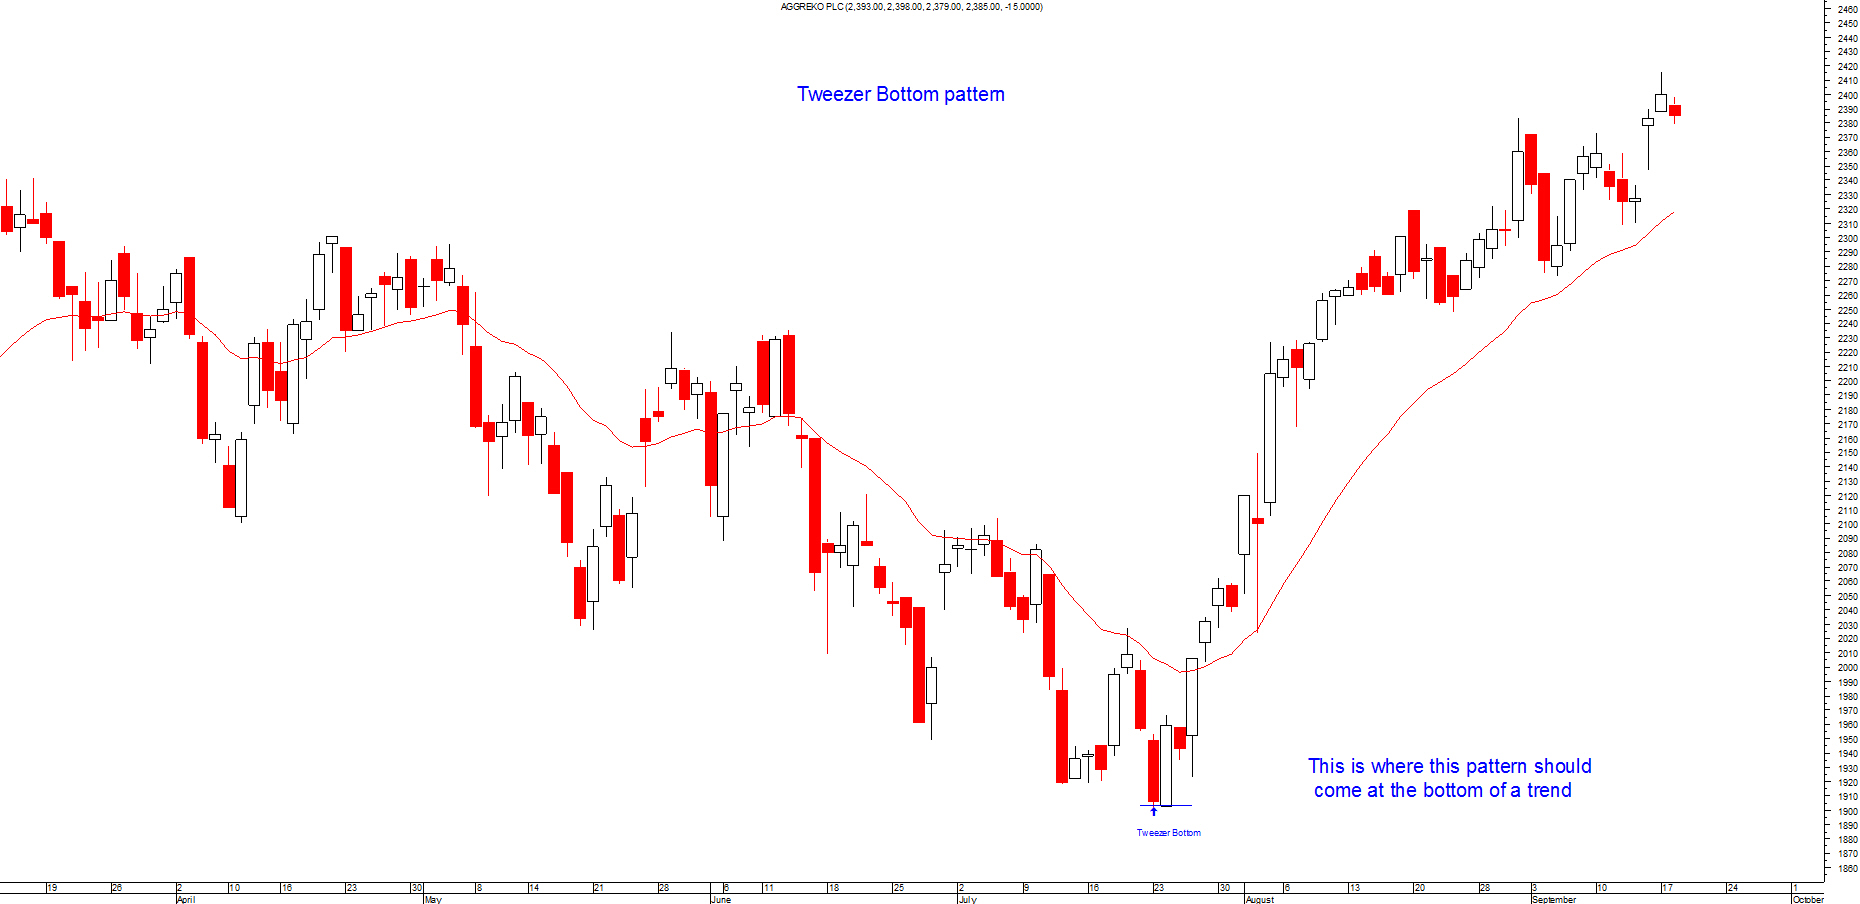
Most candlestick patterns should appear close to previous resistance or support levels depending on what type it is. You should only trade a candlestick pattern if it's near these levels.
Don't trade using these patterns if it's not at the top or bottom of a trend. These patterns appear a great deal so you have to make certain you only trade at the right level.
This is very important as you will end up over trading them and you will end up losing more money than you imagined.