Articles
Line charts are created by a single line joined together by the end of day closing price.
Same is true of all time frames, so if you were to plot the weekly line chart then you would use the closing price at the end of the trading week.
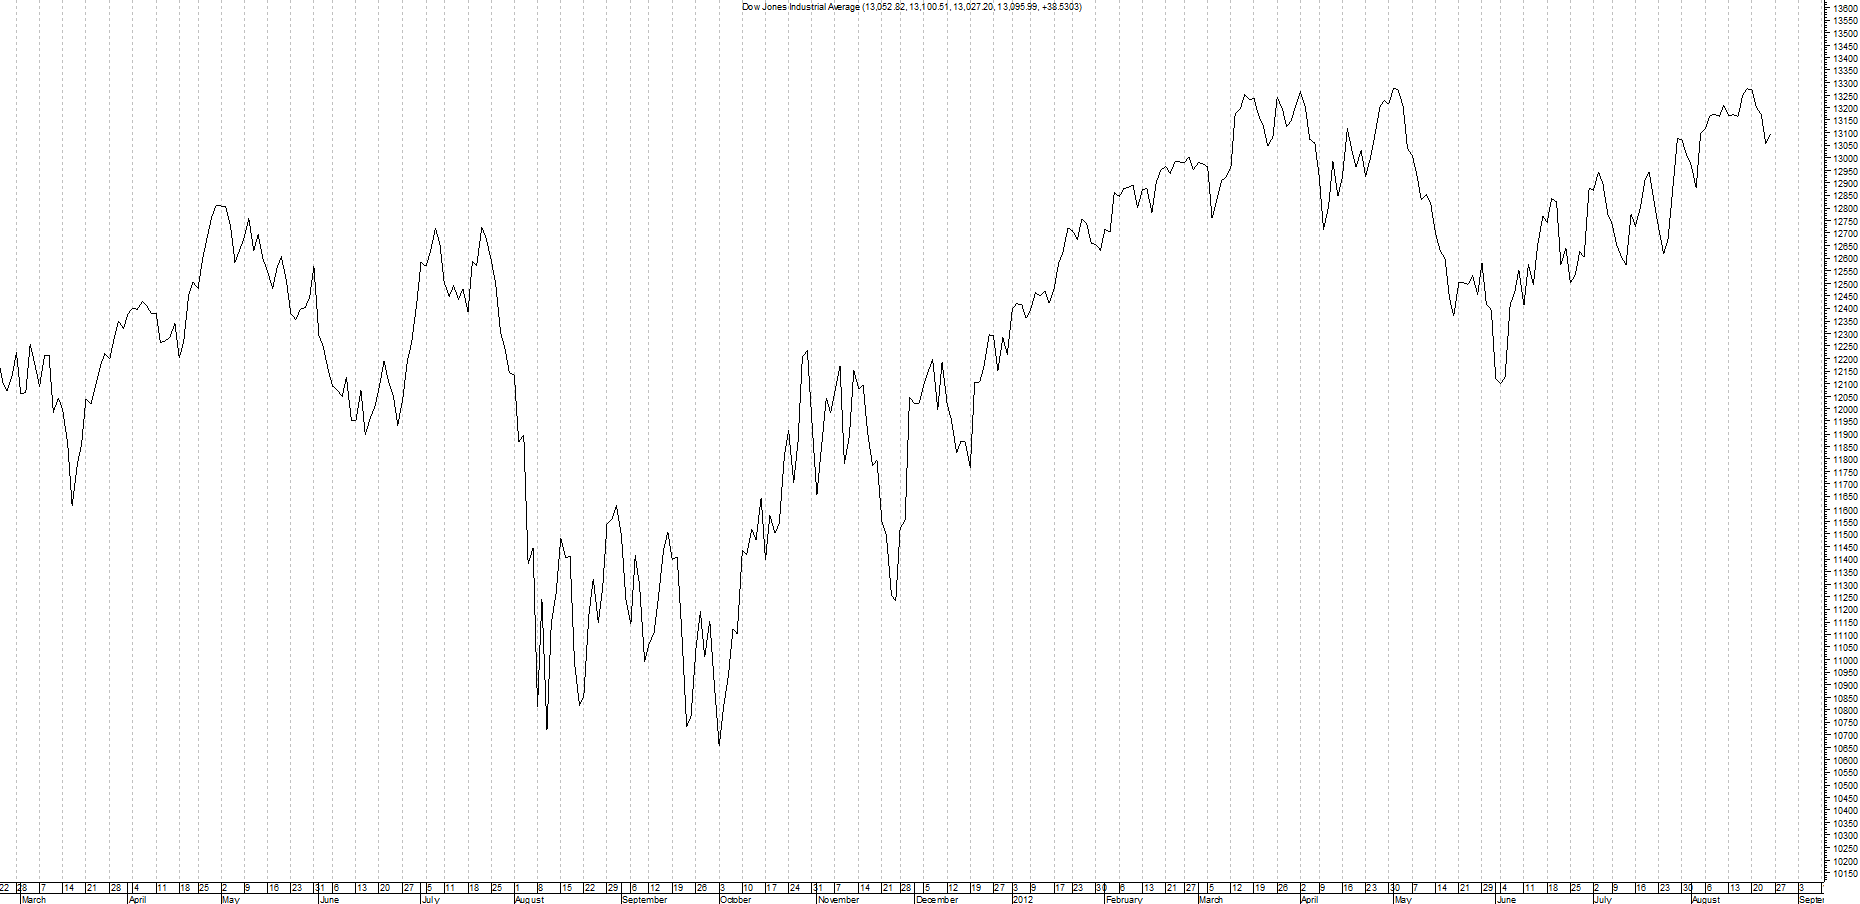
Chart is provided by MetaStock and is an example of a line chart
Please click on picture below to get a larger image
Advantages
- Line charts are very simple to use due to the lack of complexity.
- They can be easily interpreted.
- They can also give a quick snapshot.
Disadvantages
- The down side to line charts are there lack of data.
- The moves during the day are not shown so trying to find true supports and resistances area can be difficult and less reliable.