Articles
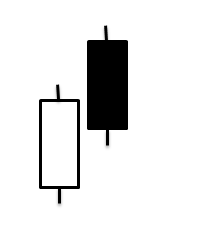
This pattern consists of two candles representing two consecutive days. Usually found at the top of an up trend, it starts bullish with a white candle and on the second day the candle reaches a new high but things soon change as suggested by the name.
The price does not stay at the high but instead the bears take control and reverse the trend all the way back so that the price finishes on a low and midway down the first candle.
If on the third day it finishes on a low then that would confirm this reversal further.
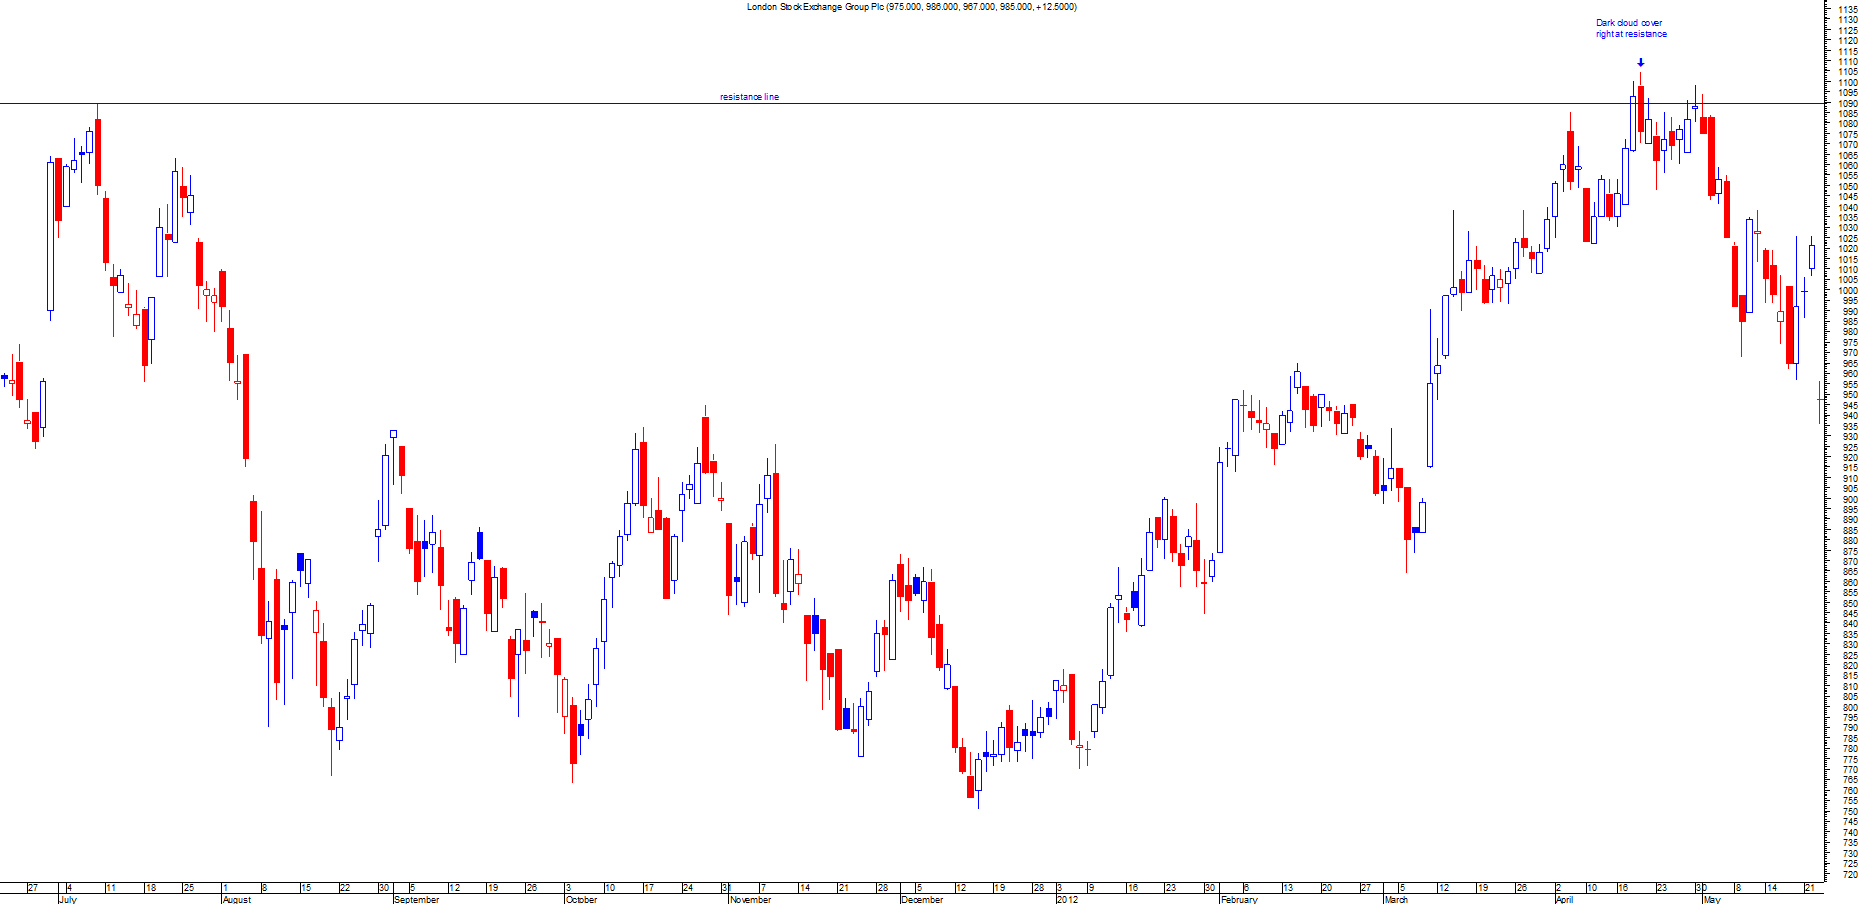
Please click on picture above to get a larger picture
Most candlestick patterns should appear close to previous resistance or support levels depending on what type it is. You should only trade a candlestick pattern if it's near these levels.
Don't trade using these patterns if it's not at the top or bottom of a trend. These patterns appear a great deal so you have to make certain you only trade at the right level.
This is very important as you will end up over trading them and you will end up losing more money than you imagined.