Chartsview blog
General trading and all to do with financial markets
Share Tips from 2nd September - 20th October 2013
in ChartsView Blog:- Font size: Larger Smaller
- Hits: 26601
- 0 Comments
- Subscribe to this entry
- Bookmark
This is an update of the shares that that have been tipped since 2nd september to 20th October in the Premium section called "Share Tips". It's been very profitable netting in excess of 1500 points from the combined shares tipped.
This blog is going to be done like the previous blogs where it will show you the before picture and after pictures of the shares. This is the best way to show this, as its easy to follow and as many know I don't do hindsight trading like many so called pros out there. This blog will show this. I will put the dates on the companies tipped so that members can check when the tips were done so that you know it's the real deal. Like I have said there is no hindsight trading. It's all done by pure charting, here goes.
2nd September 2013
BALF.L
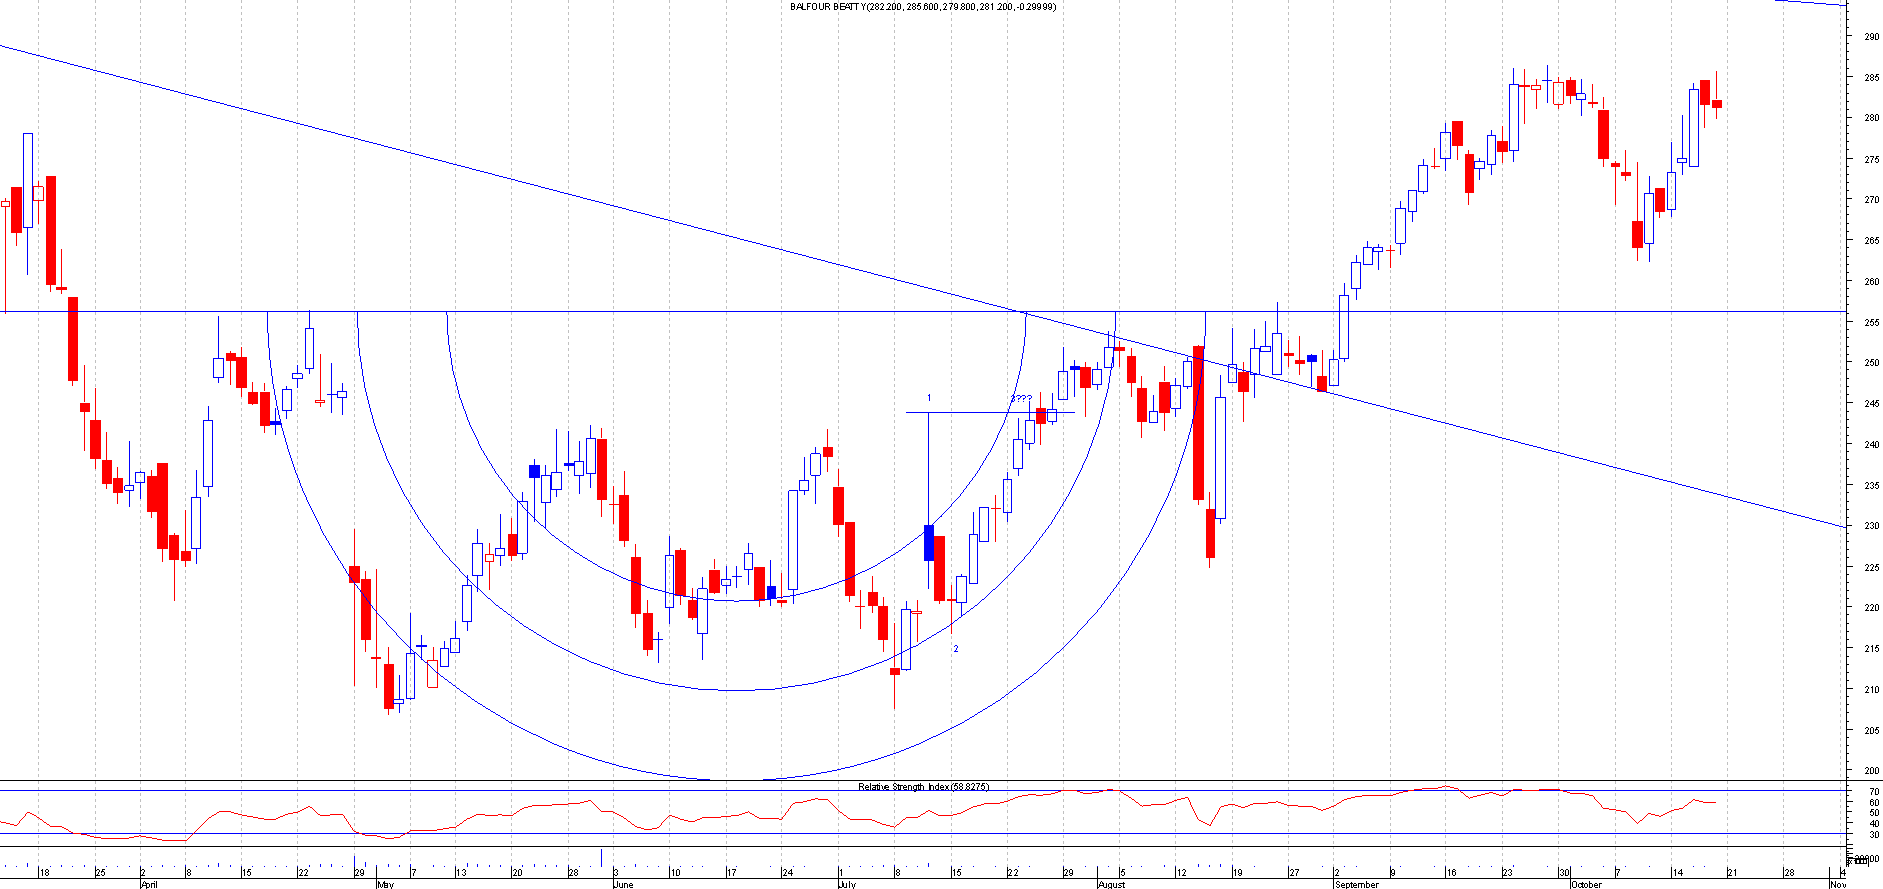
Before: This is the Chart of Balfour Beatty when I first mentioned this:
After: This broke out nicely and moved away from the breakout point. There was 28 points for the taking on this. This is a free trade now so stops on the remainder should be set for profits.
BLND.L
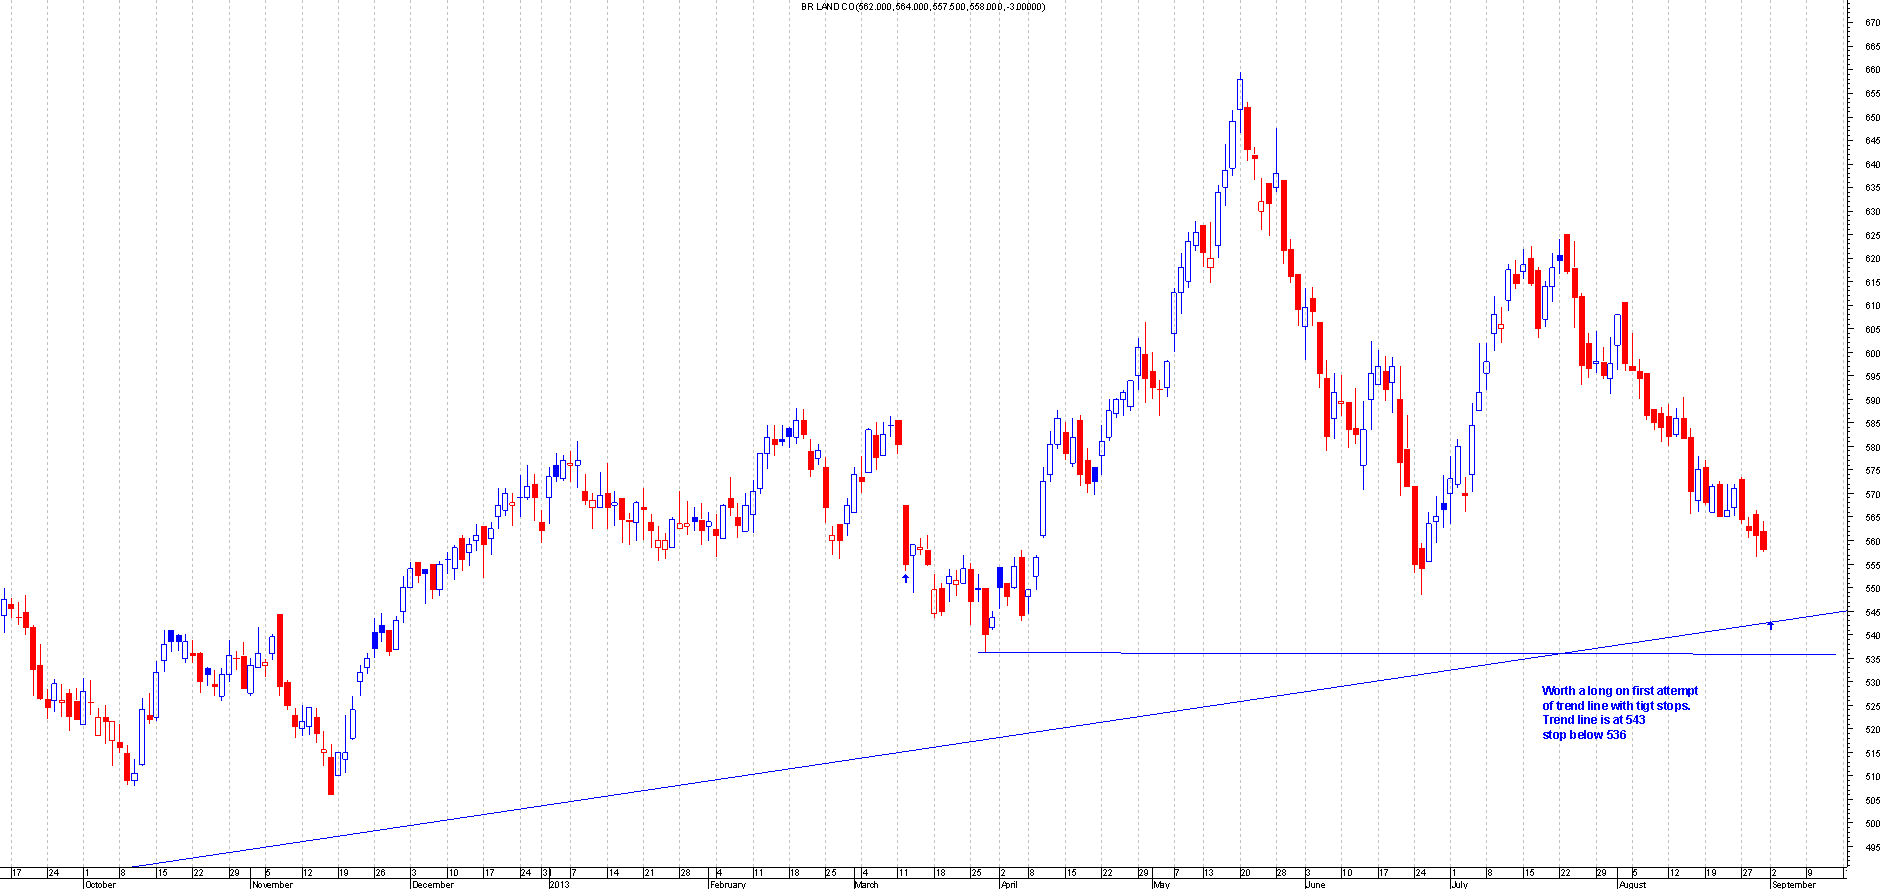
Before: This is the Chart of BR LAND CO when I first mentioned this:
After: This bounced of the trend line perfectly and currently up 66 points.
9th September 2013
ADN.L
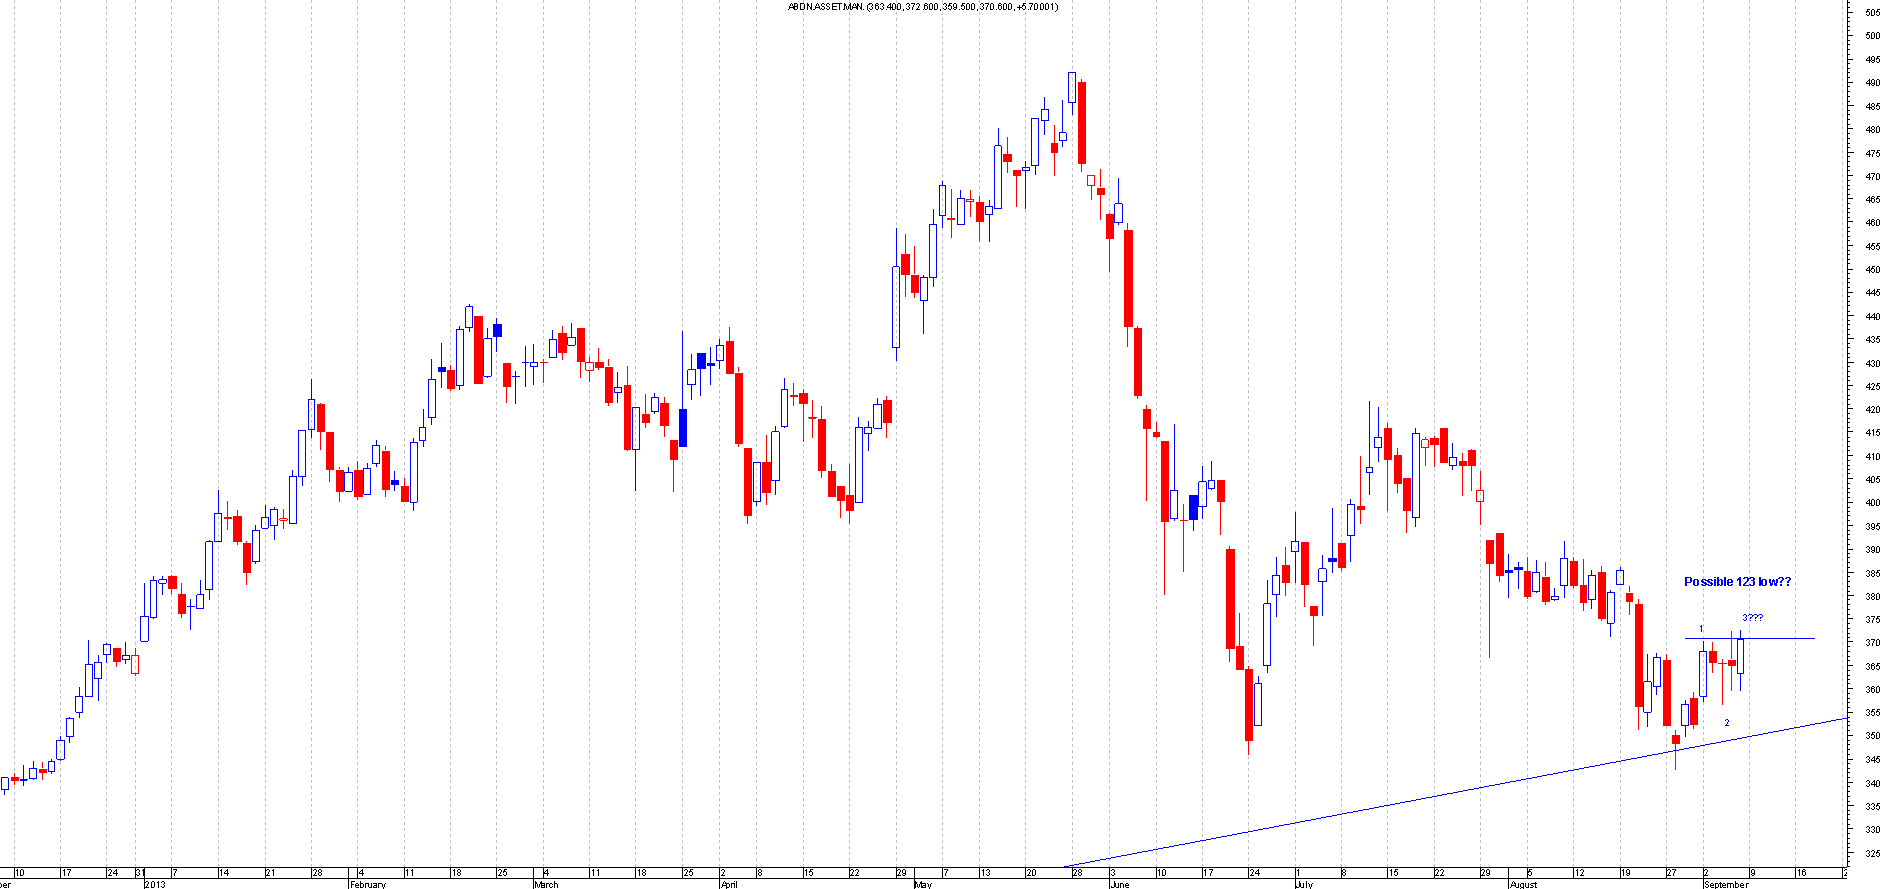
Before: This is the Chart of Abdn Assett Management when I first mentioned this:
After: This broke out of a 123 low formation and has moved 47 points. This should be a free trade.
HOME.L
Before: This is the Chart of Home Retail when I first mentioned this:
After: You can see the symmetrical Triangle formation clearly in the making. This broke out and now currently up 23 points+.
16th September 2013
OXIG.L
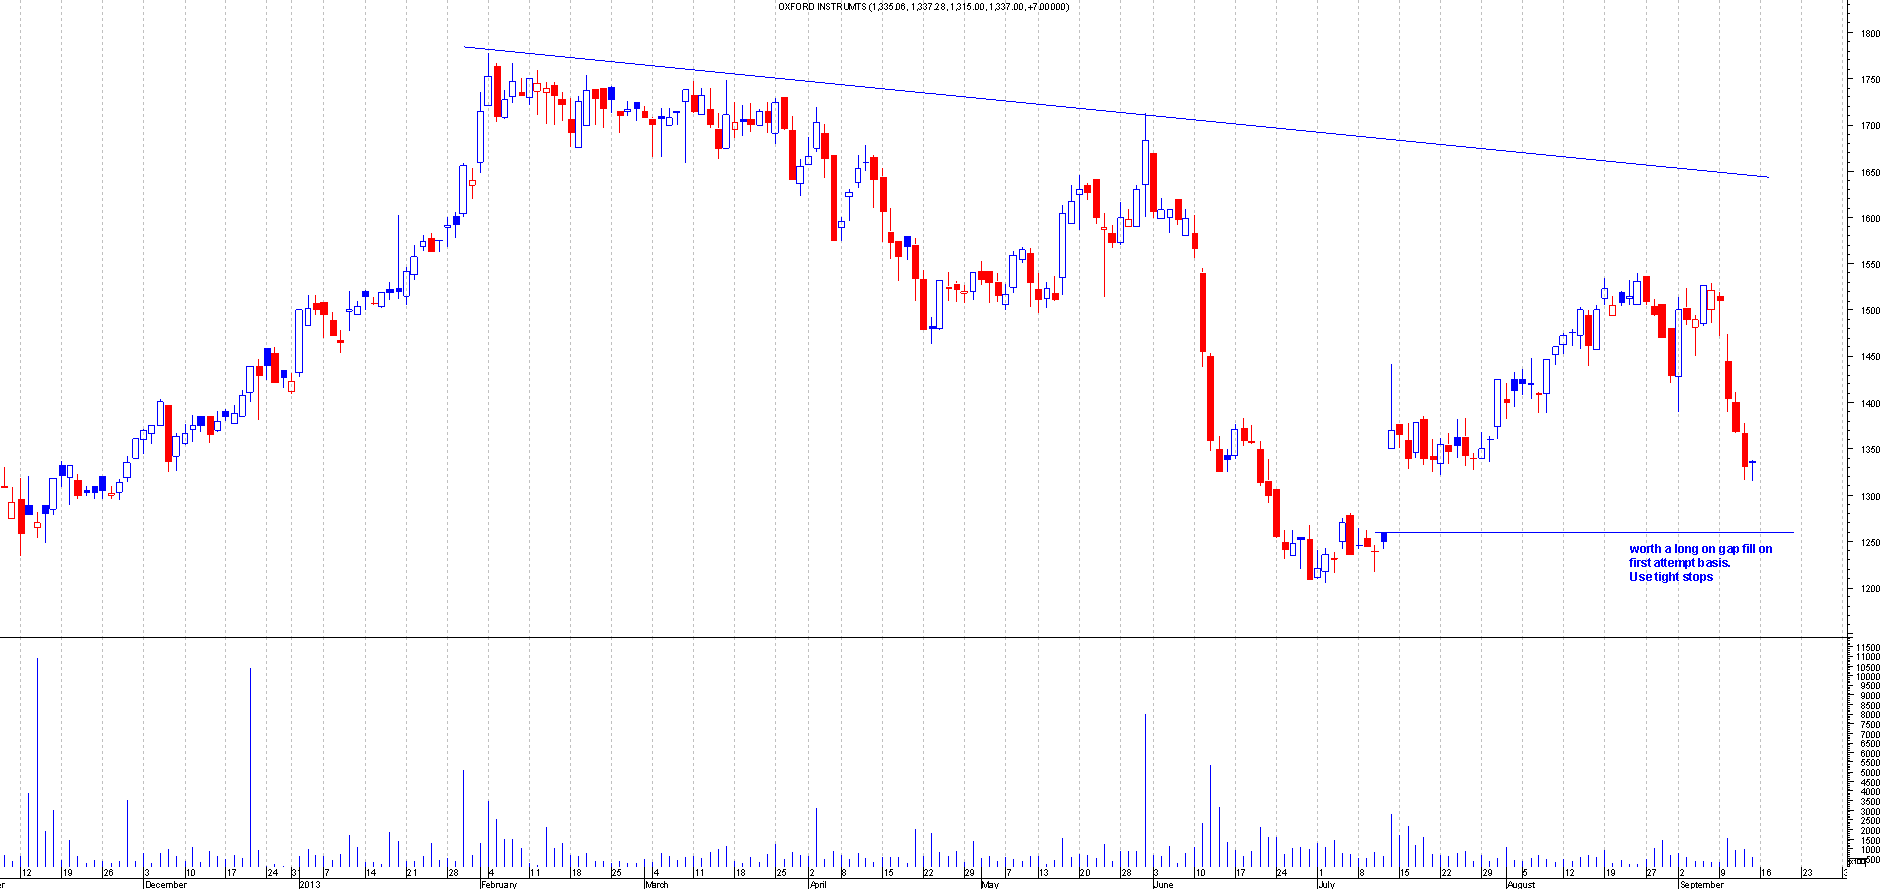
Before: This is the Chart of Oxford Instruments when I first mentioned this:
After: As can be seen from the chart this bounced of perfectly from the gap fill on the first attempt and moved about 120 points. This was a perfect first attempt trade and shows the power of a gap support.
ULVR.L
Before: This is the Chart of Unilever when I first mentioned this:
After: This broke out of the 123 low formation and moved about 110 points from entry. This worked out nicely but this did go down afterwards but should not have been a losing trade as it should have been a free trade.
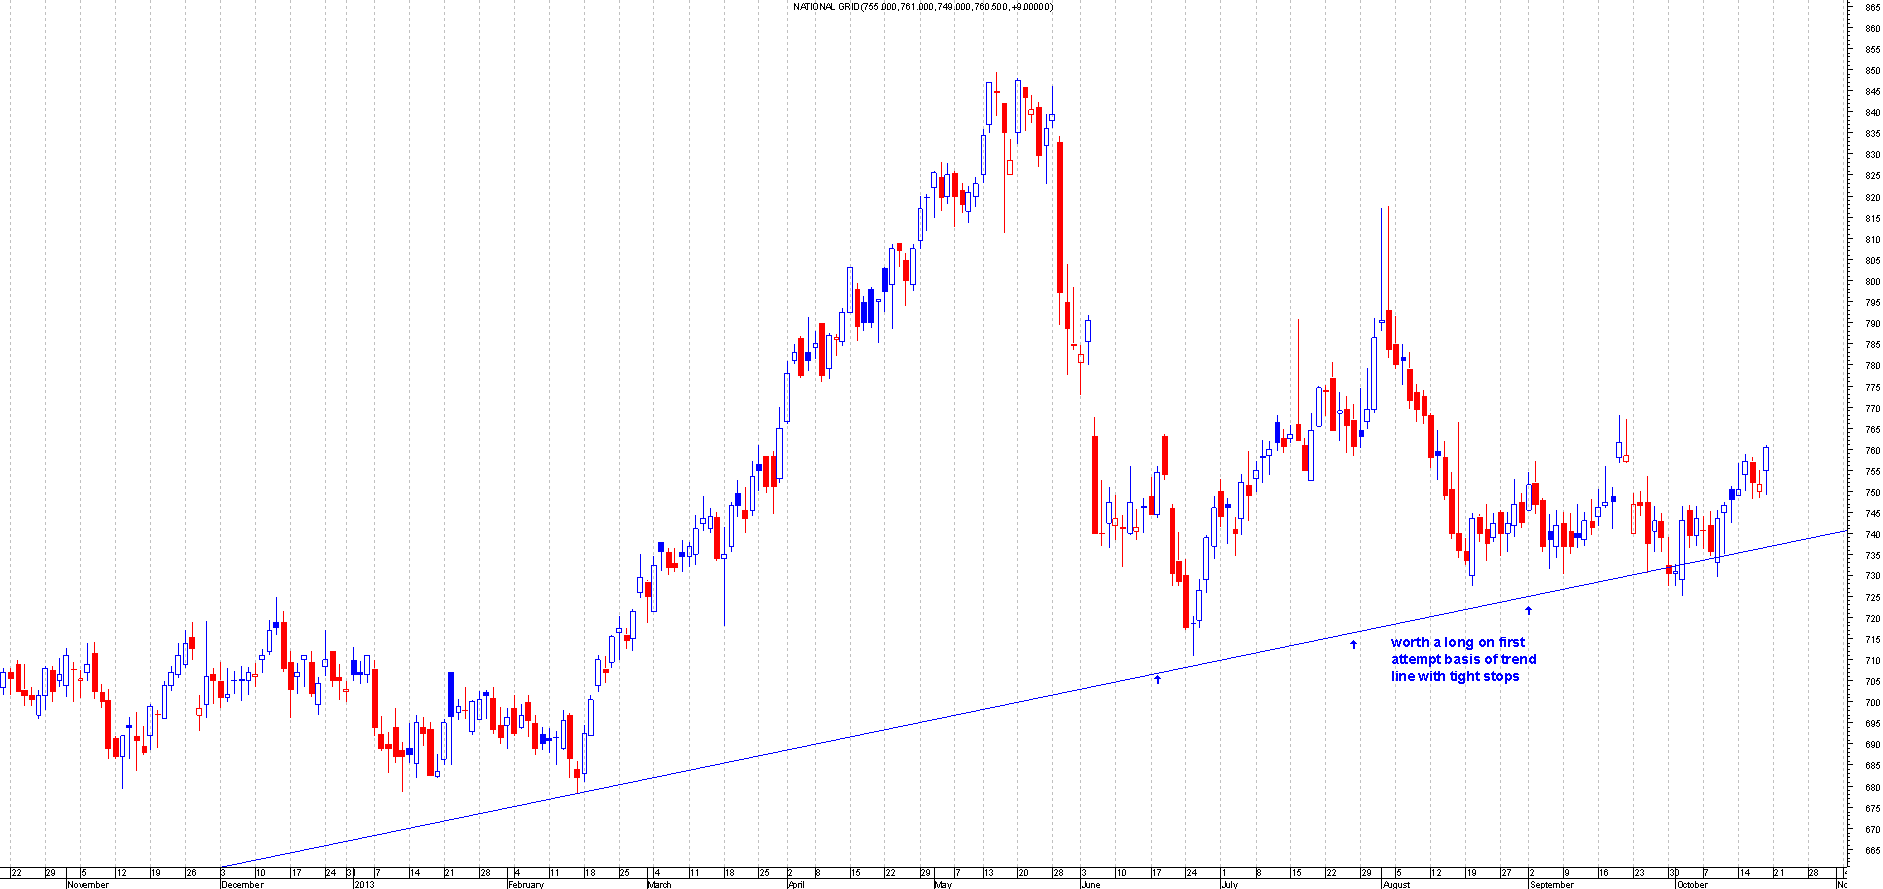
NG.L
Before: This is the Chart of National Grid when I first mentioned this:
After: This bounced of the trend line on the first attempt nicely and hugged it for a while. This is currently over 35 points in profit and should be a free trade by now.
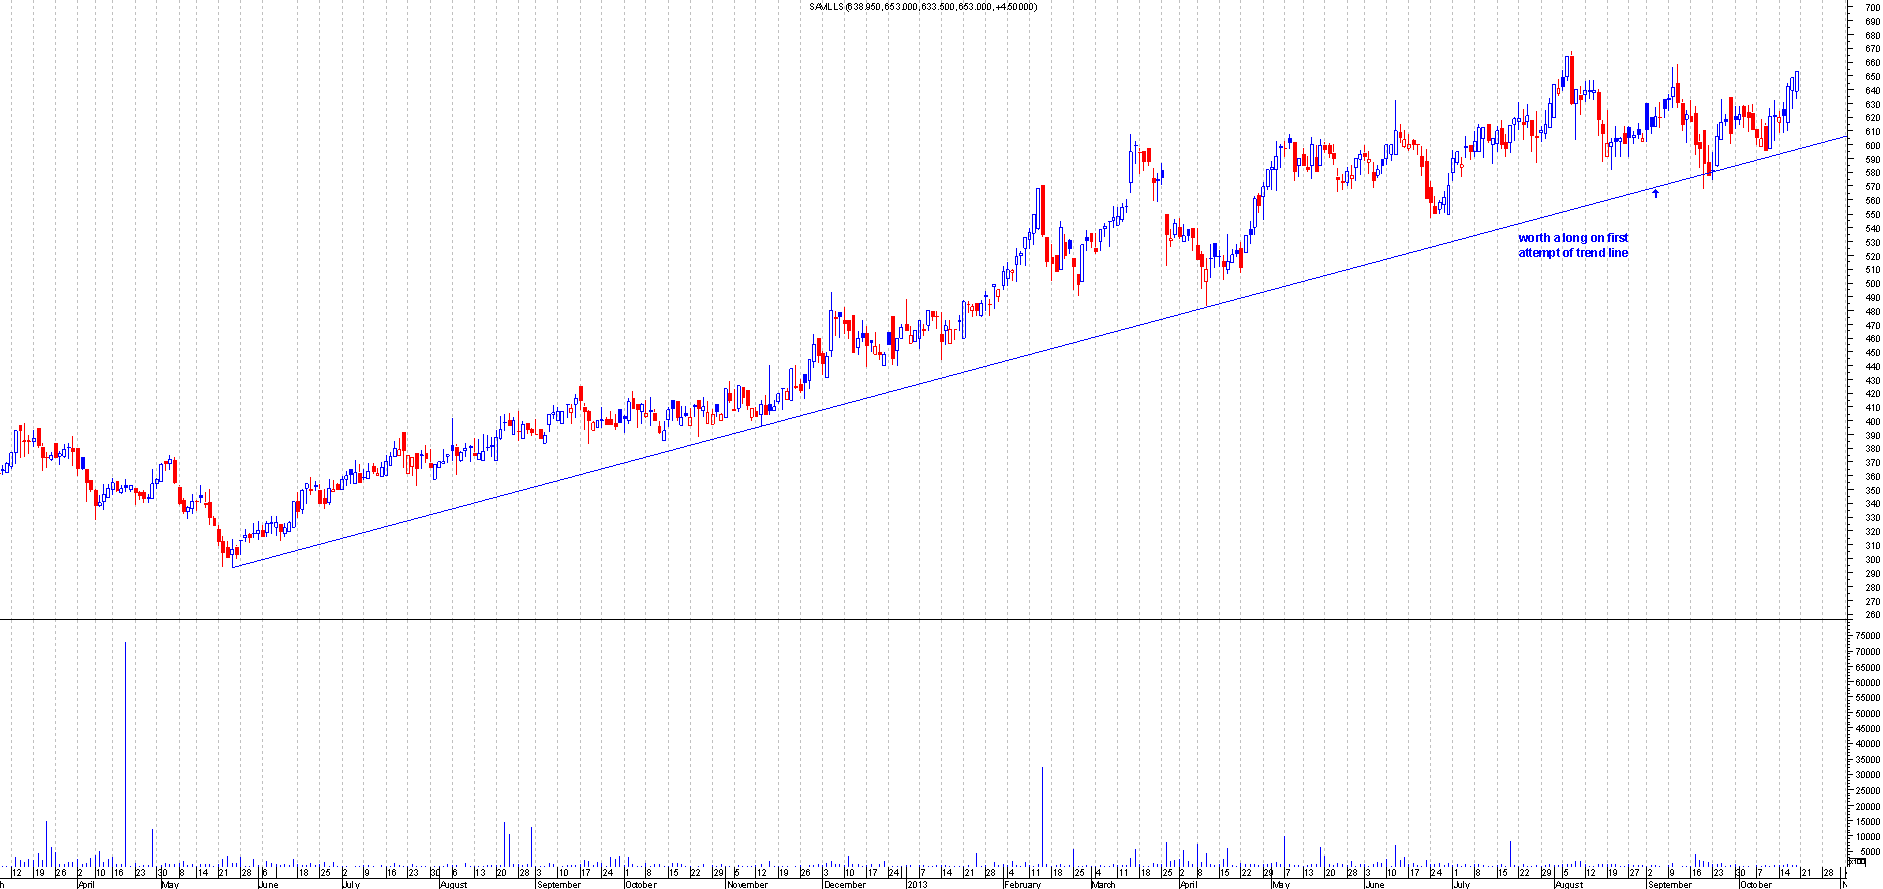
SVS.L
Before: This is the Chart of Savills when I first mentioned this:
After: This bounced of nicely from the trend line on the first attempt. The trend line was at an area where there were horizontal support so this added to the signal. This has moved over 75 points from the trend line so now this should be a free trade.
23rd September 2013
BGEO.L
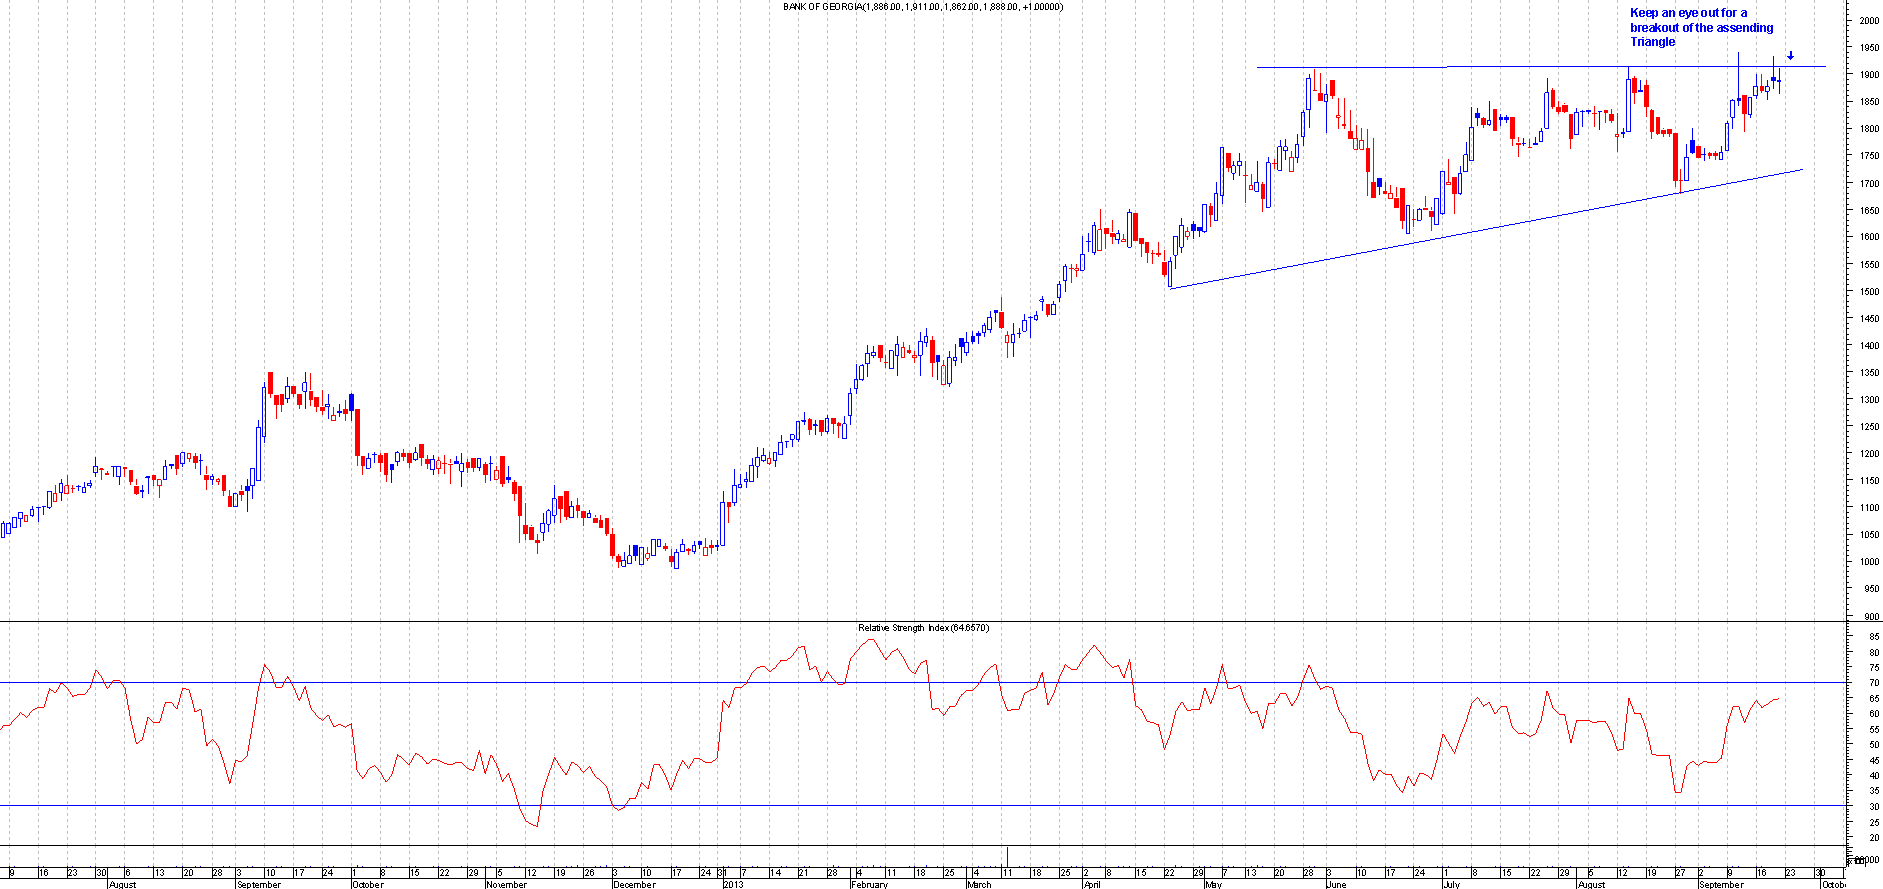
Before: This is the Chart of Bank of Georgia when I first mentioned this:
After: This broke out of the Assending Triangle nicely and moved over 210 points. This should be a free trade by now.
TATE.L
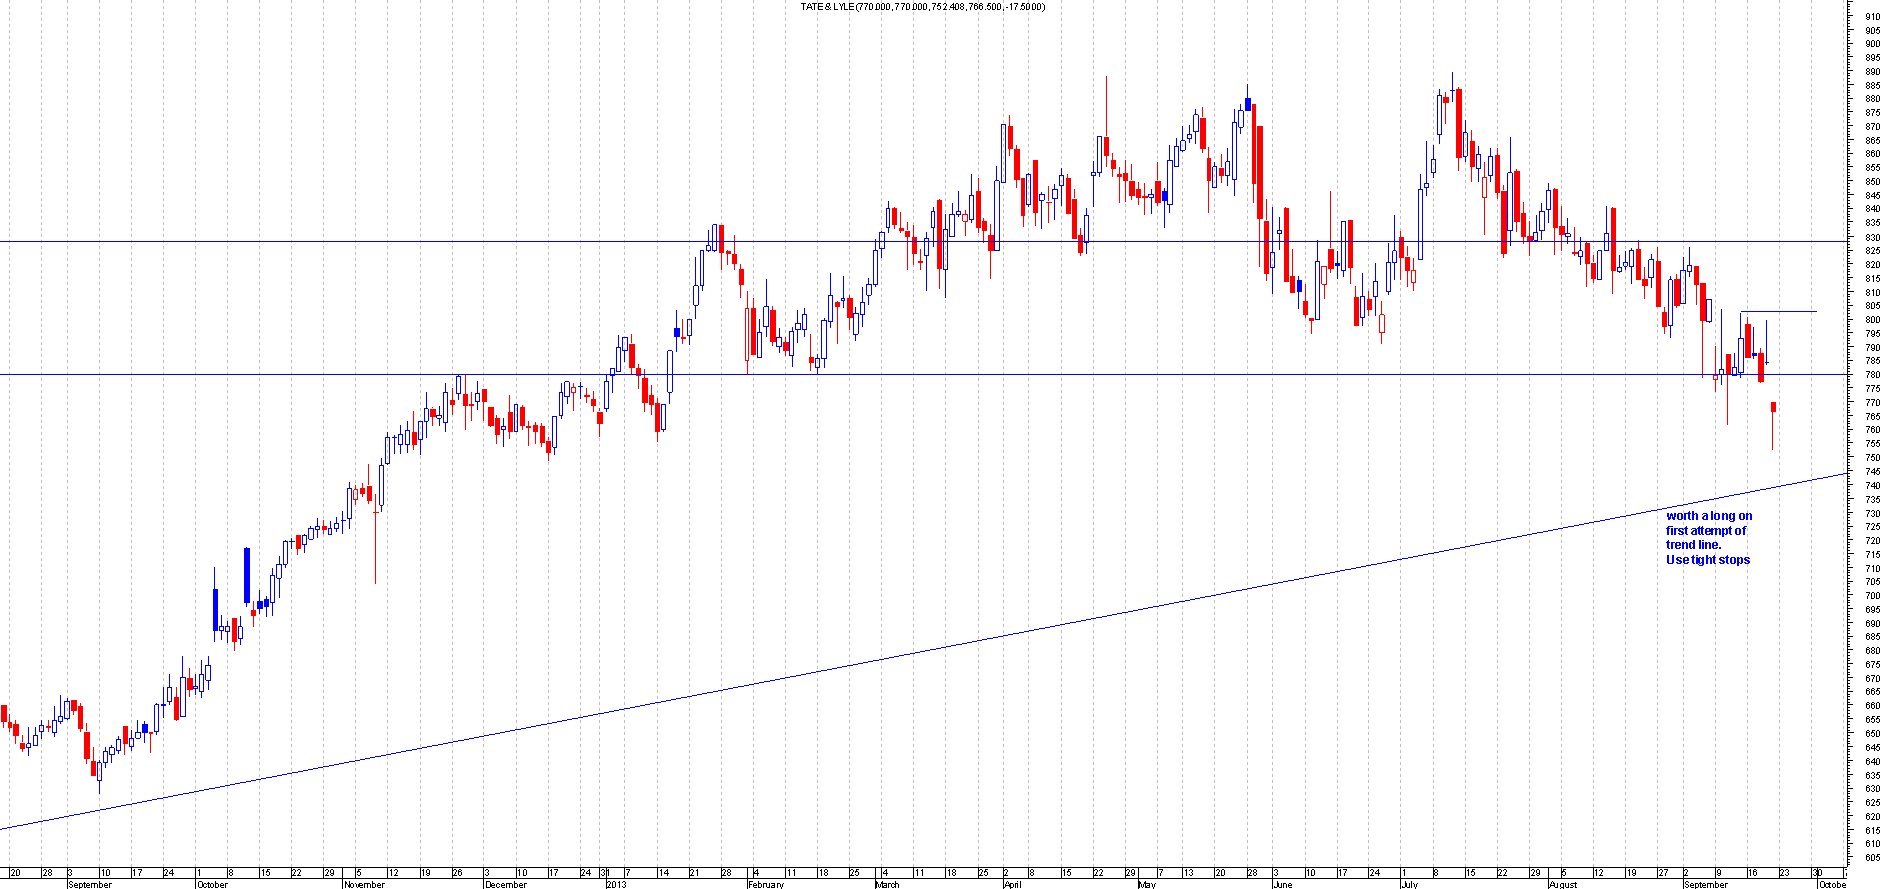
Before: This is the Chart of Tate and Lyle when I first mentioned this:
After: This one did not bounce of straight away but desided to go sideways hugging the trend line.This has moved about 40 points so should be a free trade.
30th September 2013
BBA.L
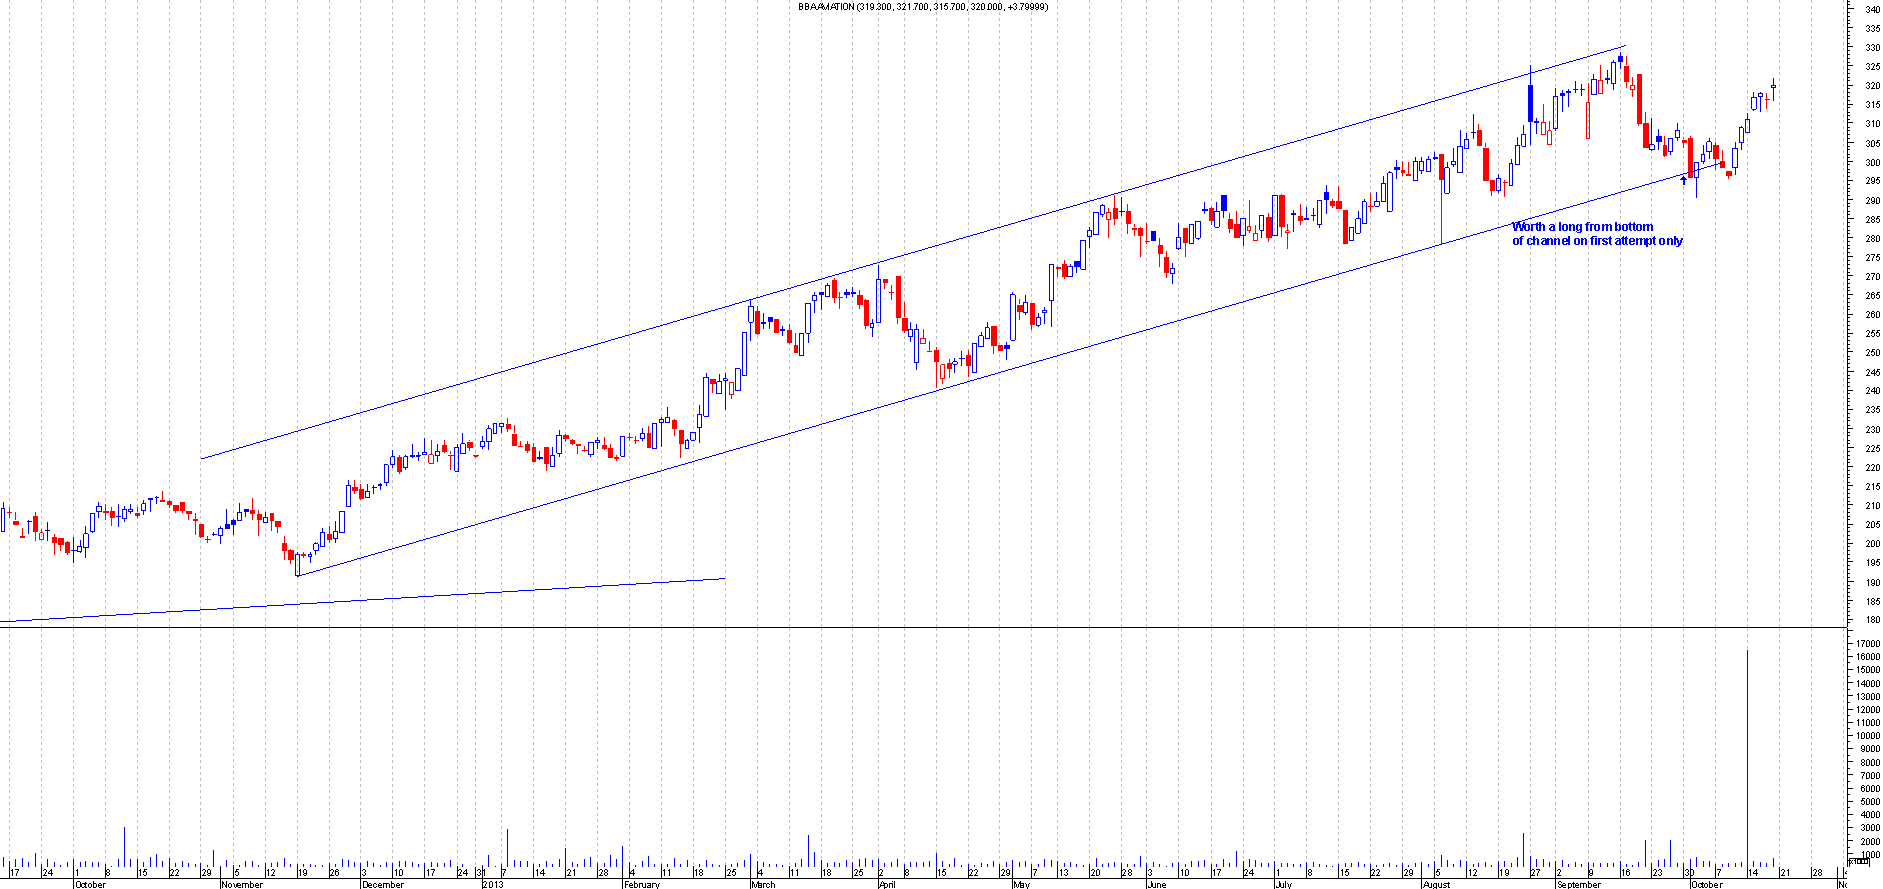
Before: This is the Chart of BBA Aviation when I first mentioned this:
After: This bounced of nicely from the bottom of the channel/trend line on first attempt. This did go down the following day but should have kept you in if you placed the stop below a previous support. This has moved over 30 points and now should be a free trade.
BRBY.L
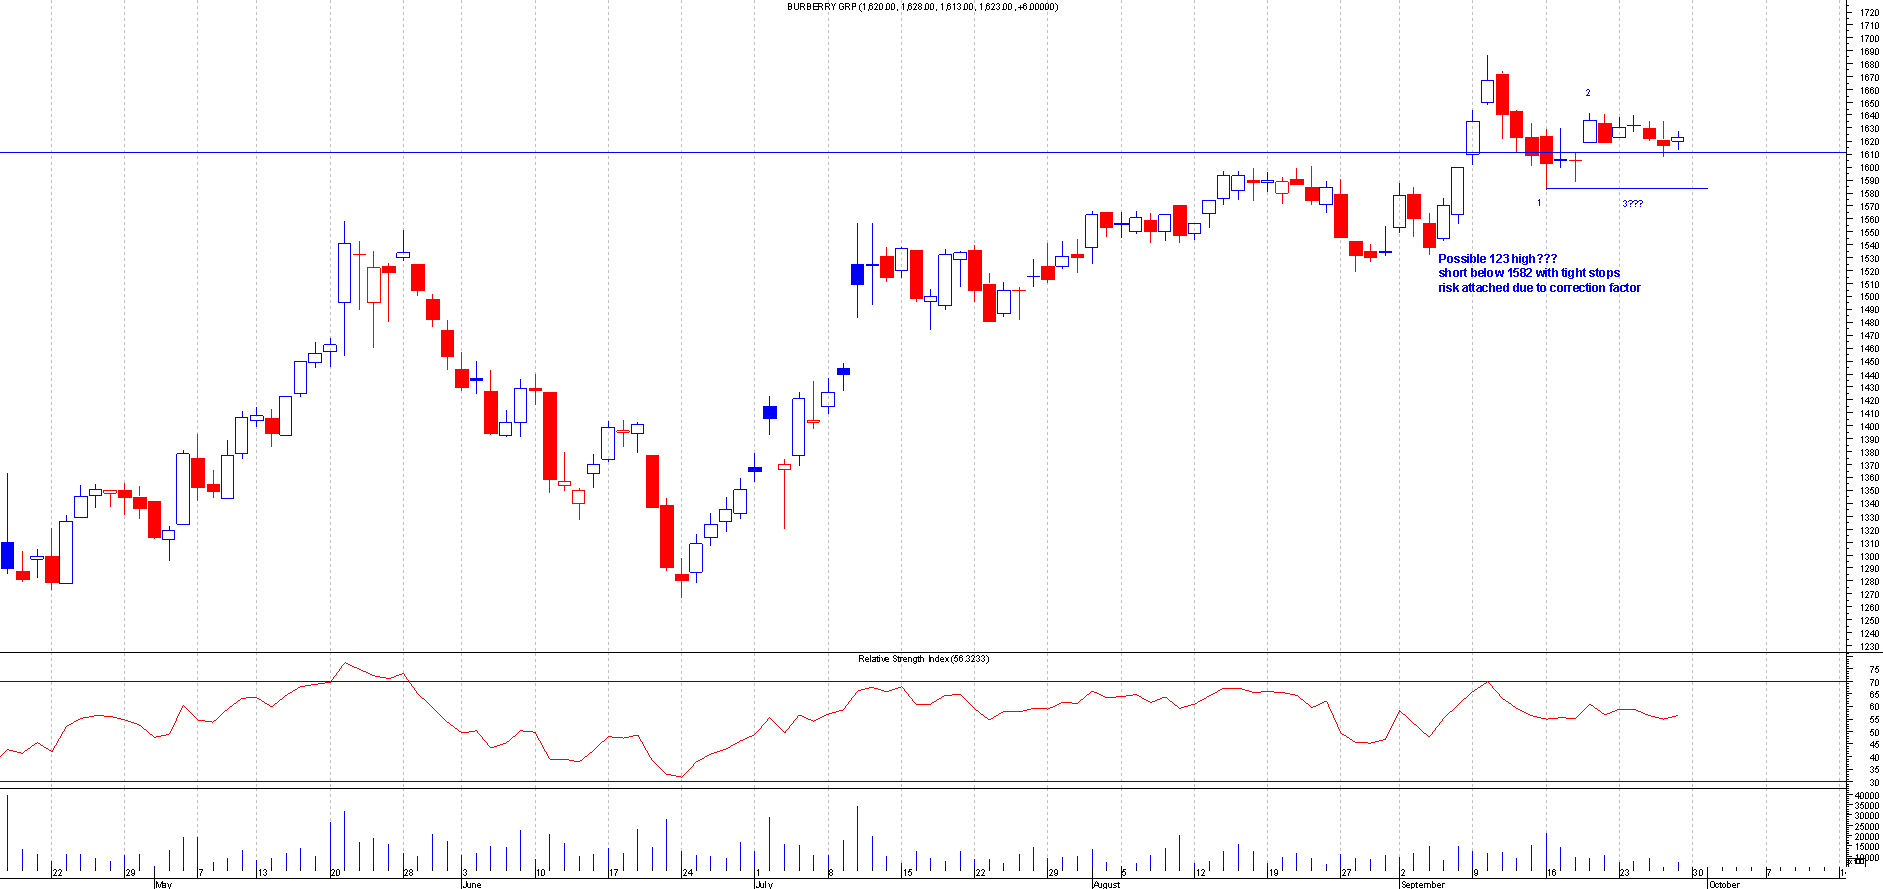
Before: This is the Chart of Burberry when I first mentioned this:
After: This was a trade based on the 123 high formation. This worked out nicely and had moved over 160 points and now should be a free trade.
CLDN.L
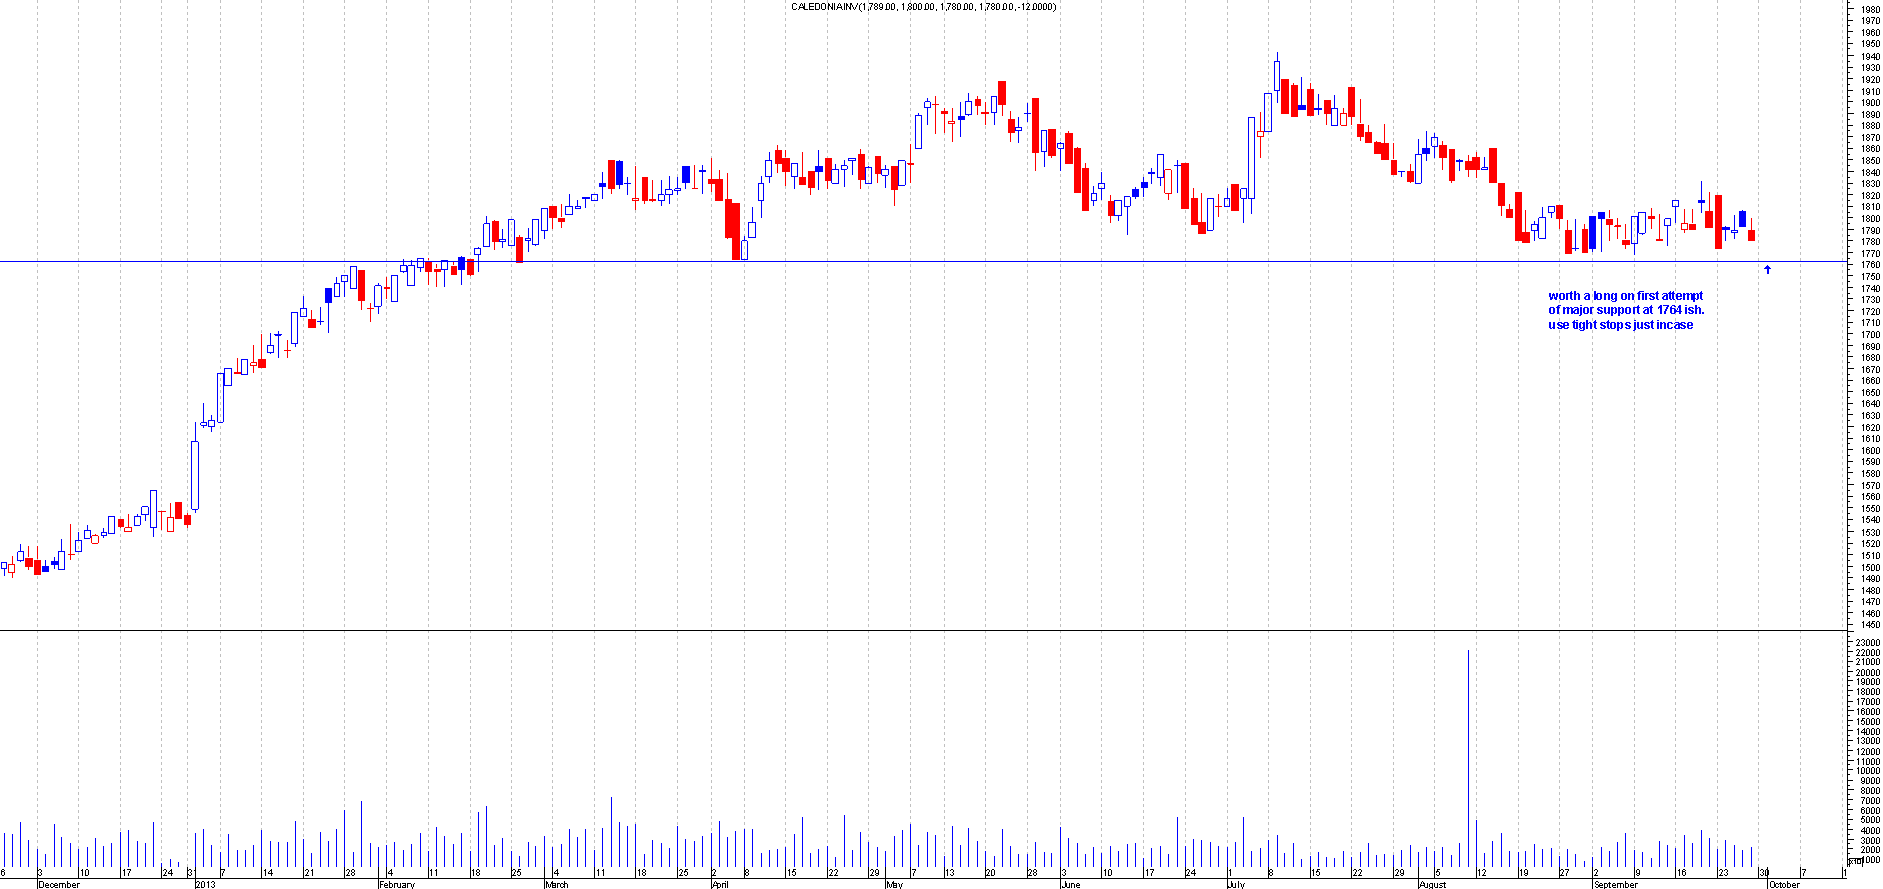
Before: This is the Chart of Caledonia Investment when I first mentioned this:
After: This has been hovering around this area for quite some time and the trade just about activated and has since moved 150 points+. This should be a free trade now.
DCG.L
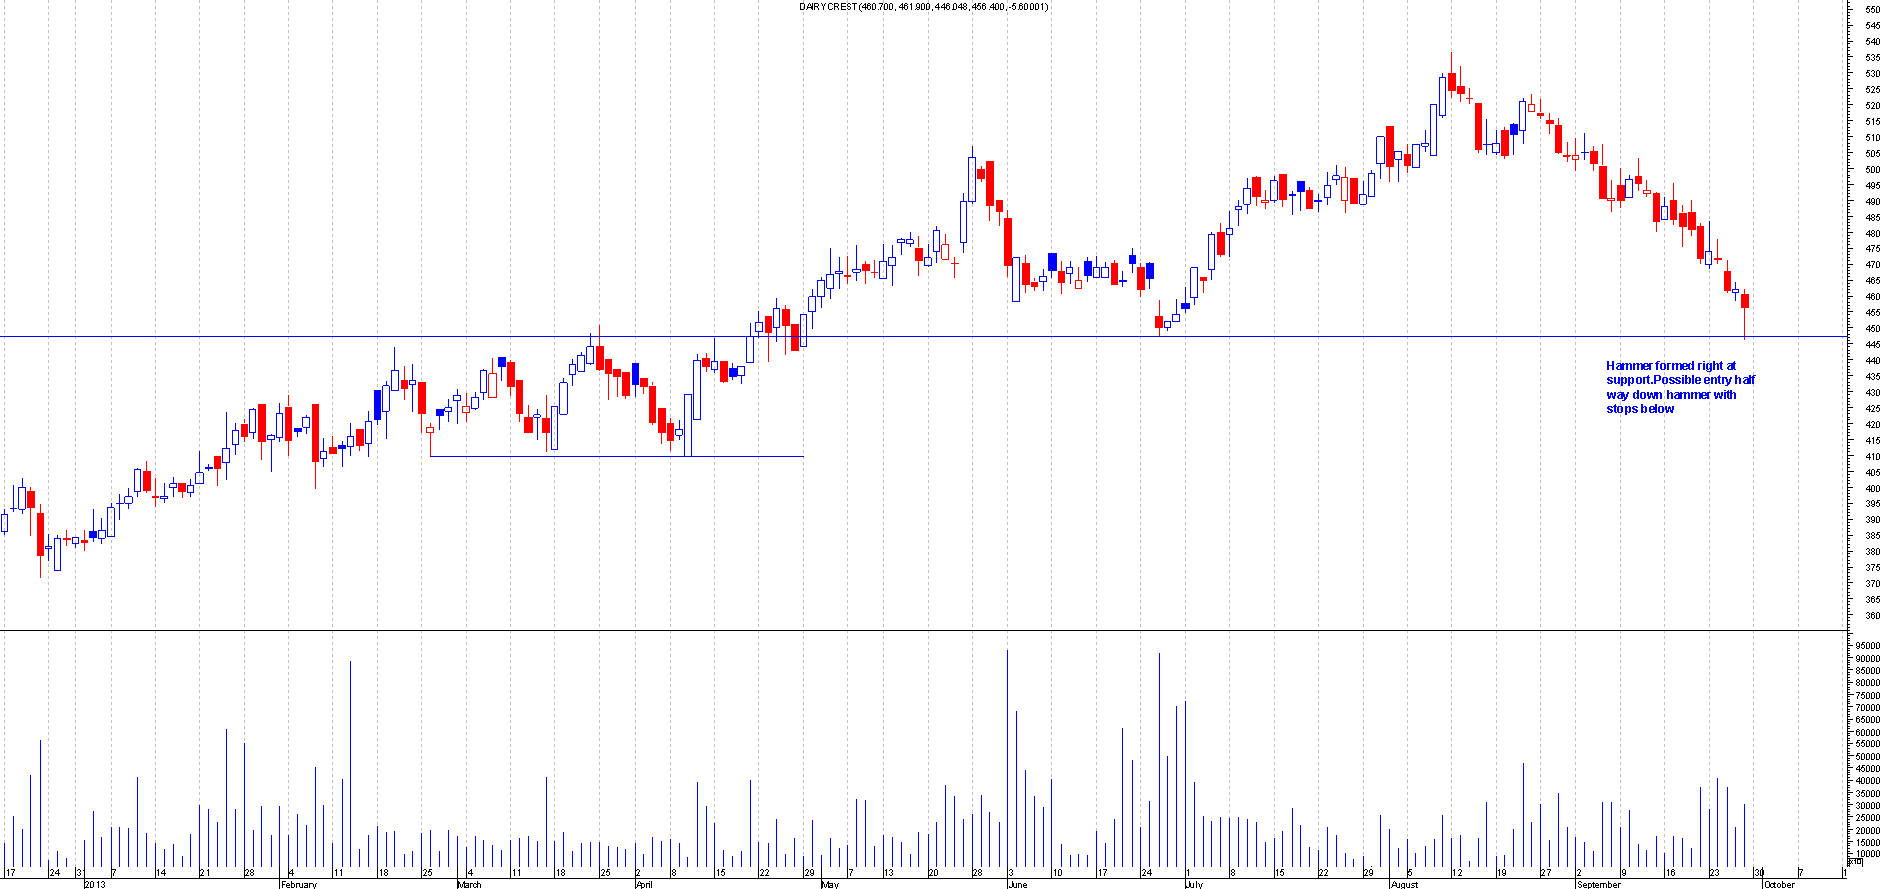
Before: This is the Chart of Dairy Crest when I first mentioned this:
After: This trade was text book with regards to how a hammer should be played.The entry happened the following day with the price going half way down the hammer.This then bounced of hard and now currently 70+ points in profit and should be a free trade.
EXPN.L
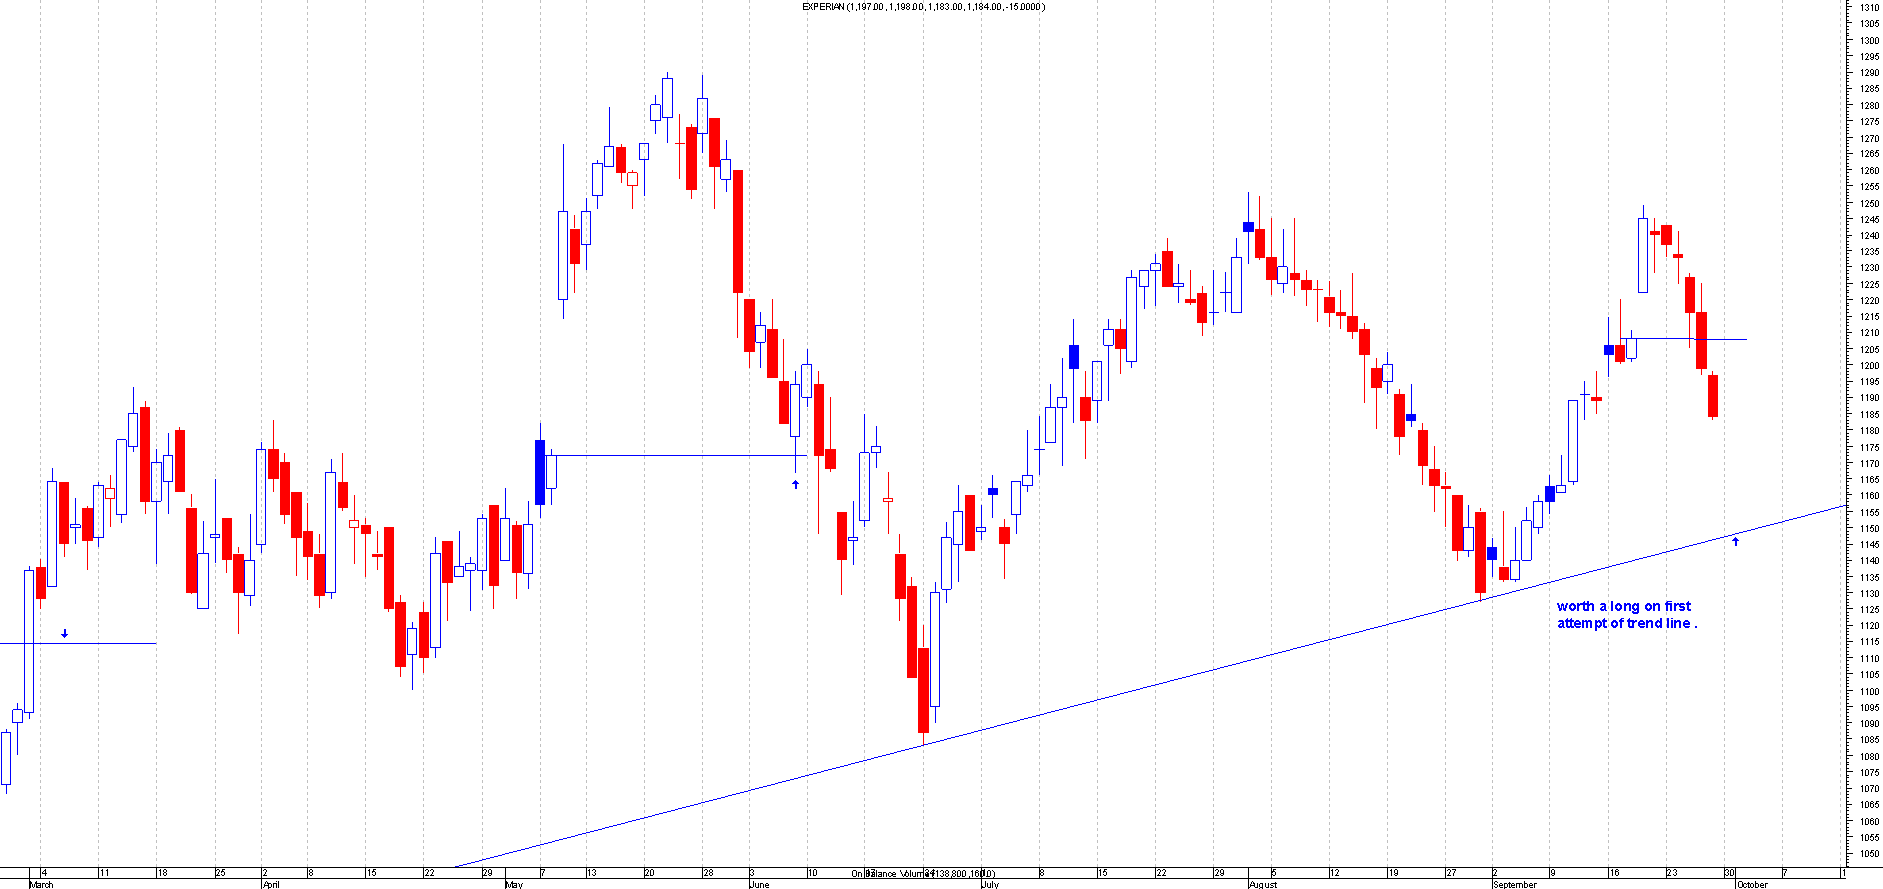
Before: This is the Chart of Experian when I first mentioned this:
After: This bounced of the trend line and pruduced a hammer to back this up. This has now moved over 85 points and should be a free trade.
RPS.L
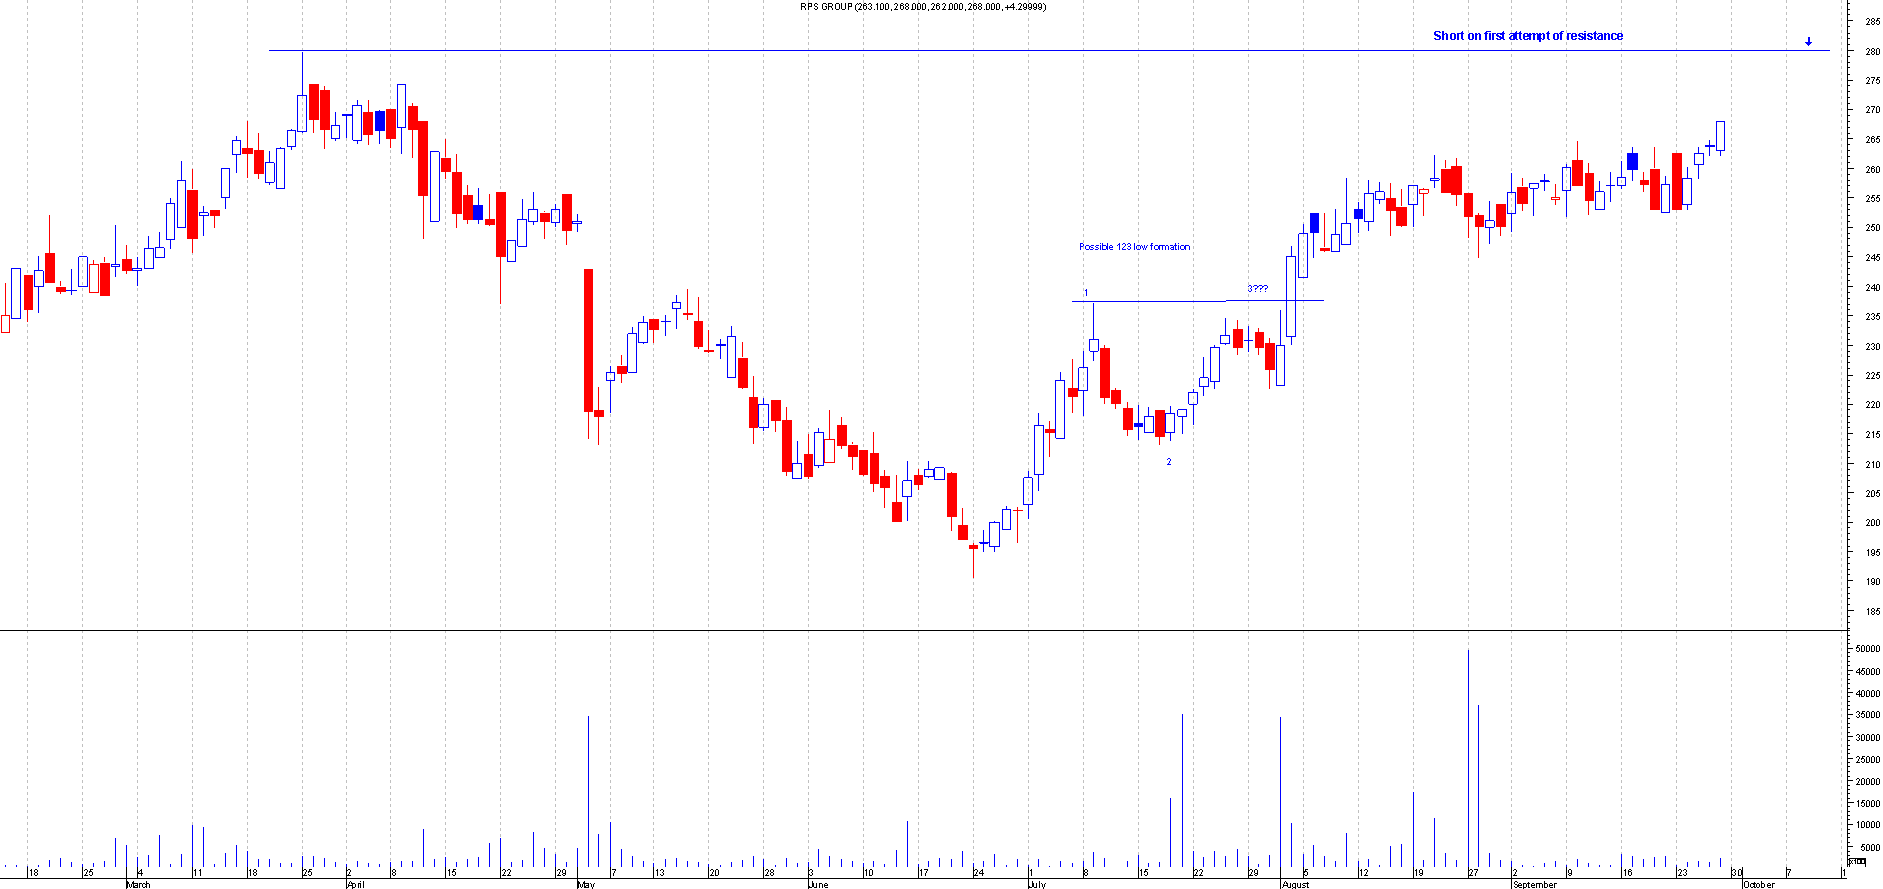
Before: This is the Chart of RPS Group when I first mentioned this:
After: This was a perfect short on a first attempt basis.This went over 22 points in profit. Looking at this chart you can see why the first attempt trade is important. This has since gone higher so you would not have shorted this a second time.
7th October 2013
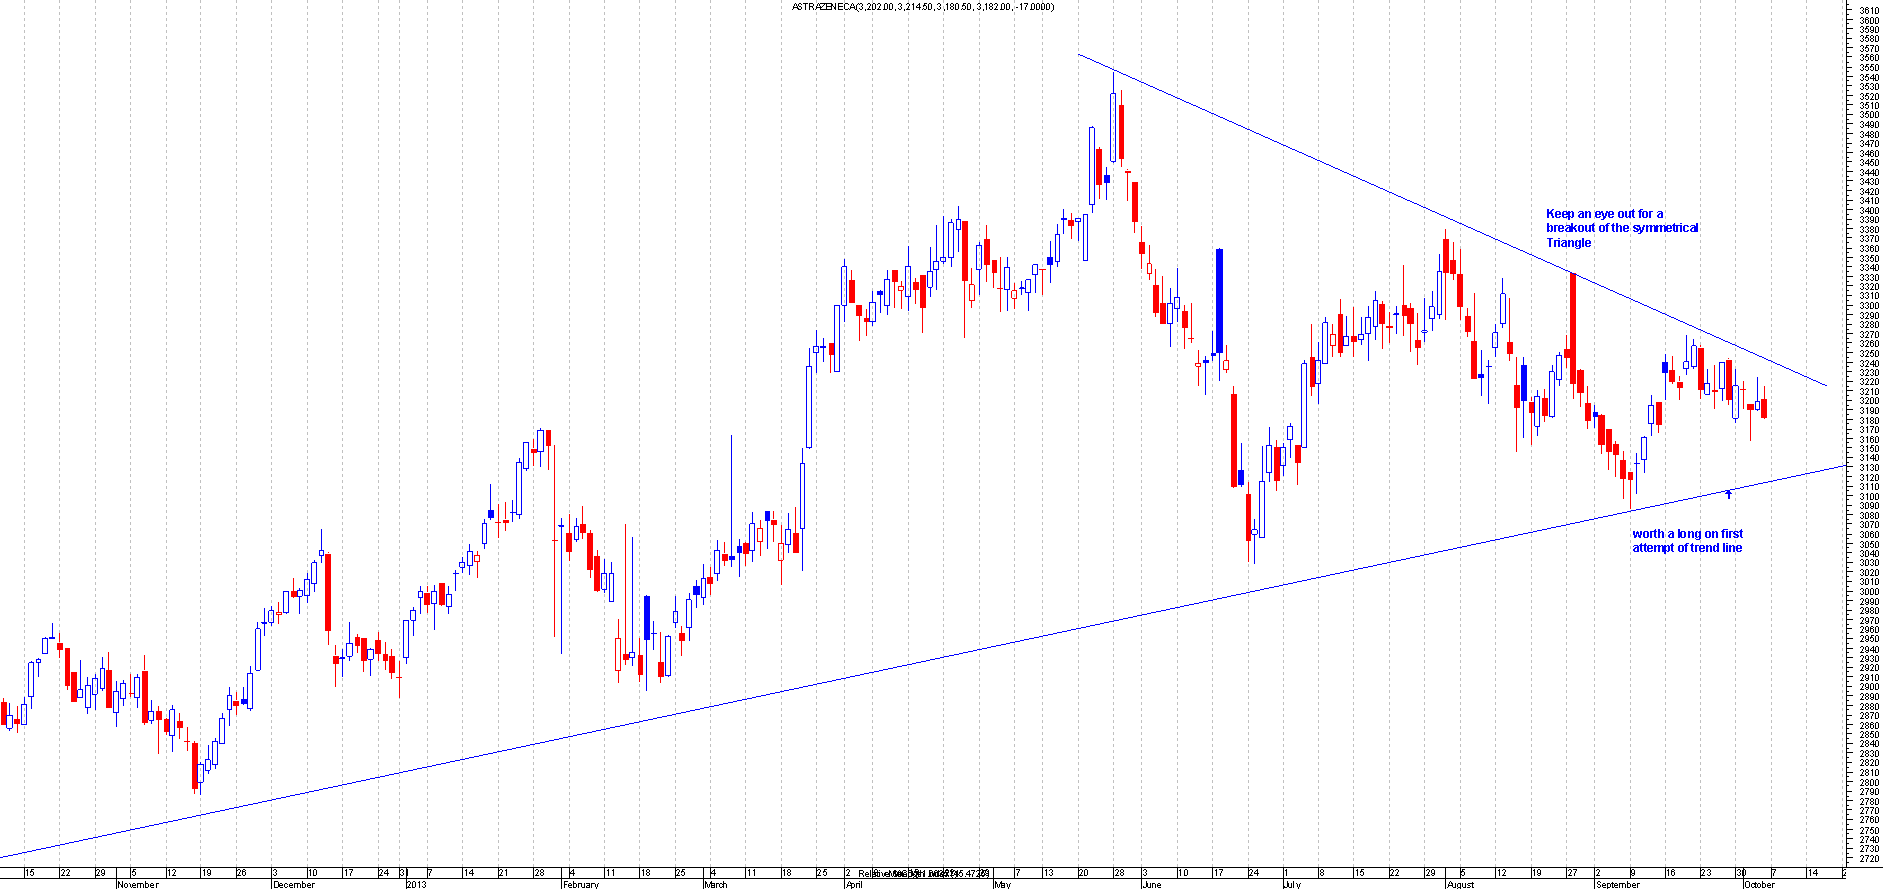
AZN.L
Before: This is the Chart of Astrazenica when I first mentioned this:
After: This bounced of the trend line perfectly and had moved over 100 points.
BABS.L
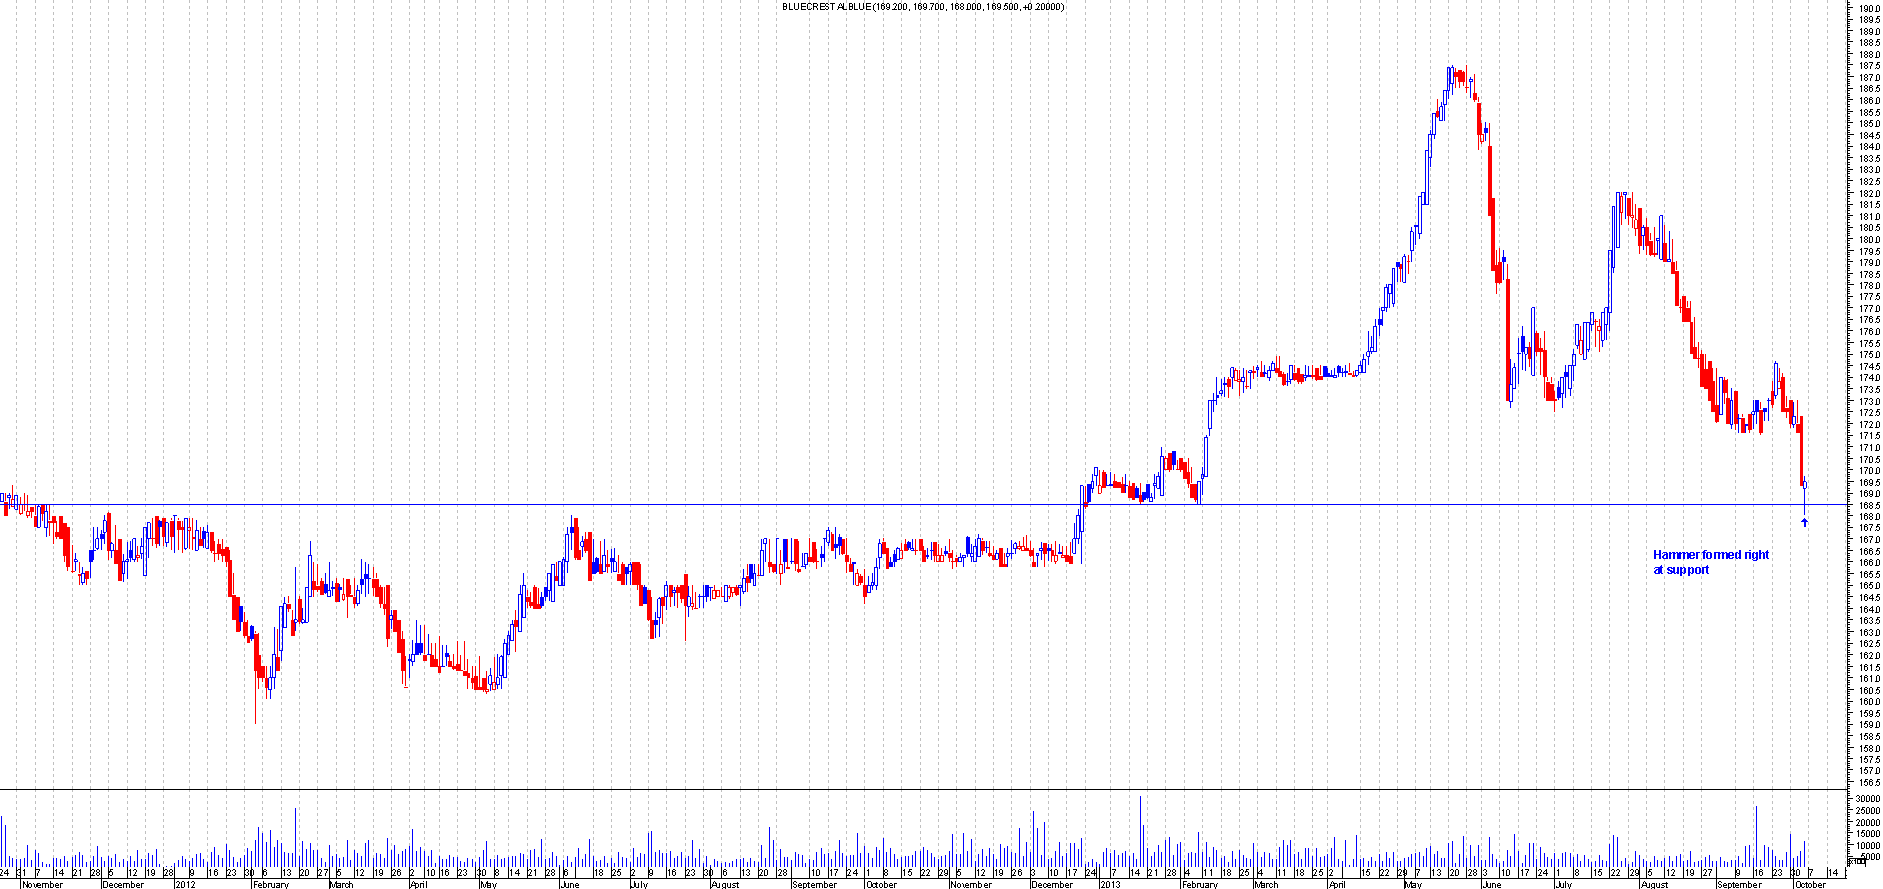
Before: This is the Chart of Bluecrest Alblue when I first mentioned this:
After: Another text book hammer trade.
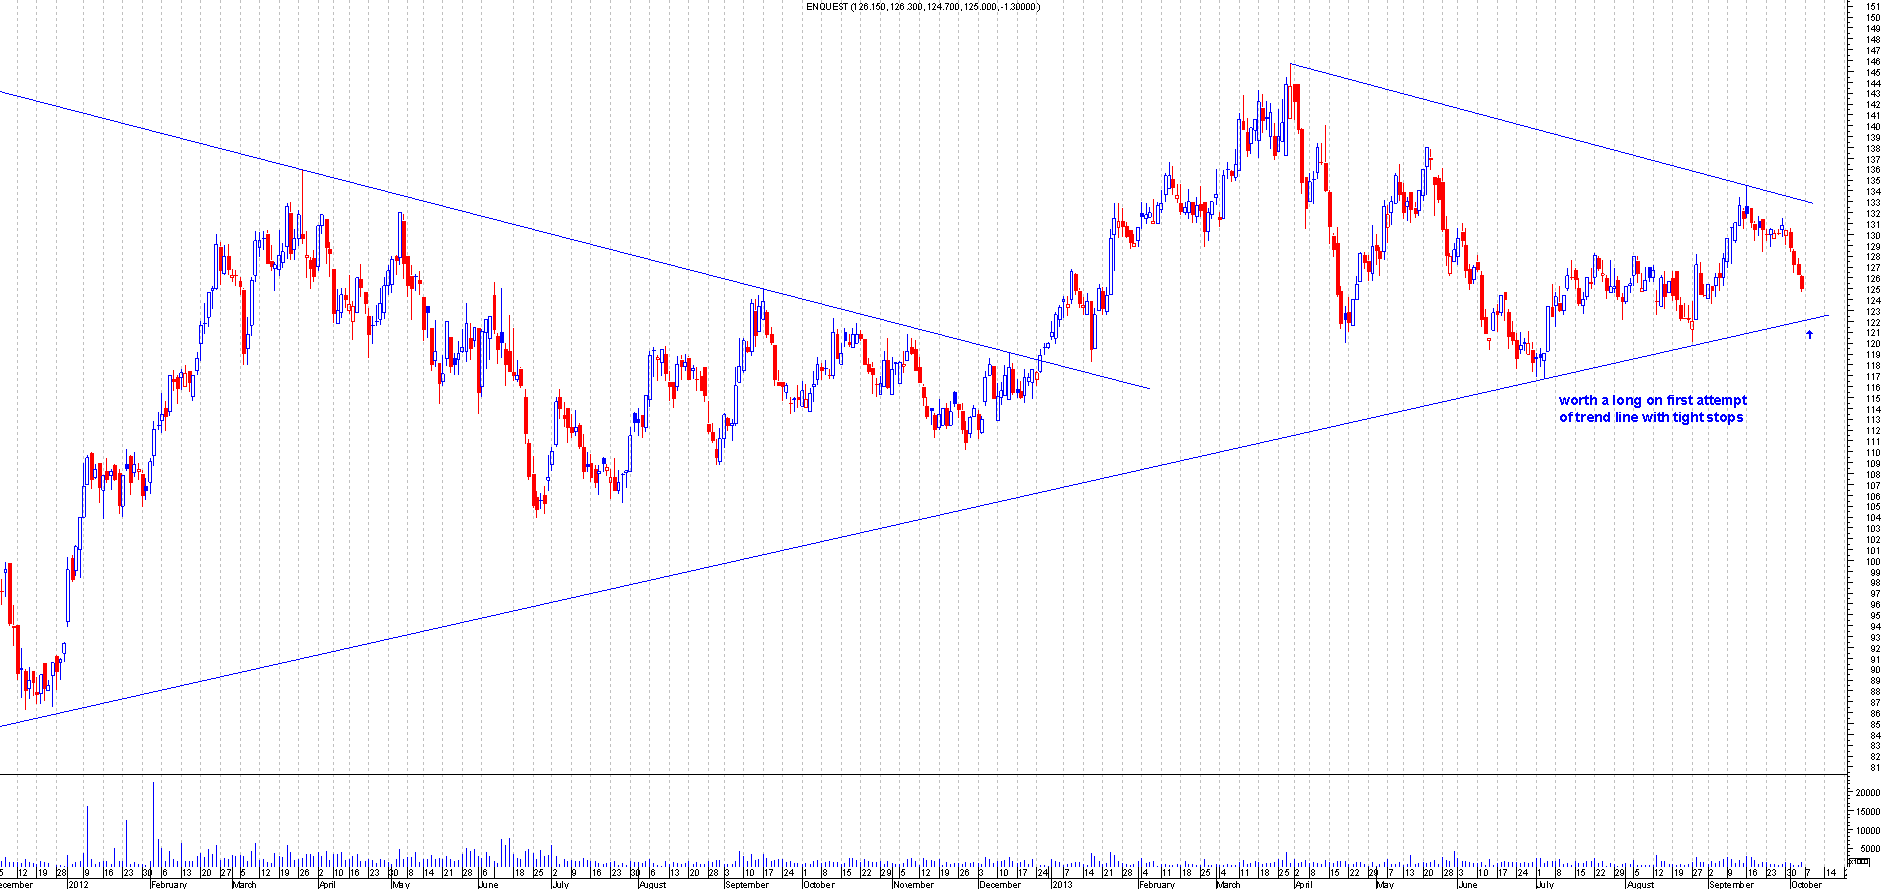
ENQ.L
Before: This is the Chart of Enquest when I first mentioned this:
After: This almost got bailed out but managed to bounce the next day. The stop was only about 2 points so was a low risk trade. This has since moved over 10 points and now attempting to break higher out of a symmetrical triangle.
UEM.L
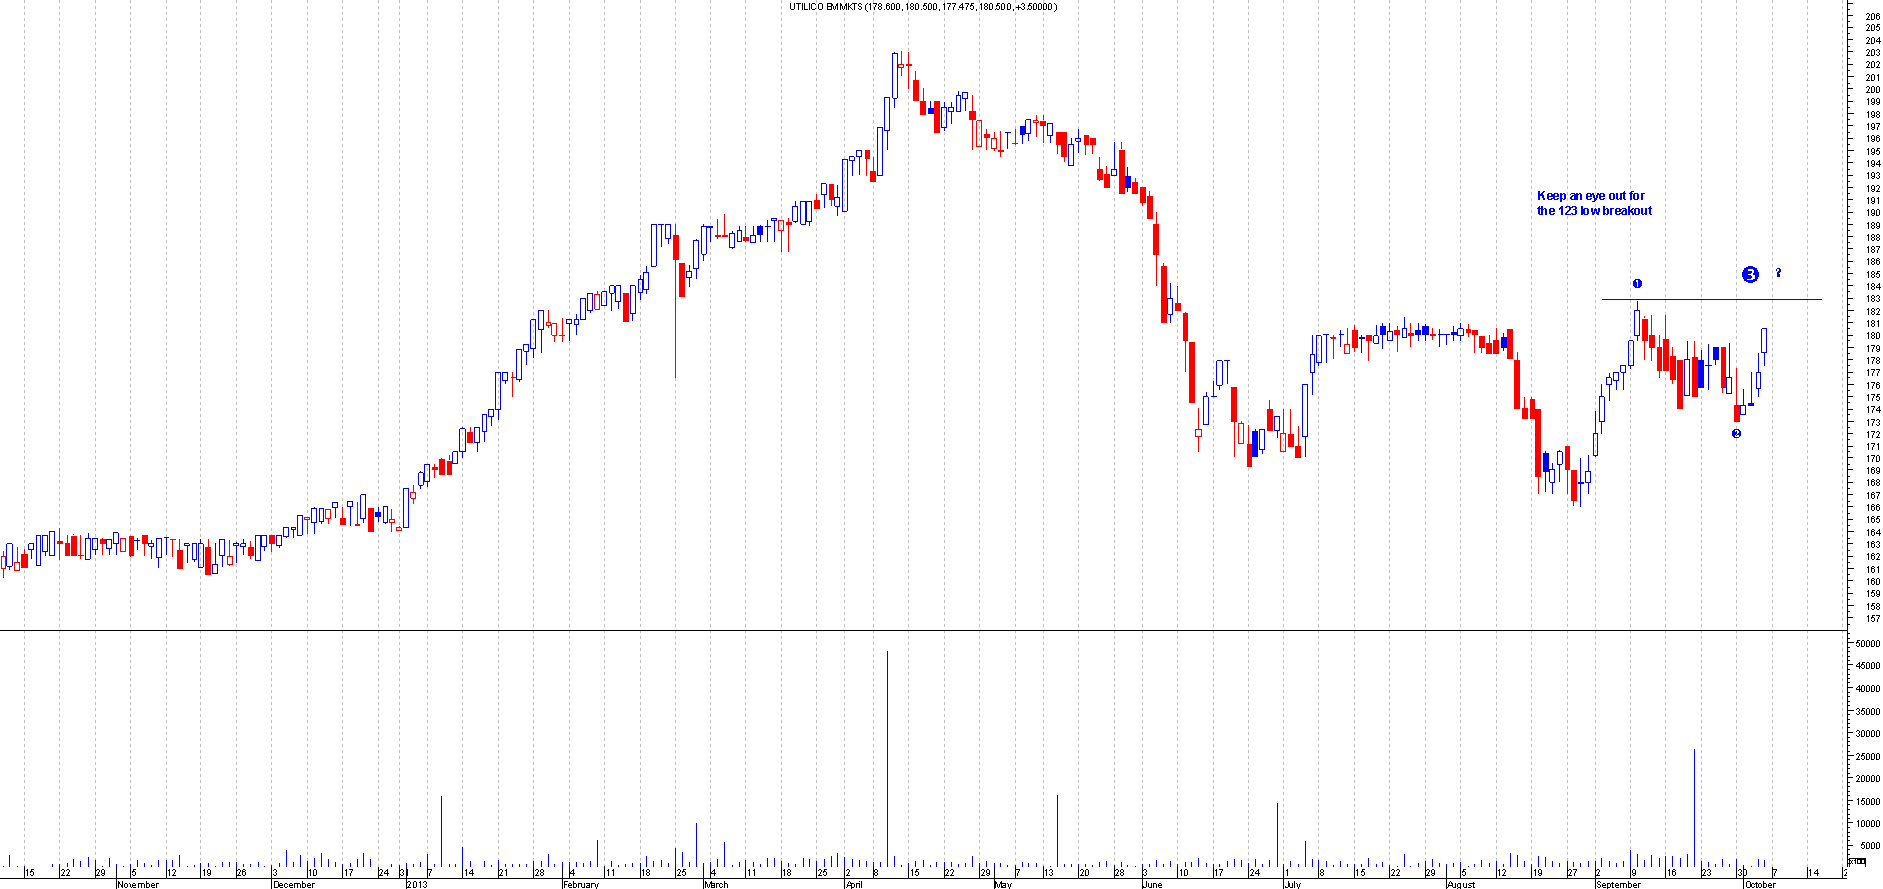
Before: This is the Chart of Utilico when I first mentioned this:
After: This had a nice 123 low formation and had broken out and currently over 6 points in profit.
14th October 2013
ABF.L
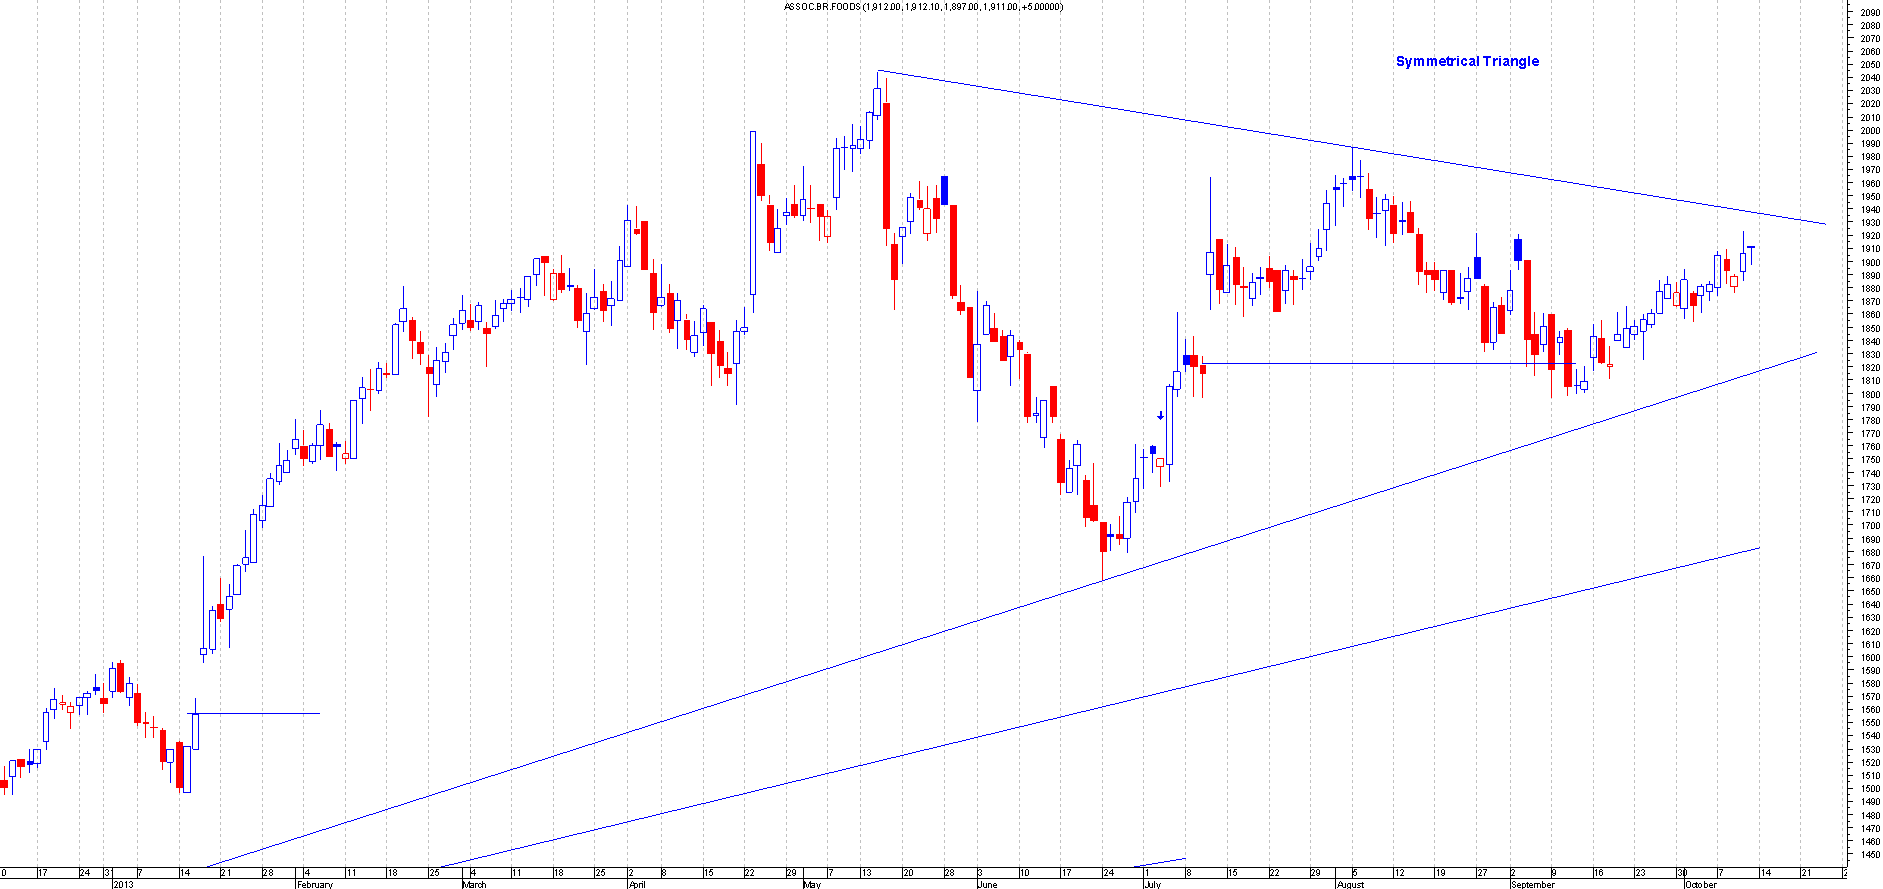
Before: This is the Chart of Assoc BR Foods when I first mentioned this:
After: This broke out of the symmetrical triangle and has moved over 130 points. This shows how powerful a symmetrical triangle breakout can be. This is a free trade now.
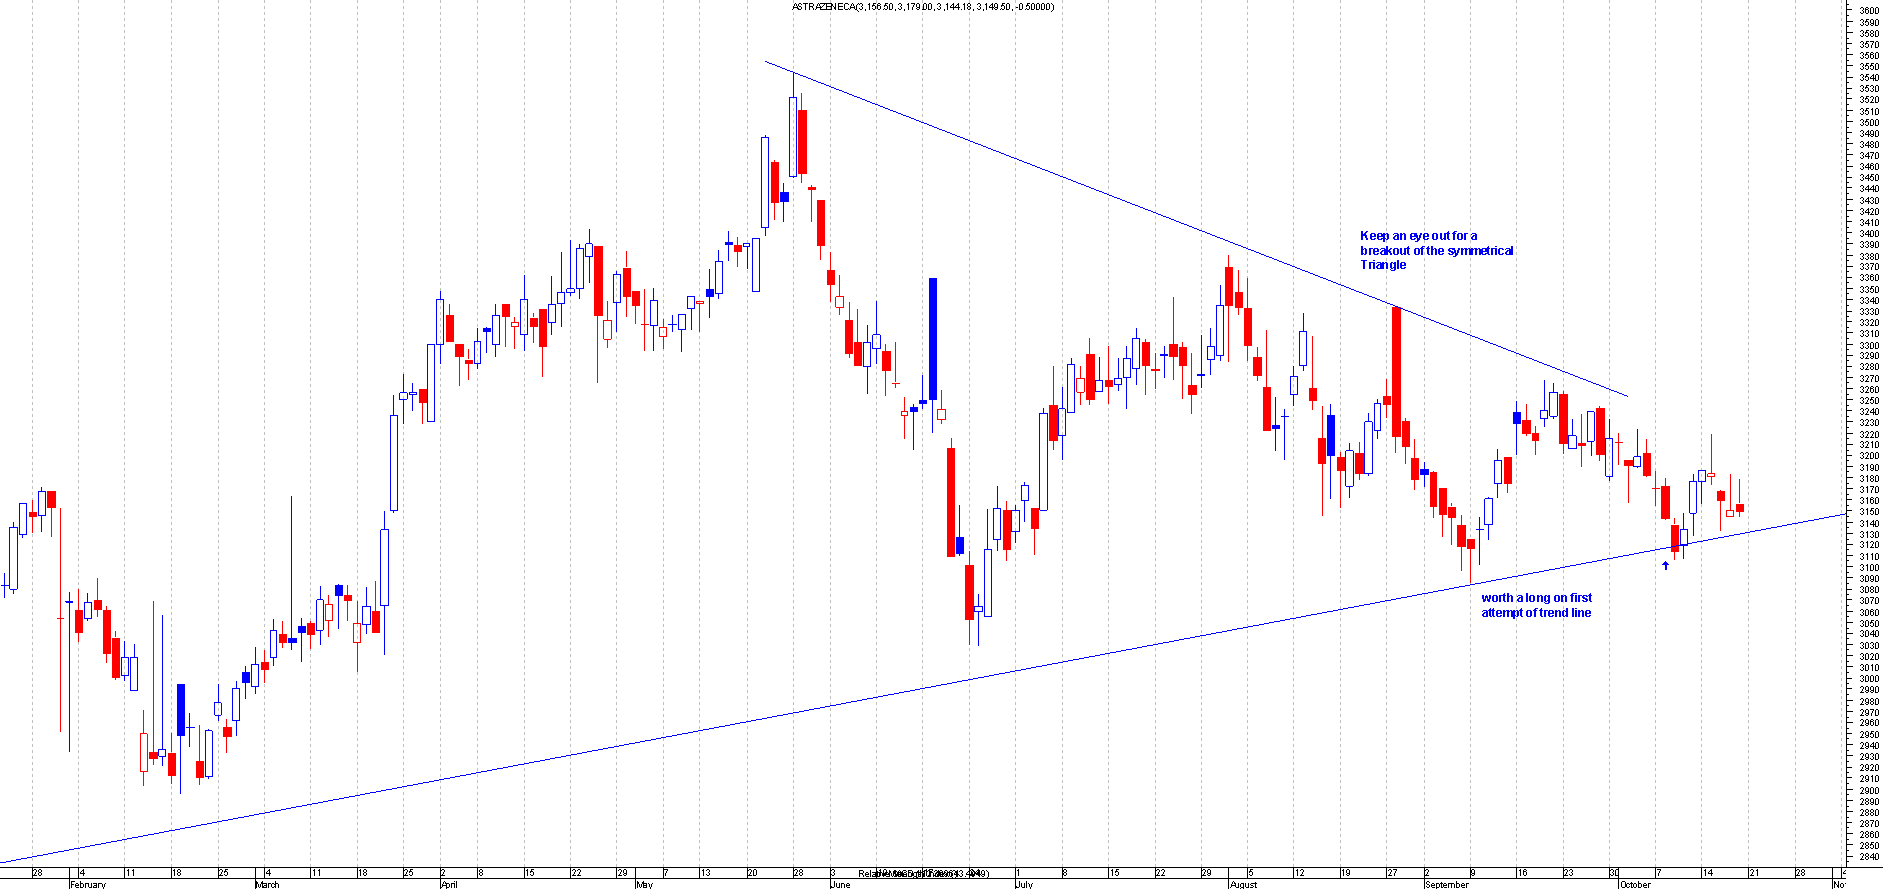
AZN.L
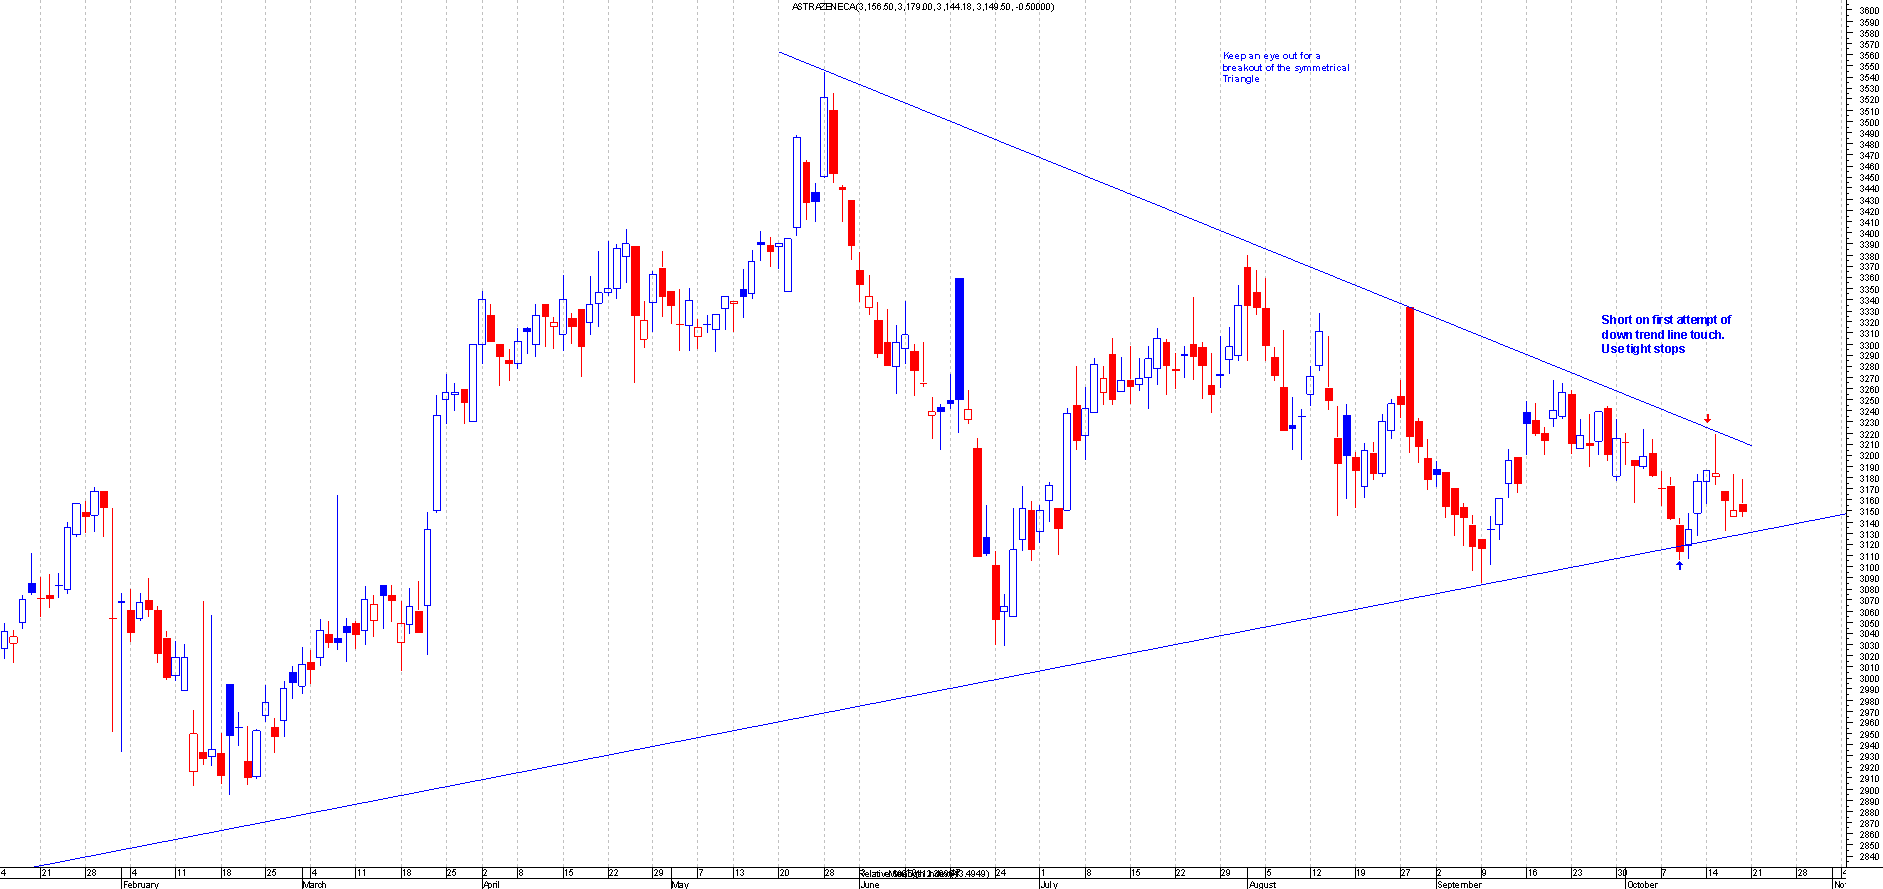
Before: This is the Chart of Astrazenica when I first mentioned this:
After: This was a good example of a first attempt trade. This was a short from the down trend line. Only the previous week I was going long from the up trend line and this shows how quickly things can change in the world of charting. Going short on this trade has netted over 80 points. This is now approaching a critical time as its nearing the apex of the symmetrical triangle so the short was closed. Now this could breakout ether way but I favour a move up. So one to watch.
BT.L
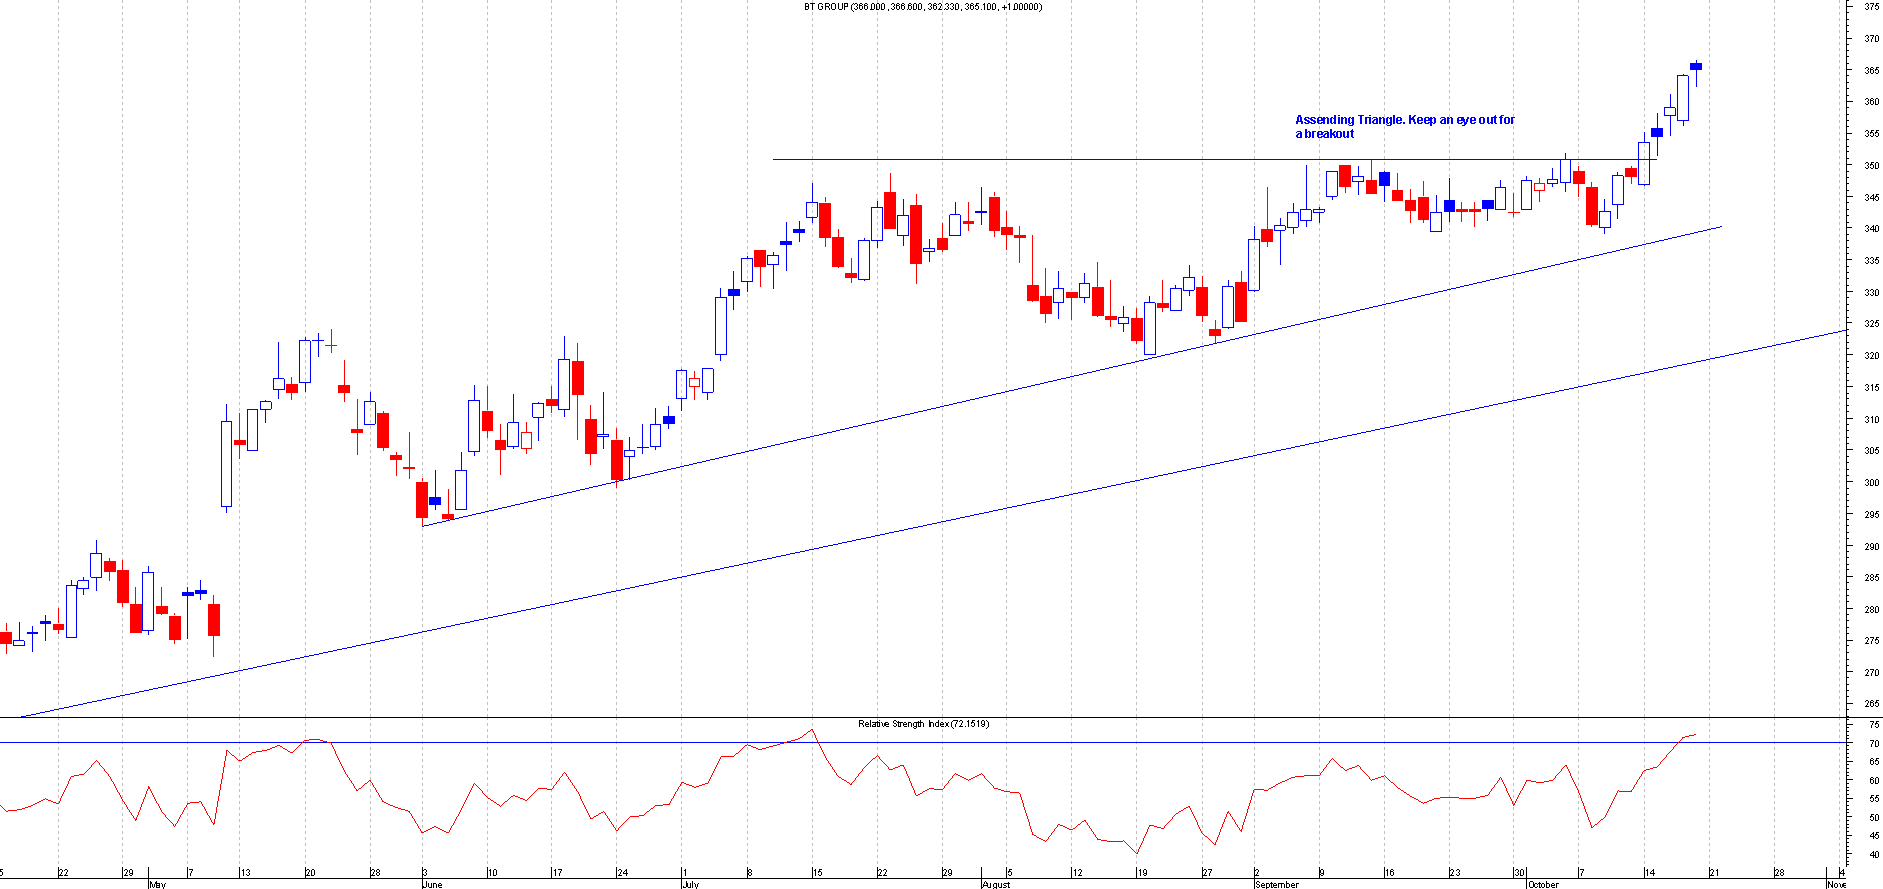
Before: This is the Chart of British Telecom when I first mentioned this:
After: This has broken out of the Assending Triangle and currently over 15 points up.
SHB.L
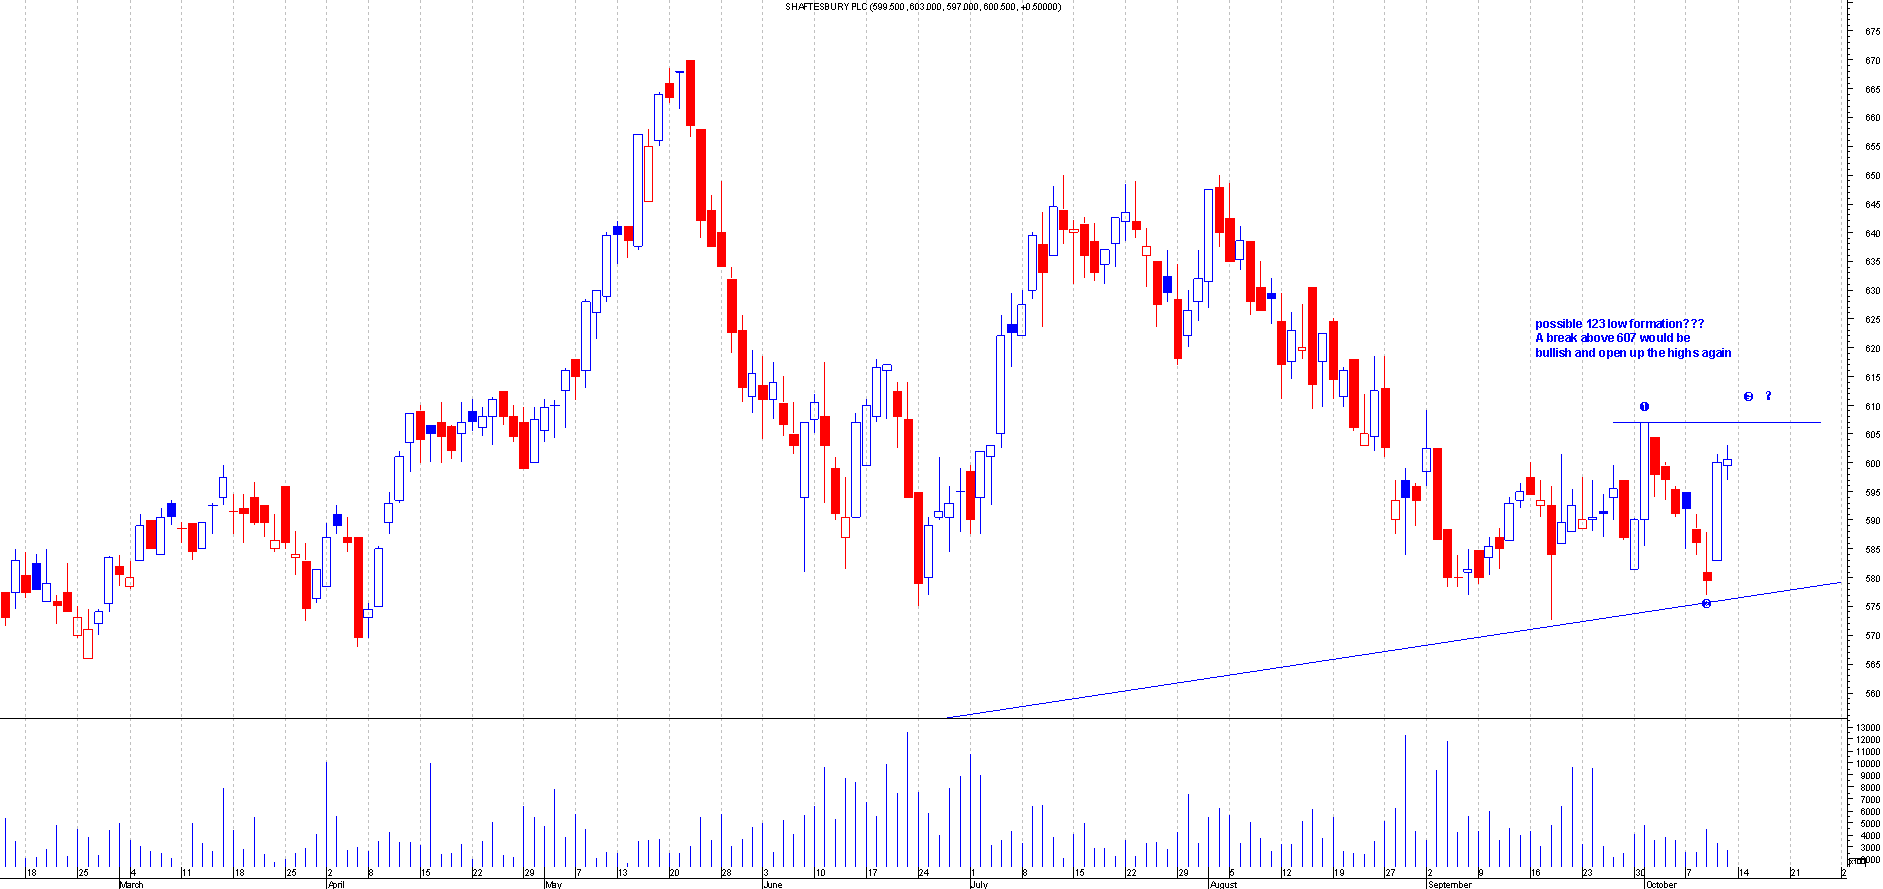
Before: This is the Chart of Shaftesbury PLC when I first mentioned this:
After: This broke out of the 123 low formation and has moved over 20 points. This looks like it may back test the breakout point.
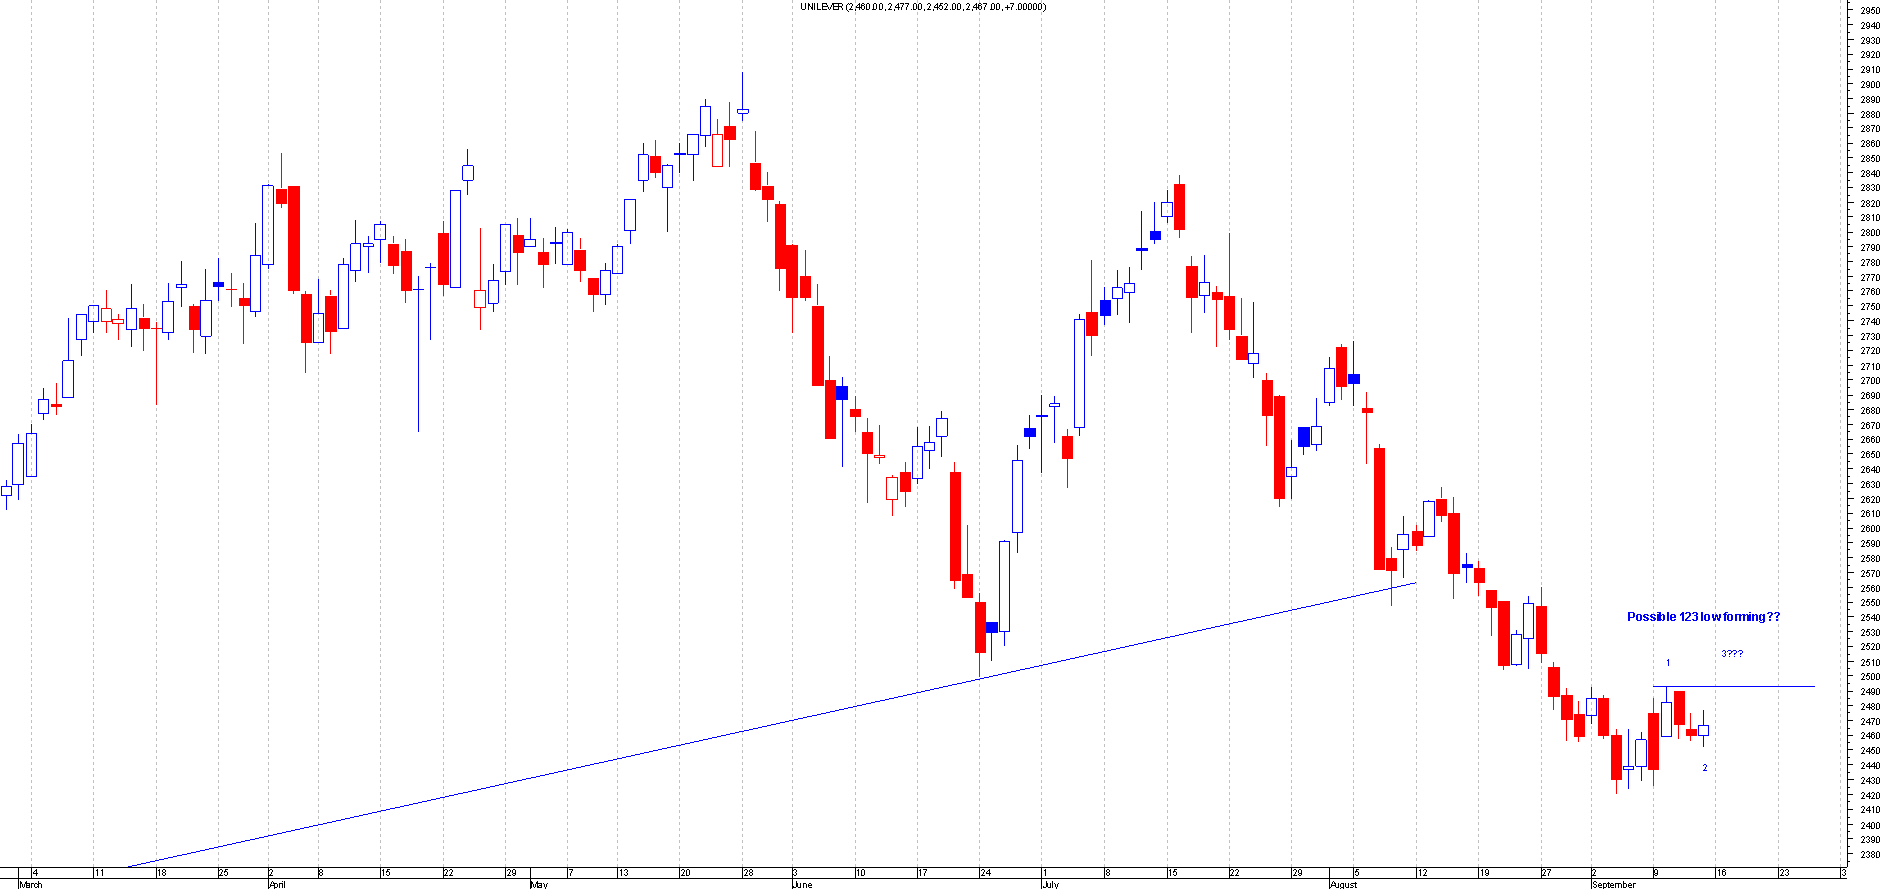
ULVR.L
Before: This is the Chart of Unilever when I first mentioned this:
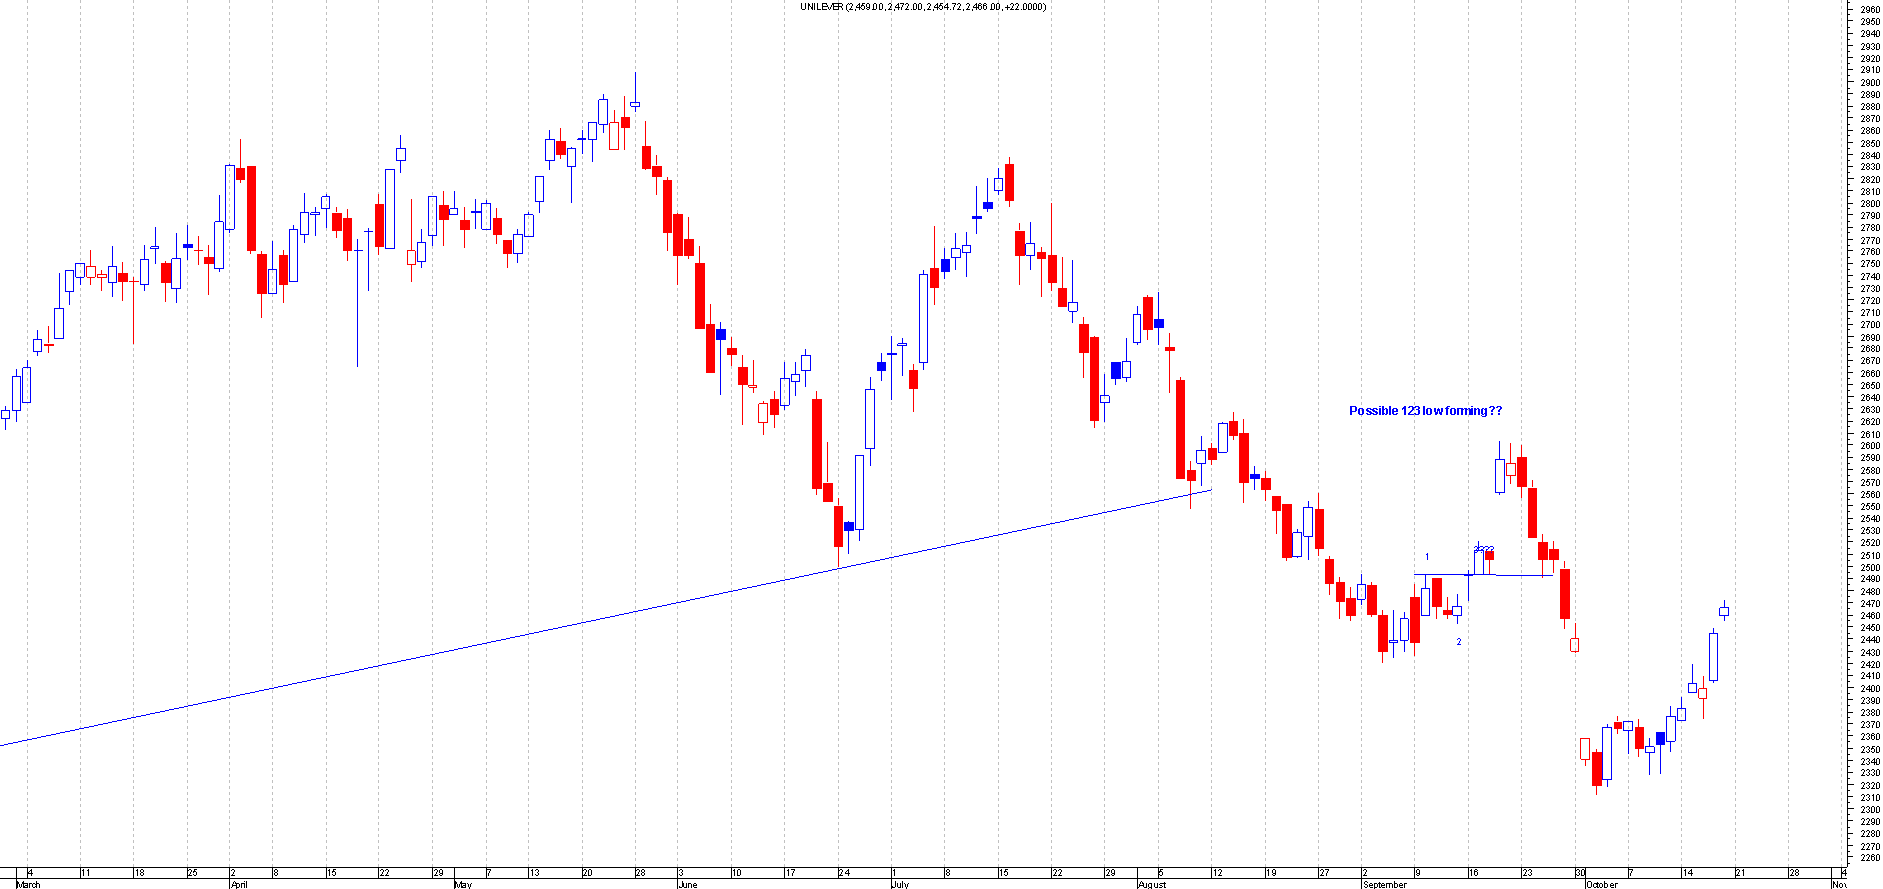
After: This was another 123 low formation on this share as the other one made a nice profit but had failed eventually.
This new trade has now moved over 110 points and has been a fairly reliable share over the last few months to trade. This is now a free trade.
As can be seen from this blog the share tips section has been performing really well. In 6 weeks it has netted over 1500 points. Theres no hindsight trading and the proof is all in the blog as I have shown you the before and after pictures of the tip. If still in doubt then just look through all the share tips in the share tips section. All these tips are available through the premuim section of the website and at £39.95 for a years subcription it's a steal. Where else do you get over 500 tips in a year for a measley £39.95?
I can boast about my tips as it's there for all to see. There's no marketing from us as I believe in my ability to find winners on a regular basis. That is the advantage of ChartsView as I trade regularly and come across great trade set ups for fellow members to see. I post anything I see on the forums generally but it's always advisable to keep an eye out for yourselves on my share tips as I can't always highlight the trades as it happens. I do get a few wrong as well but my stops normally should bail me out for a small loss.
Trading requires discipline and what I've showed you in my blog is not easy to do, it may look easy but I've had years to learn all what I have shown. That's why £39.95 is a steal for great trading ideas and tips. Where else can you get this many tips for so little. Even if this is too much for you why not join our website for free and join the trading growing community. You won't get as much free tips as the premium section but you will have access to other fellow traders tips. You will also learn a lot from some of them. I always post a few tips in there as well.
Its been a whole year since ChartsView was created and time sure has flown by. Hopefully we can have another good year ahead.
So what are you waiting for??
Sign up and and join ChartsVew!
ChartsView Membership - Join Now!
remo


