Chartsview blog
General trading and all to do with financial markets
Share tips from 28th May - 2nd September Part 3
in ChartsView Blog:- Font size: Larger Smaller
- Hits: 12023
- 2 Comments
- Subscribe to this entry
- Bookmark
This is the final part of the Share tips update.
5th August 2013
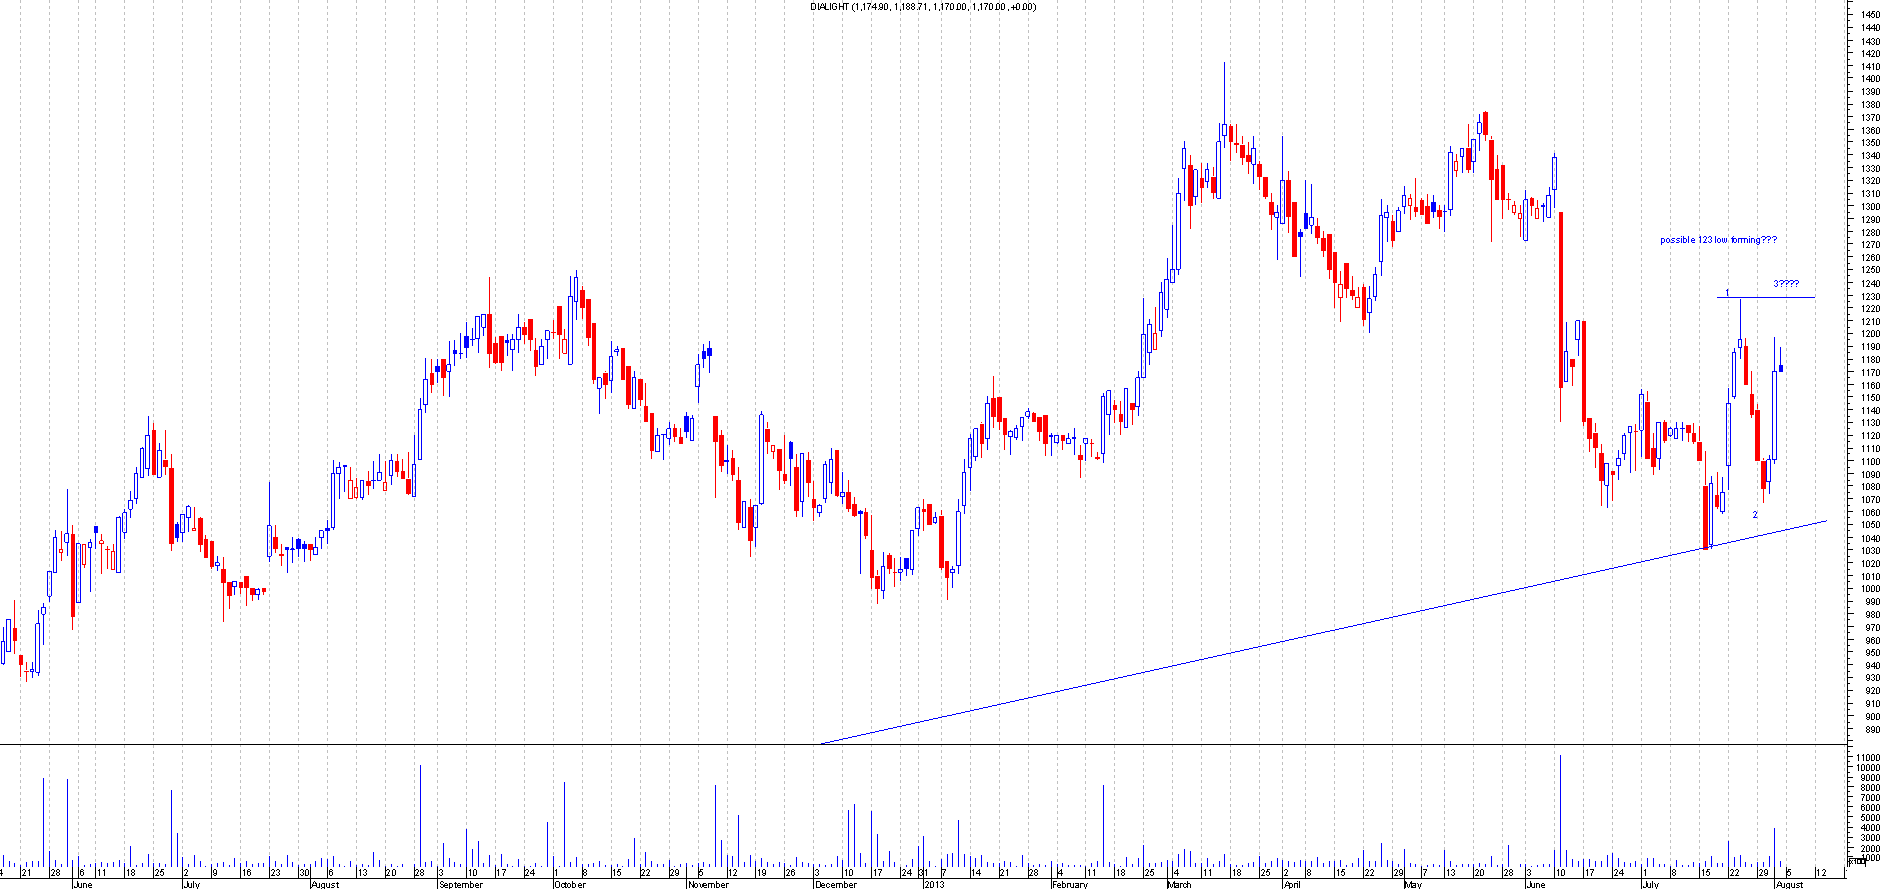
DIAL.L
This is the Chart of Dialight when I first mentioned this:
After : This had a massive range between the 1 and 2 point but never the less worked out perfectly with the 123 low formation.It broke out and even tested the breakout the following day.This went onto move a furthur 190+ points from the breakout point. This is what we love in chartsview.
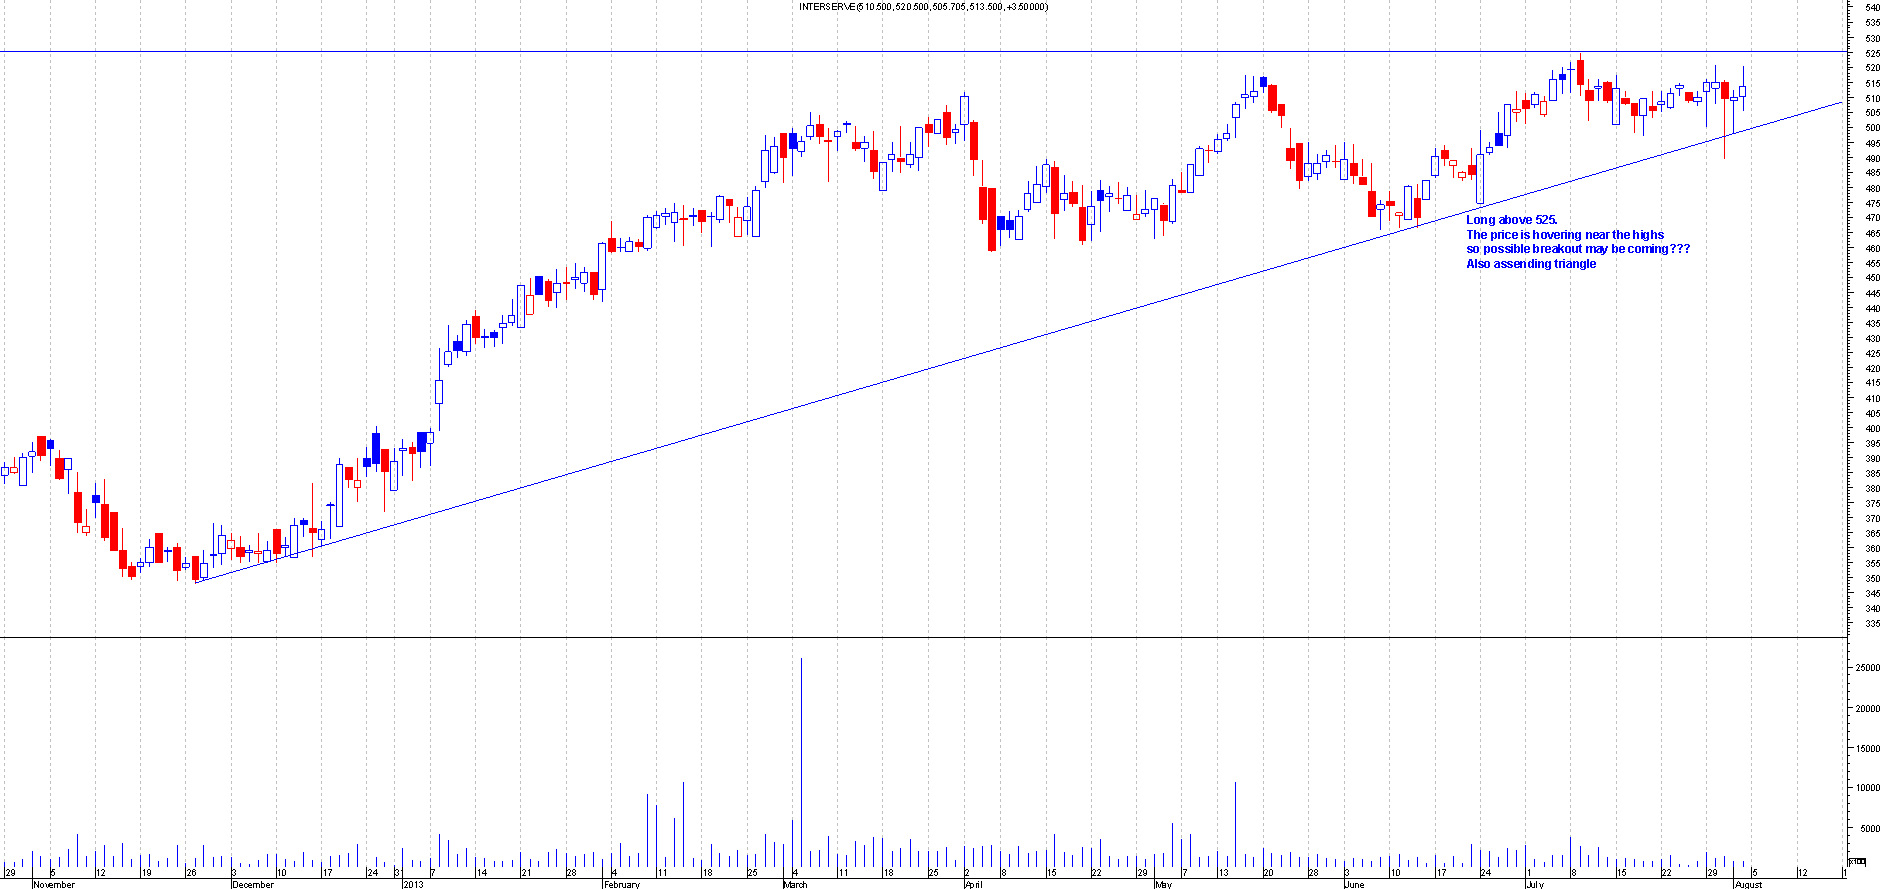
IRV.L
This is the Chart of Interserve when I first mentioned this:
After : This had an assending triangle which broke out nicely.The clues were there by this hovering around the resistance area for a few days weakening the resistance.Once this broke out it moved 50+ points in our direction.
12th August 2013
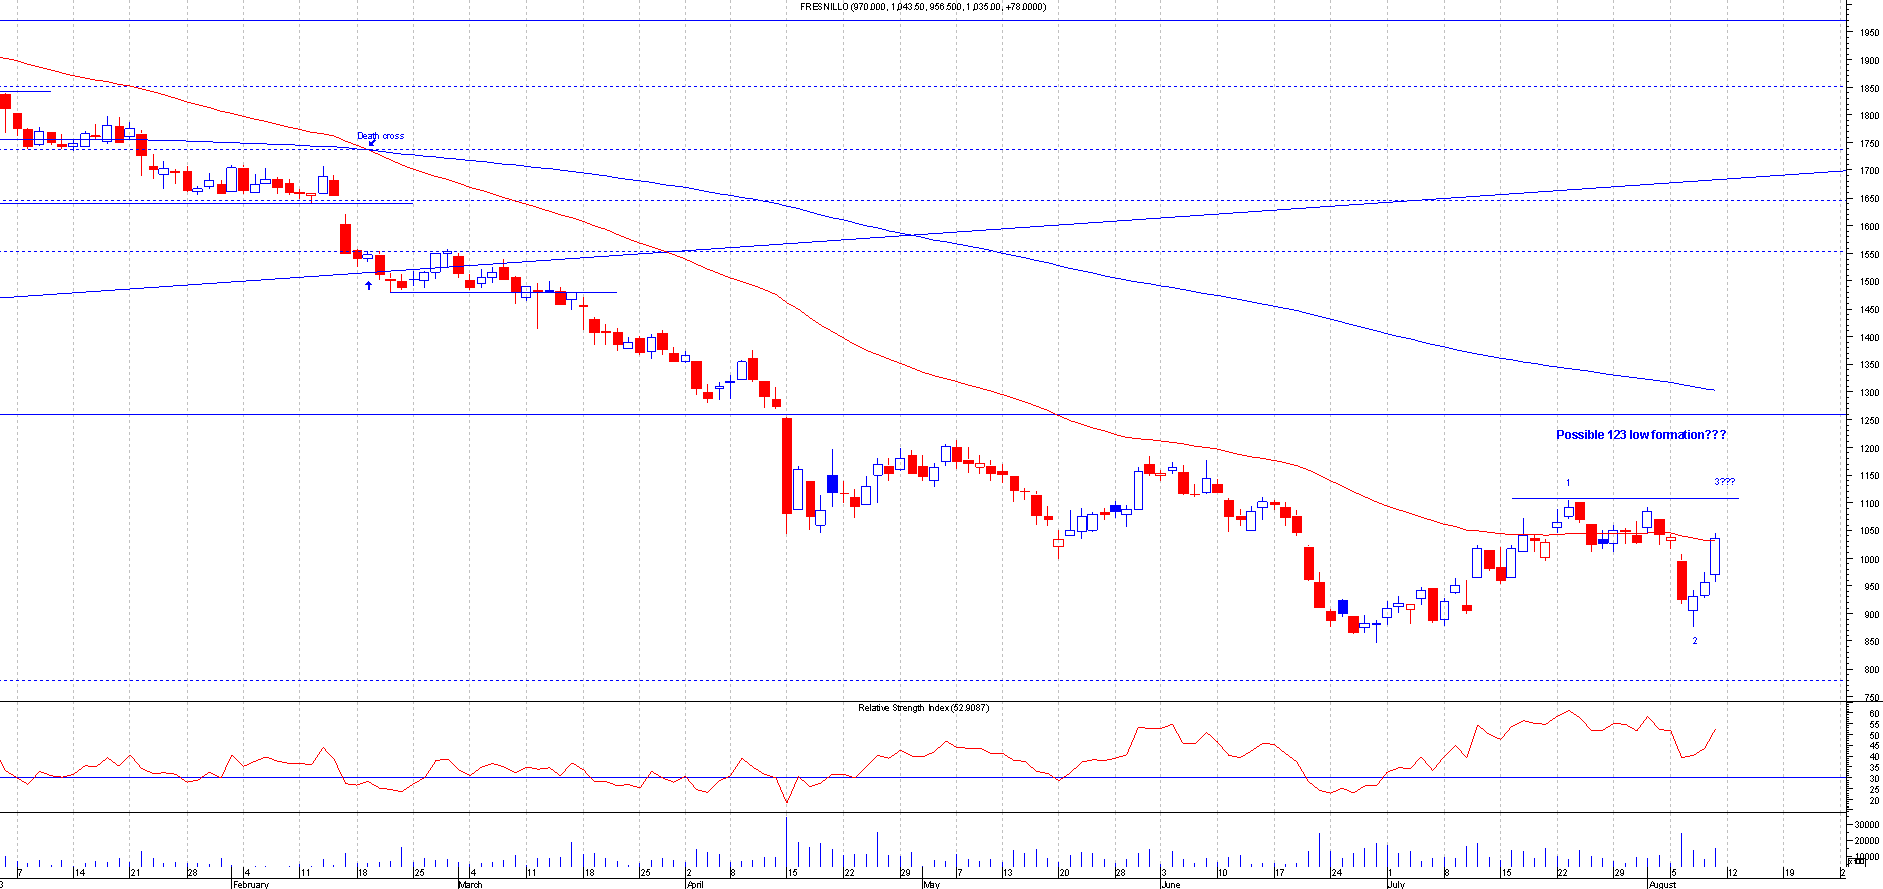
FRES.L
This is the Chart of Fresnillo when I first mentioned this:
After : This broke out nicely and back tested the breakout point a week latter. Good breakouts generally has a habit of being back tested.This went onto making about 240+ points.
19th August
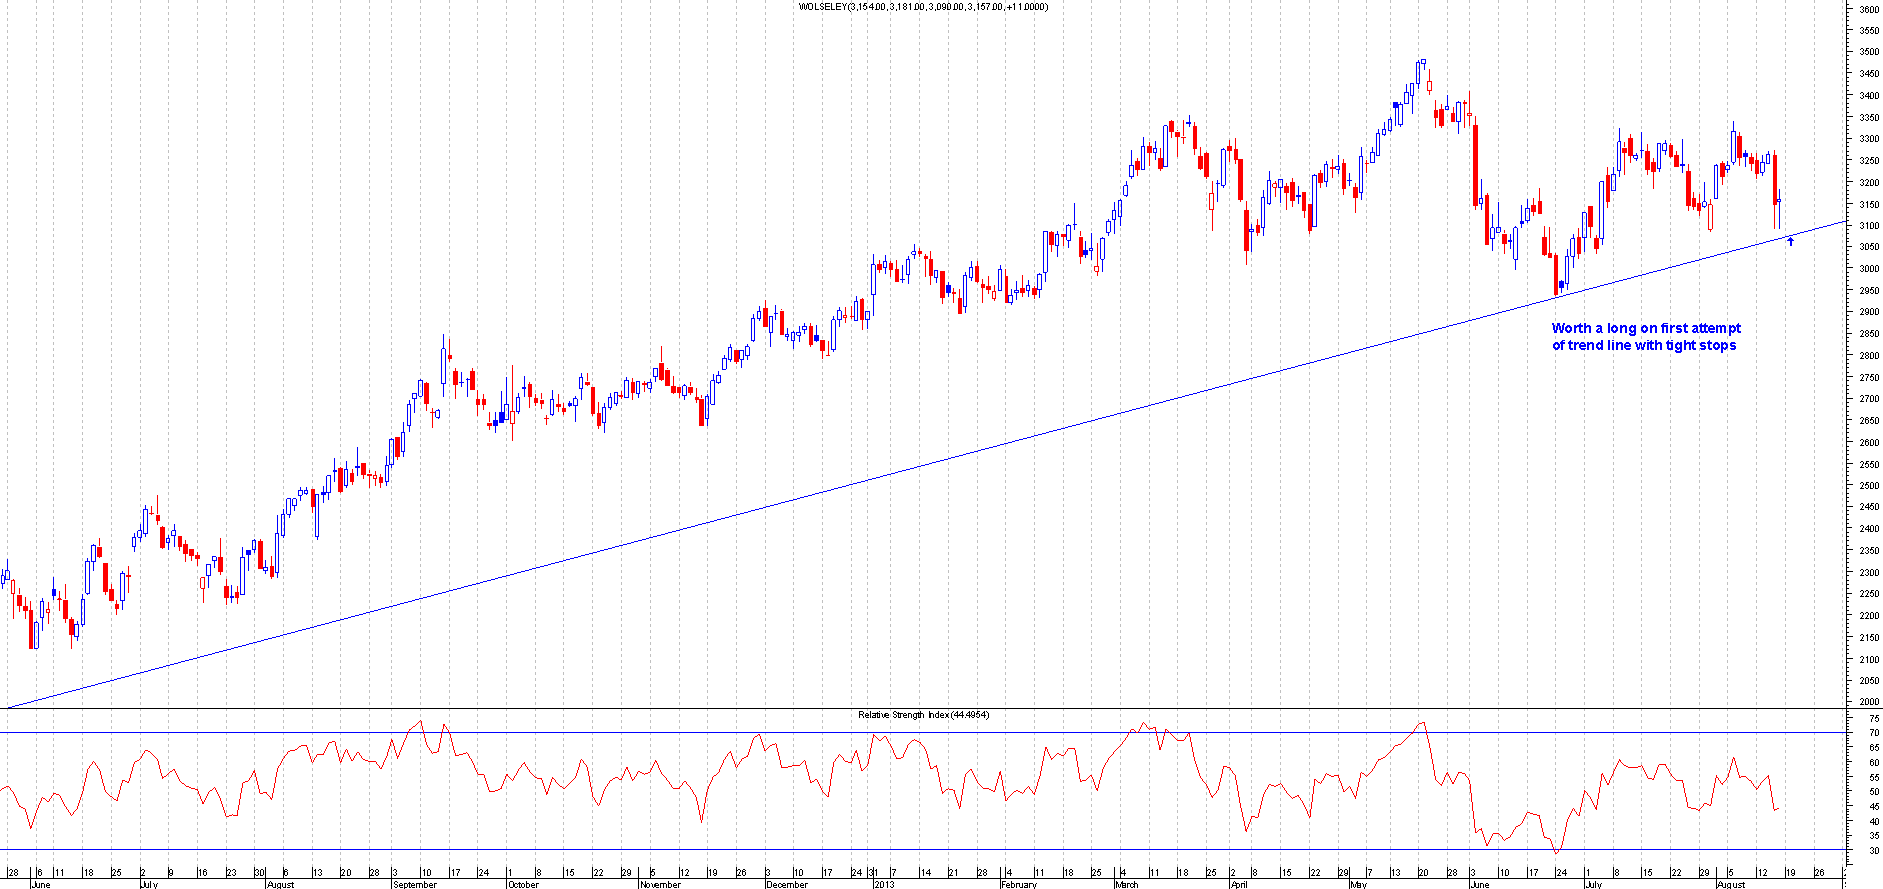
WOS.L
This is the Chart of Wolseley when I first mentioned this:
After : This bounced of the trend line and pruduced a hammer formation.This is currently 300+ points up.
27th August 2013
GFS.L
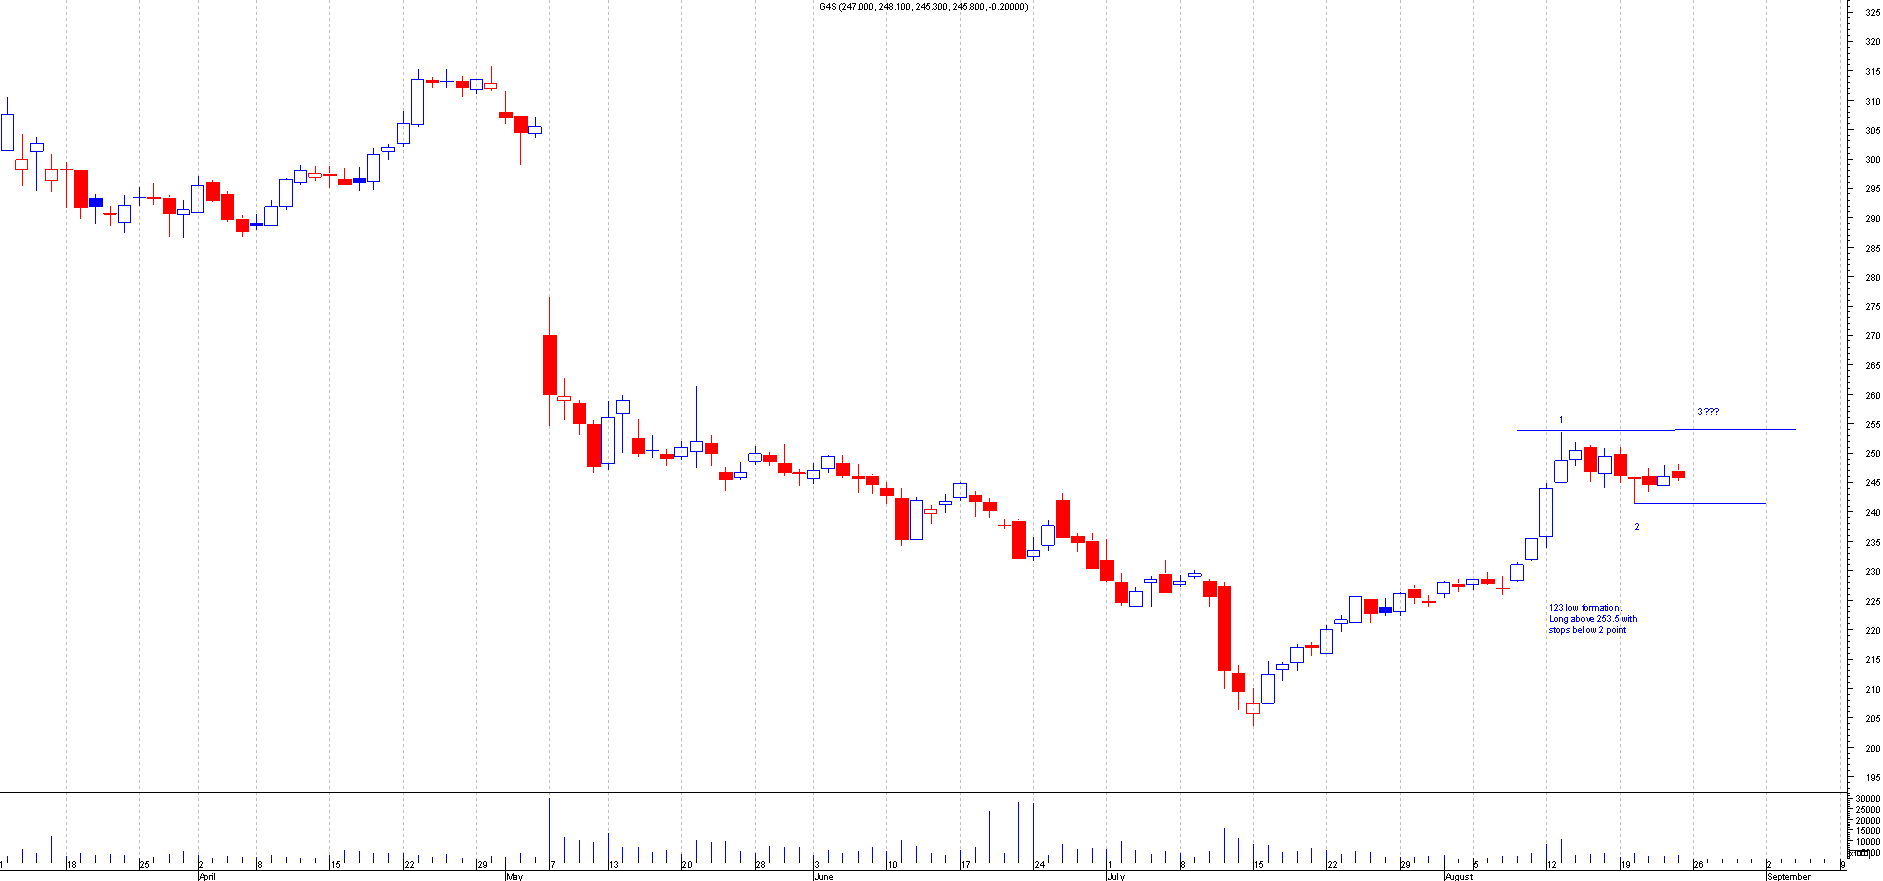
This is the Chart of G4S when I first mentioned this:
After : This has recently just broke out and now is testing the breakout point. This did move 10+ points from the breakout point.
HOCM.L
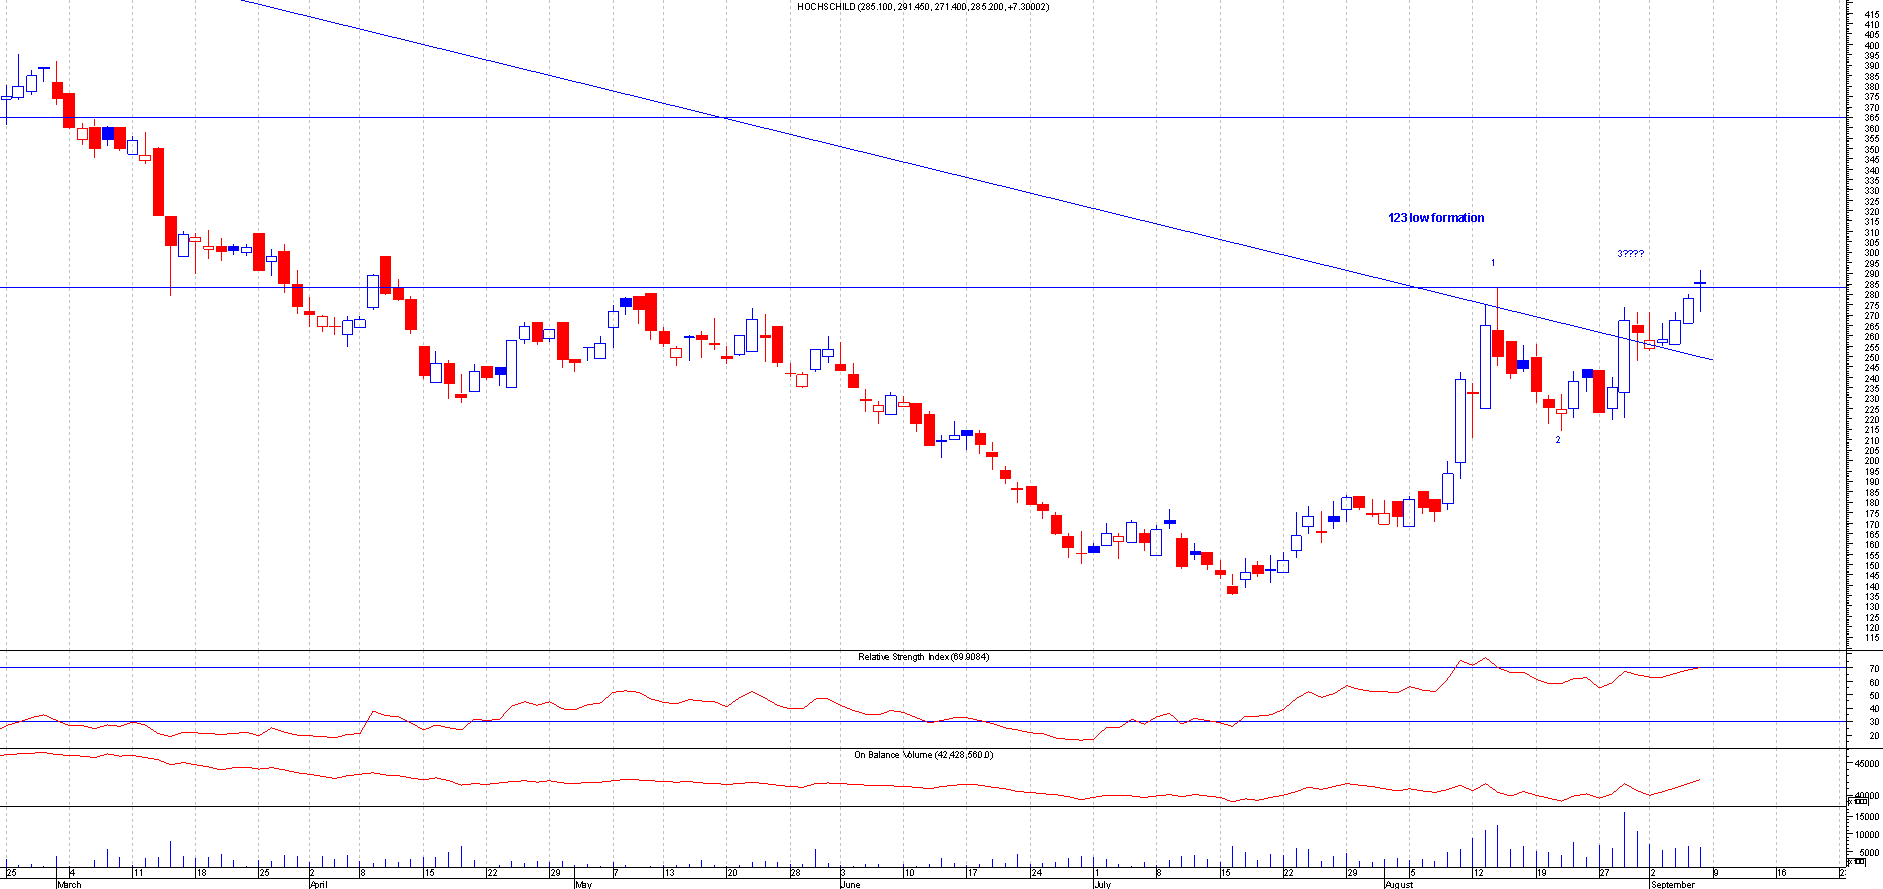
This is the Chart of Hochschild when I first mentioned this:
After : This broke out of the trend line and then went onto break the 123 low pattern. This is still evens currently as its early days yet.
IMG.L
This is the Chart of Imagination Technology when I first mentioned this:
After : This has just recently broke out and now is testing the breakout points.If it holds it could go higher.
2nd September 2013
BLND.L
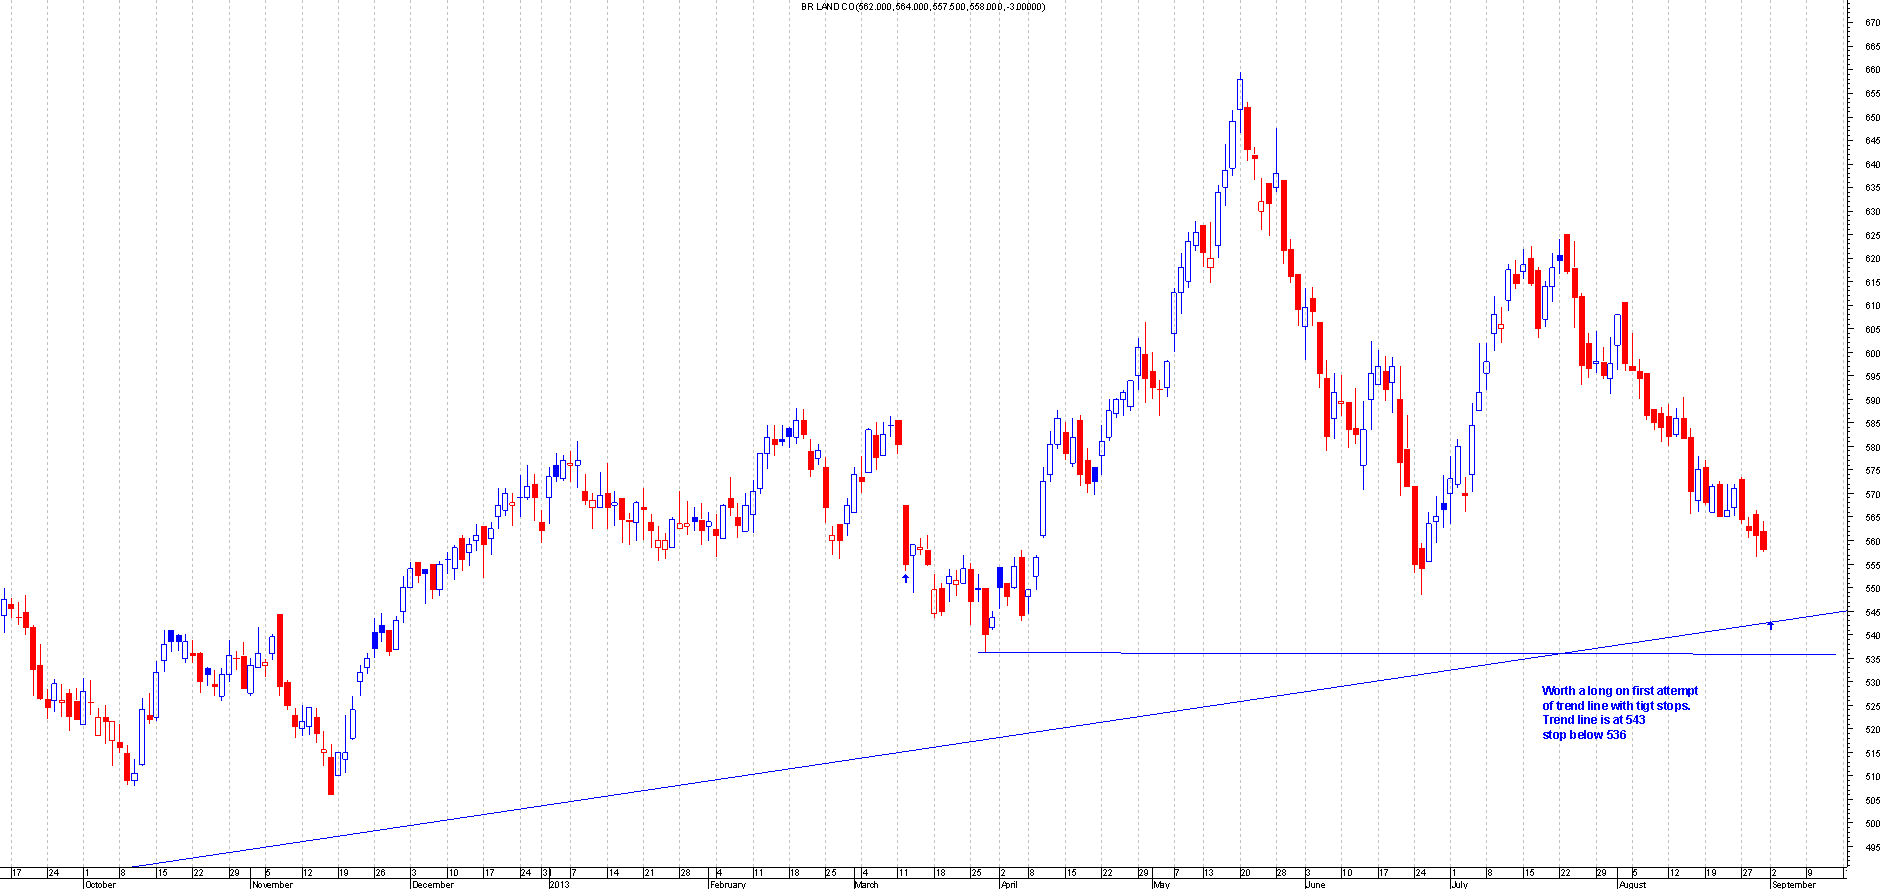
This is the Chart of British Land when I first mentioned this:
After : This hit the trend line perfectly and bounced of it on the first attempt. This is currently over 10+ points .
TCY.L
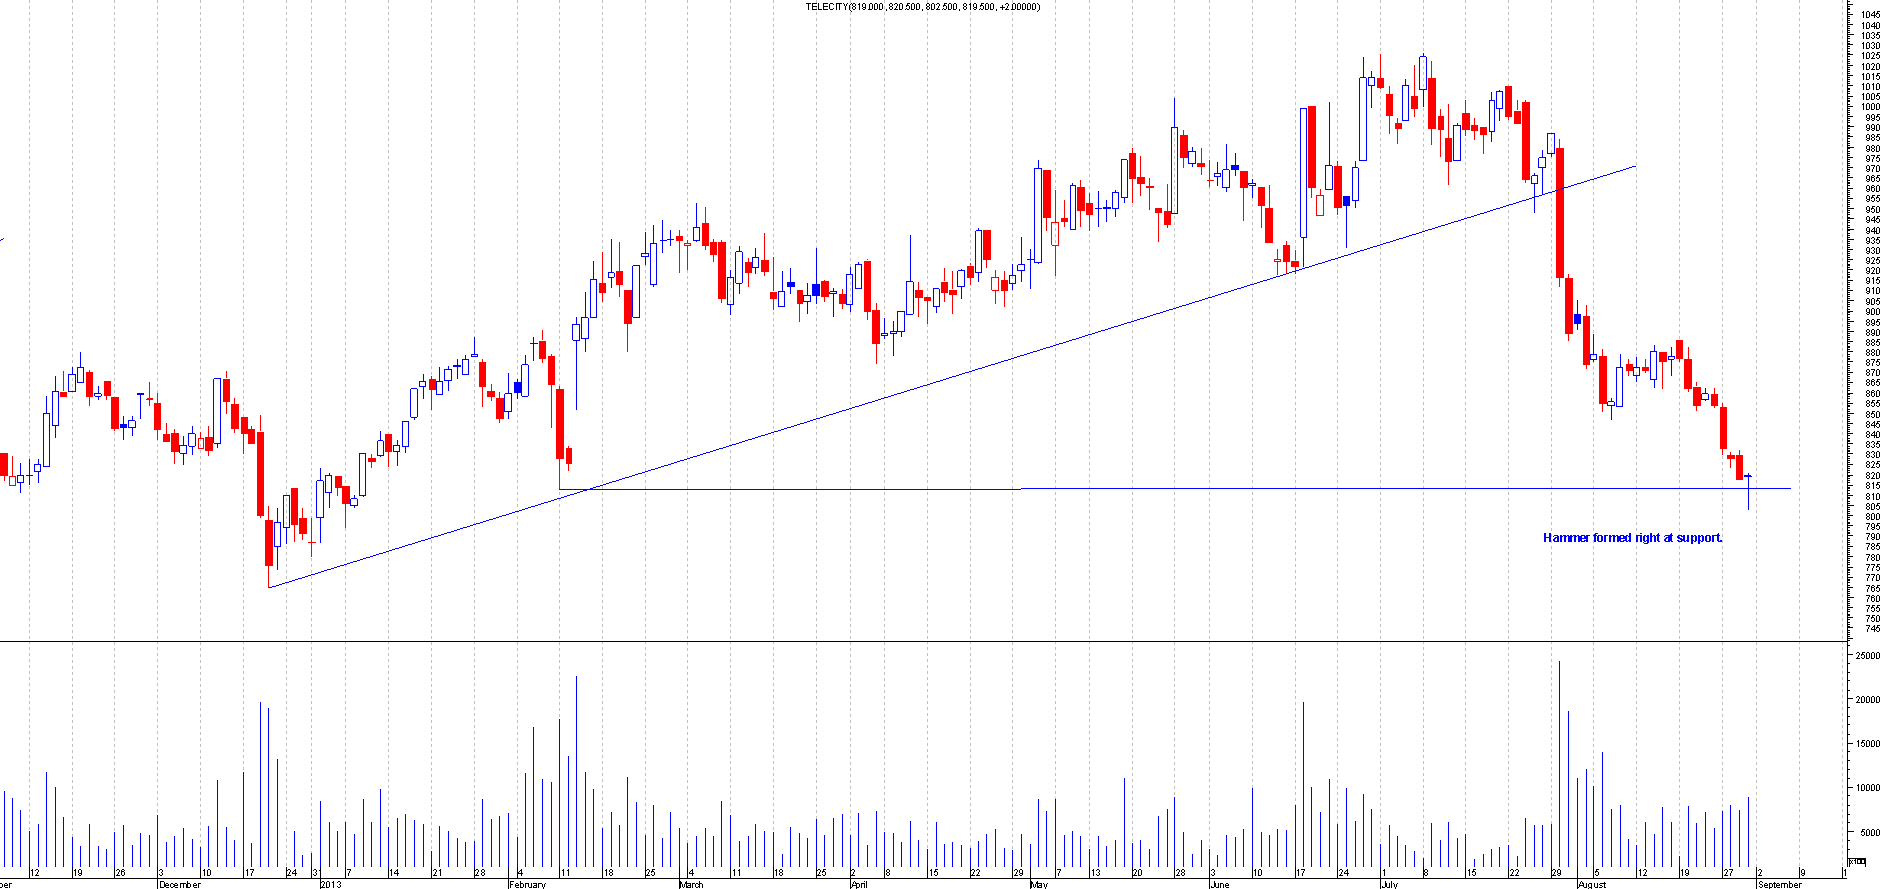
This is the Chart of Telecity when I first mentioned this:
After : This had a nice hammer formation on this and this came right at support.This has since moved 40+ points.This now needs to get a 123 low formation to go a lot higher.
Finally i have come to the end of my blog. This took a long time to get too. I hope you have found this useful .
Thats me done for a while now . I need a holiday after this blog.
have fun in trading.
Comments
-
 Wednesday, 11 September 2013
Hi tintin
Im glad you made some money. That is the idea of this game after all
Thanks mate .I hope you can learn from them as i tried to lay it out so that its clear to see .No hindsight trading from me Thats my moto


Only thing i have left out are some losing trades that were in the share tips section but the losses would have been small due to the tight stoploss that i use and recommend .There was not that many losing trades

 The key to success is controlling the losses.












Remo, alot of work has went into that mate and I for one appreciate it, I've had quick scan through tonight -well impressed. It shows me (relatively new small time trader) your tips in action, before and after charts are brilliant and they are explained in laymans terms I liked the look of a couple of the tips at the time and made a few bucks so thanks again, I will study them in more depth later to hopefully to learn even more.