Chartsview blog
General trading and all to do with financial markets
Share tips from 28th May - 2nd September Part 1
in ChartsView Blog:- Font size: Larger Smaller
- Hits: 10904
- 0 Comments
- Subscribe to this entry
- Bookmark
This is my update on the share tips that have been given on chartsview.Ive been real busy with the site so have not updated for a long while so this blogs is going to be rather large. Since may 28th 2013 there have been a lot of share tips.Ive not put all the tips that have been done on here as its really difficult to find all the charts from back then and i have only managed to find charts for about 29 companies. There have been a lot more than this but to put all of them down will take me days to find yet alone to write the blog. There have been some losses as well but since i adopt stoploss on all my trades they would have been minimum loss. I have not put the loss trades on here as there was not that many and again to find them is tricky. So i have only listed the ones that i have managed to find.
This blog is going to be done like the previous blogs where i show you the before picture and after picture. This is the best way to show this as its easy to follow and as many know i dont do hindsight trading like many so called pros out there. This blog will show this . I will put the dates on the companies tipped so as members can check when the tips were done so that you know its the real deal. Like i have said there is no hindsight trading . Its all done by pure charting.
here goes.
28th May 2013
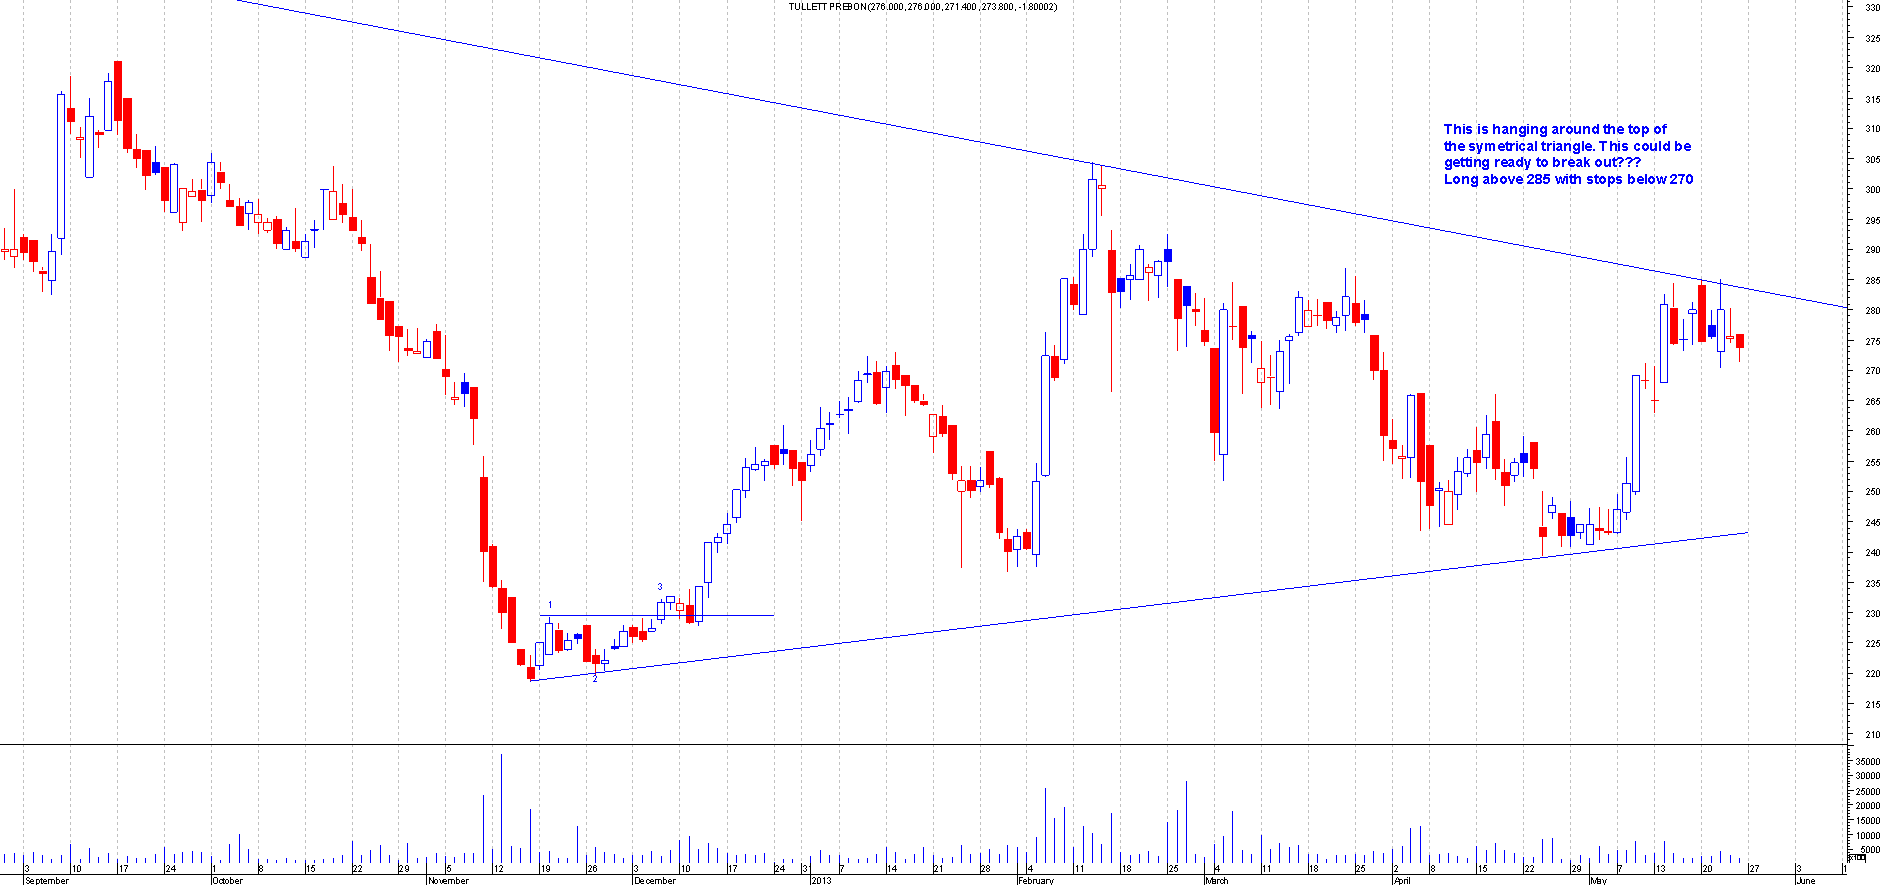
TLPR.L
This is the Chart of Tullett Prebon when I first mentioned this:
After : This broke out nicely and hanged around the breakout point for a few days before exploding out to net currently 100+ points
3rd June 2013
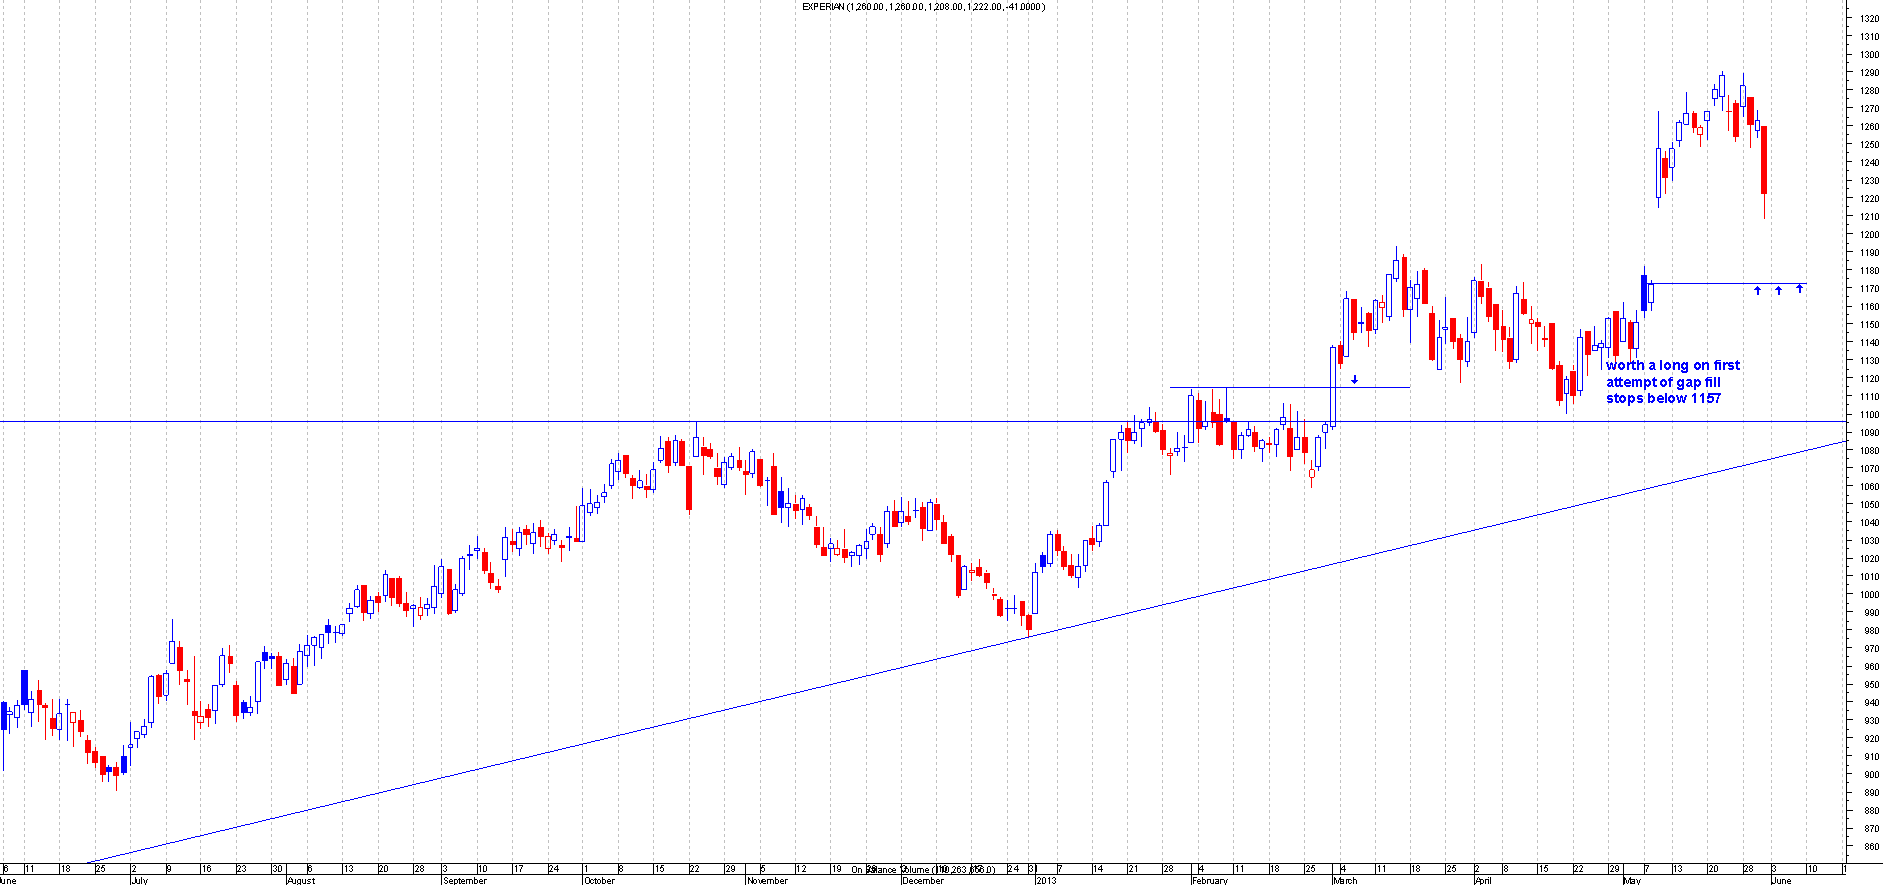
EXPN.L
This is the Chart of Experian when I first mentioned this:
After : As can be seen this bounced of the gap fill perfectly and bounced 30 points. A great short term trade. This then went down hard afterwards which we then went long from the trend line bounce at a latter date.
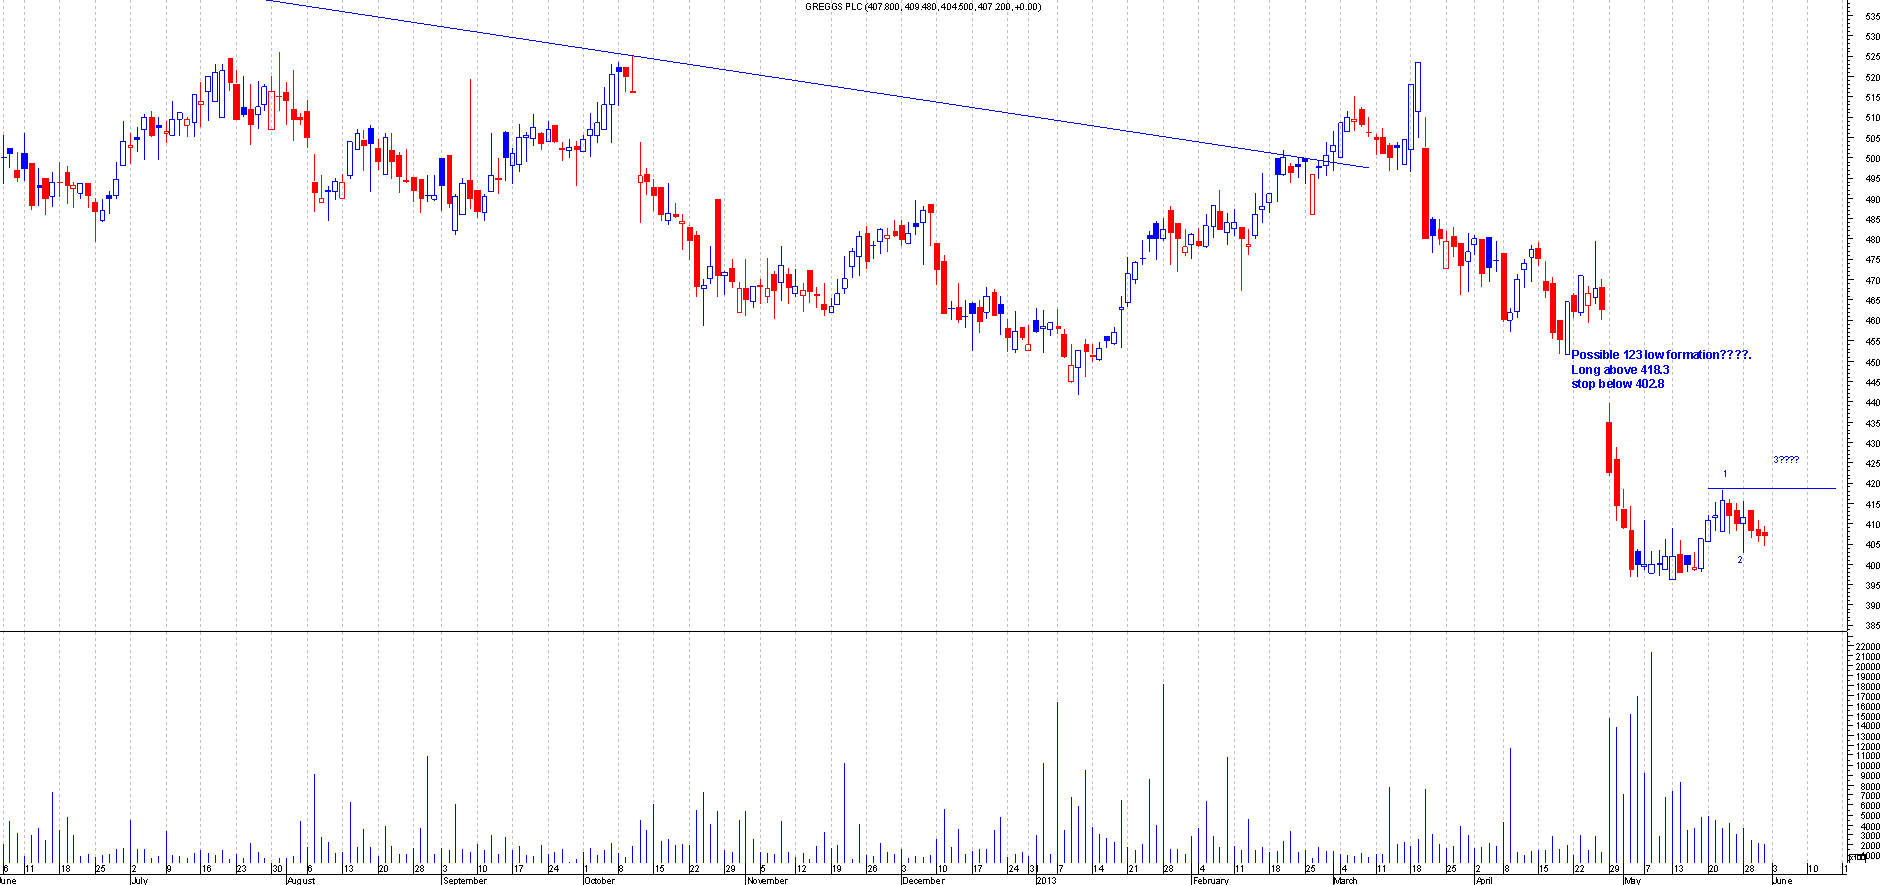
GRG.L
This is the Chart of Greggs Plc when I first mentioned this:
After: This moved 22 points higher from the breakout of the 123 low formation. So was a good trade,but this then went back down a few weeks latter by which point the trade should have been closed with a profit.
10th June 2013
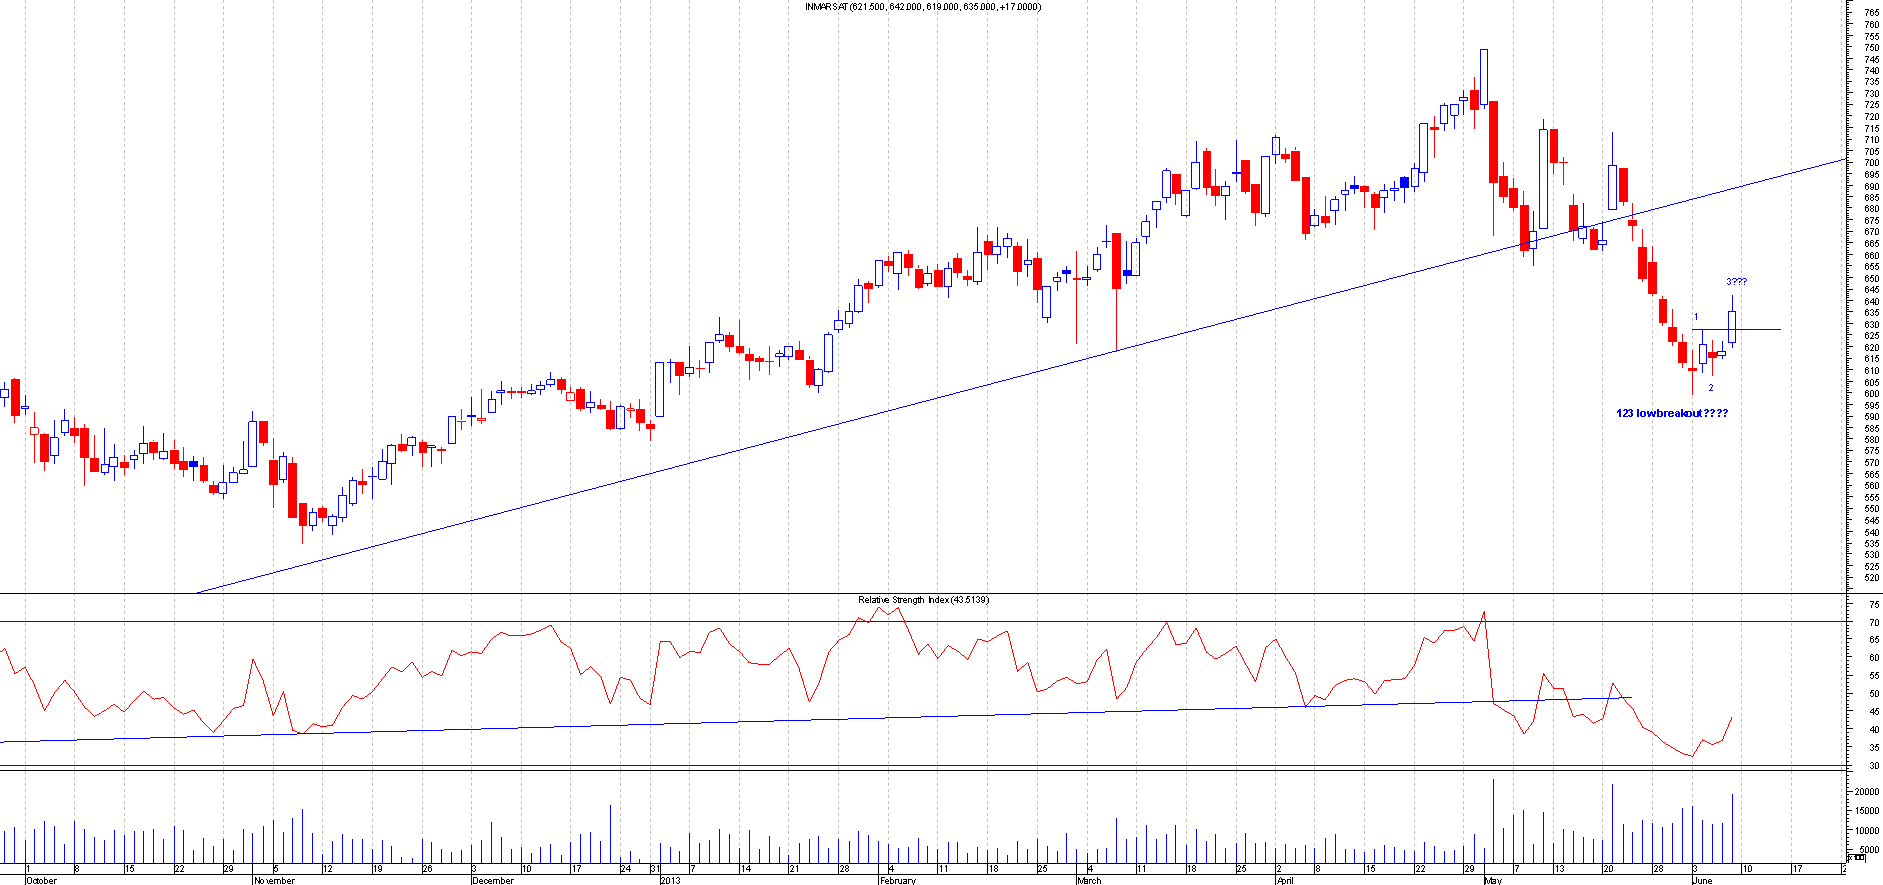
ISA.L
This is the Chart of Inmarsat when I first mentioned this:
After : This broke out perfectly and has since moved 120+ points .This shows you the power of a 123 low in action
17th June 2013
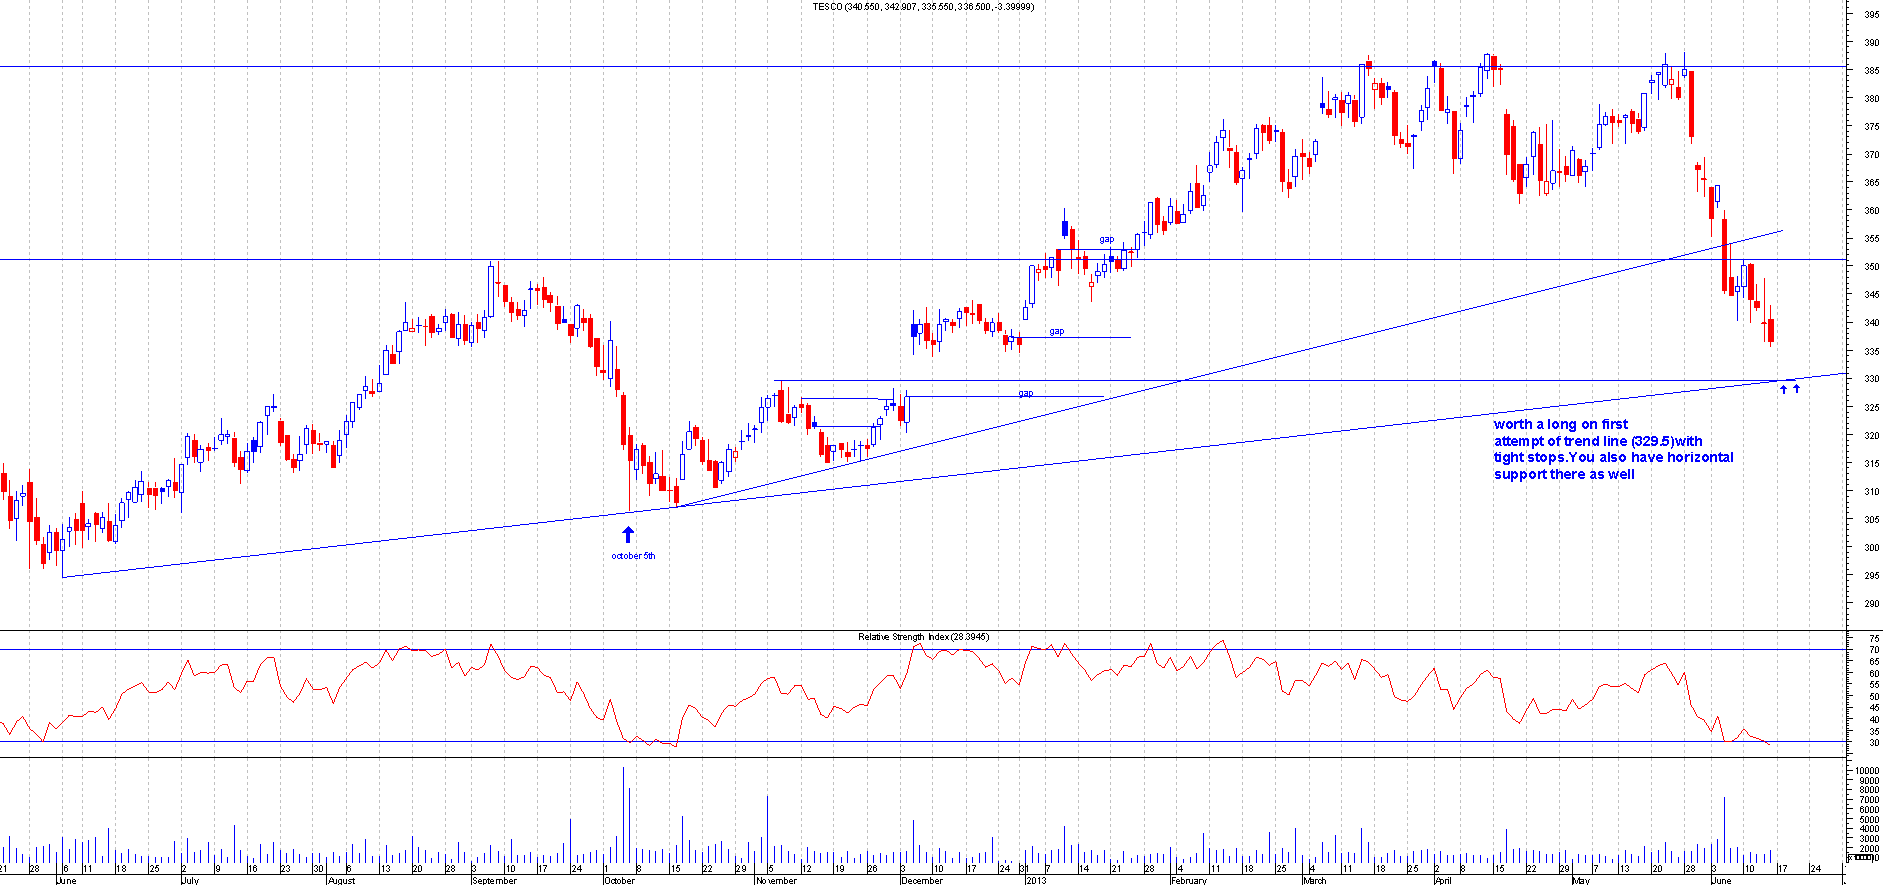
TSCO.L
This is the Chart of Tesco PLC when I first mentioned this:
After : This went slightly below the trend line but there was a gap support right near the trend line as well that made this bounce so the stops would have been below the gap so this should have been a good trade as afterwards this moved by 50+ points.This shows the importance of multipile supports close by.
1st July 2013
SDL.L
This is the Chart of SDL PLC when I first mentioned this:
After : This had a nice 123 breakout but did hang around the breakout point after. This then broke out with some power a few weeks latter and moved 50+ points since.
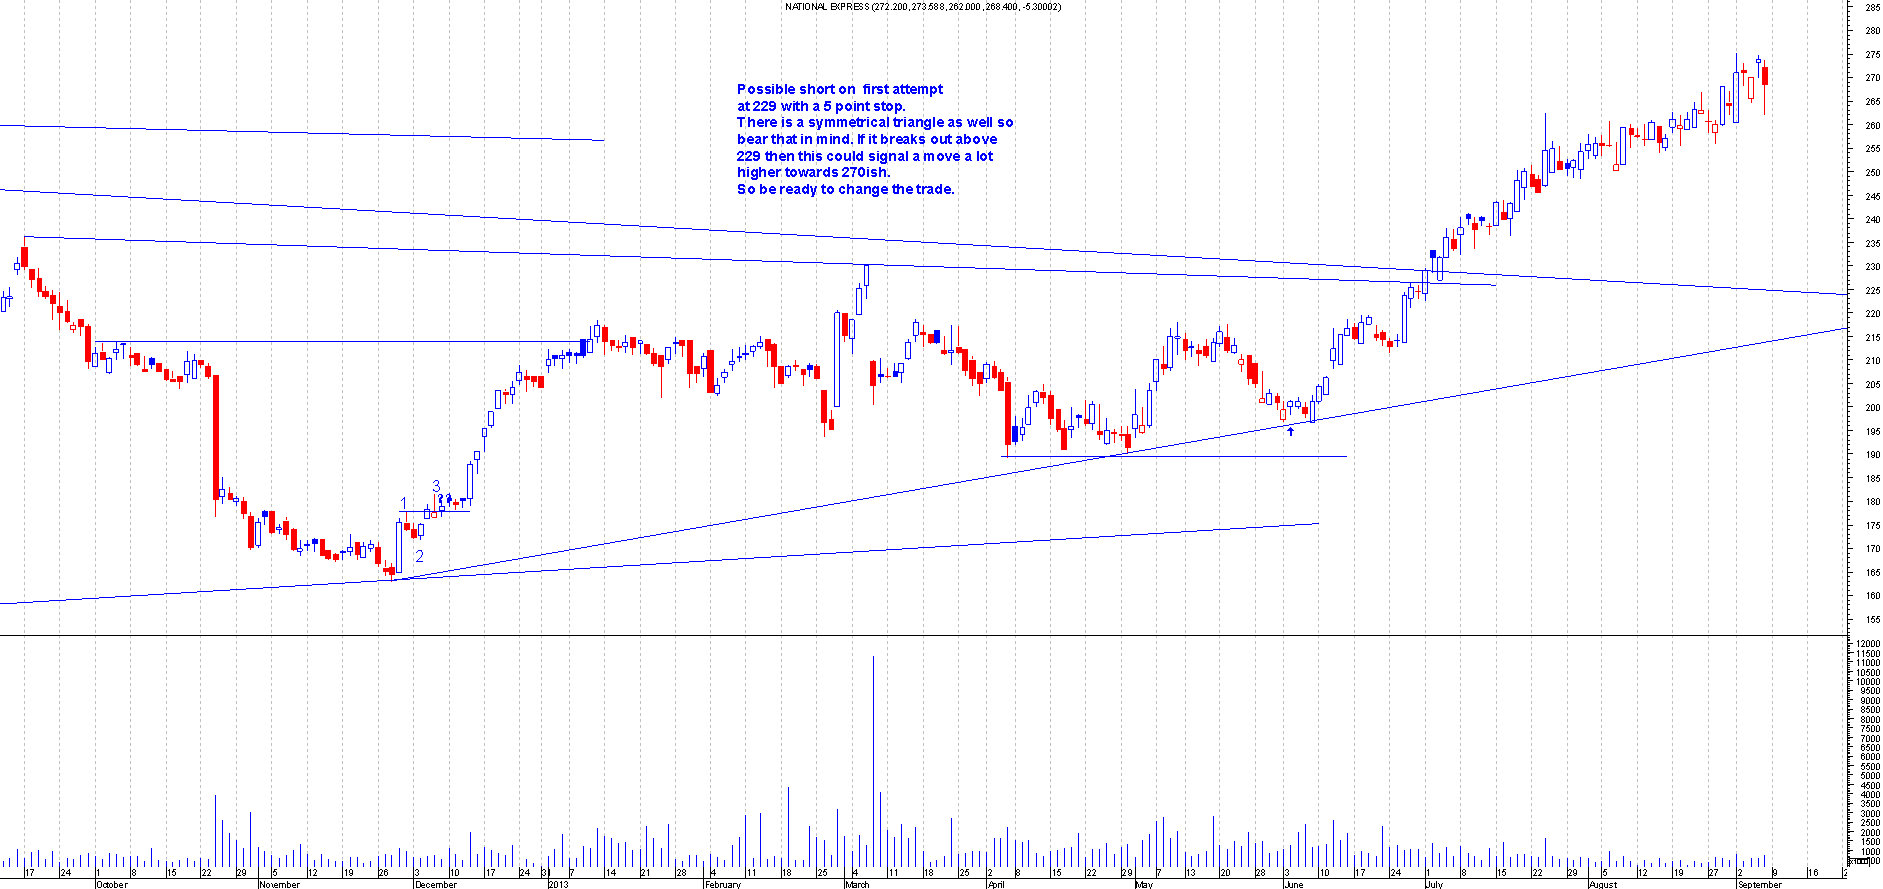
NEX.L
This is the Chart of National Express when I first mentioned this:
After : This has 2 options on this trade. The first options was to short this on the trend line test on first attempt.This would have been exited or stopped out due to the tight stop But at the same time you exited this trade you should have gone long as this would signal the symetrical triangle breakout. This proved to be a wise call as this then never looked back and is currently 50+ points up
8th July 2013
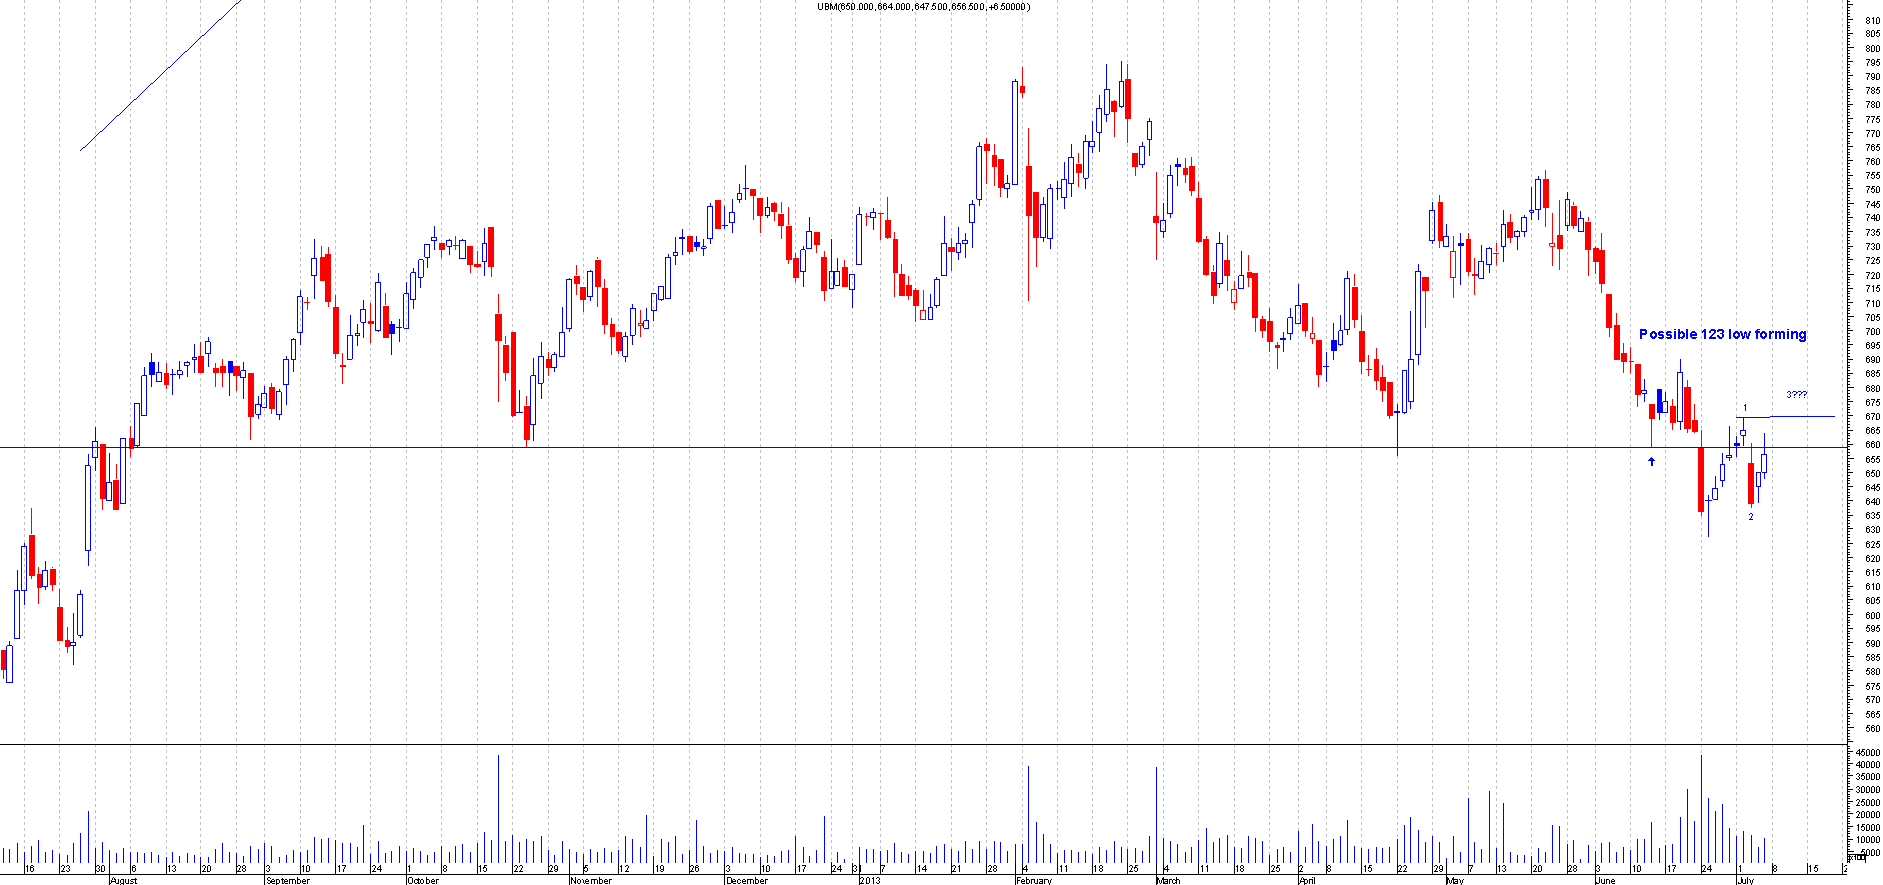
UBM.L
This is the Chart of UBM when I first mentioned this:
After : This broke out nicely and moved 90+ points from the breakout point.This actually moved in 5 waves motion
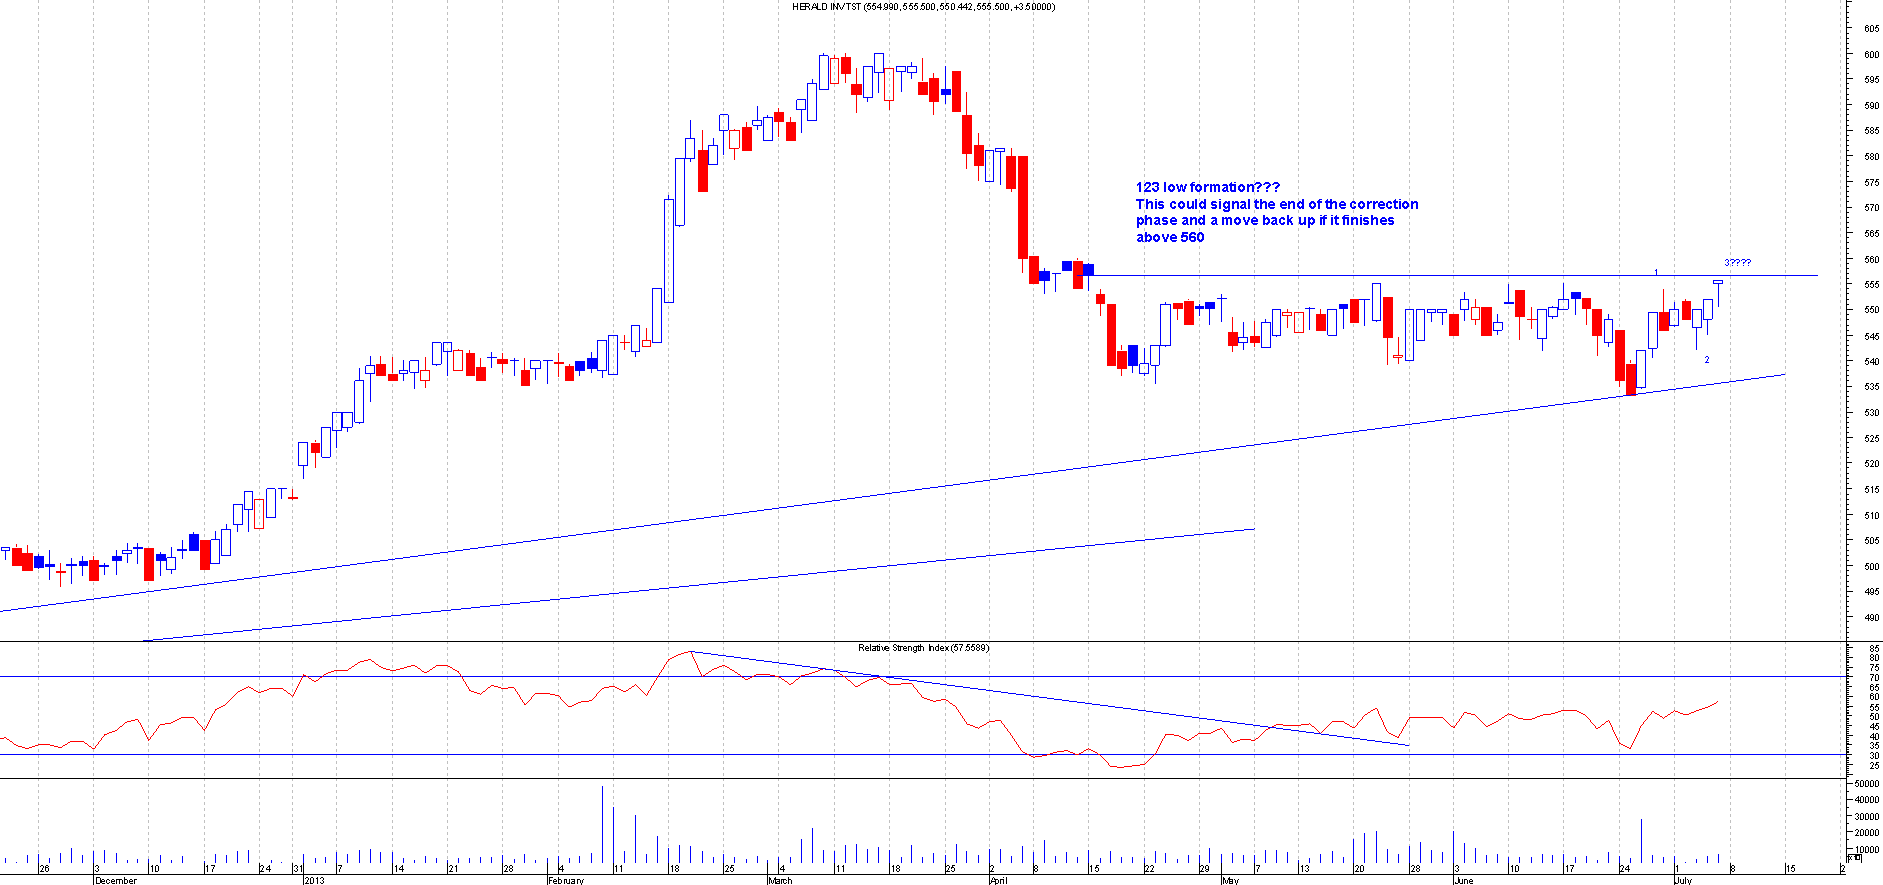
HRI.L
This is the Chart of Herald Inv Tst when I first mentioned this:
After : This broke out nicely from the 123 low formation.This had all the tell tell signs that it was going to breakout by going sideways and continually weakening the resistance.Once this broke out it even came back to test the breakout a few weeks latter then holding and moving to the highs since.This is currently 50 + points up so a good trade.
15th July 2013
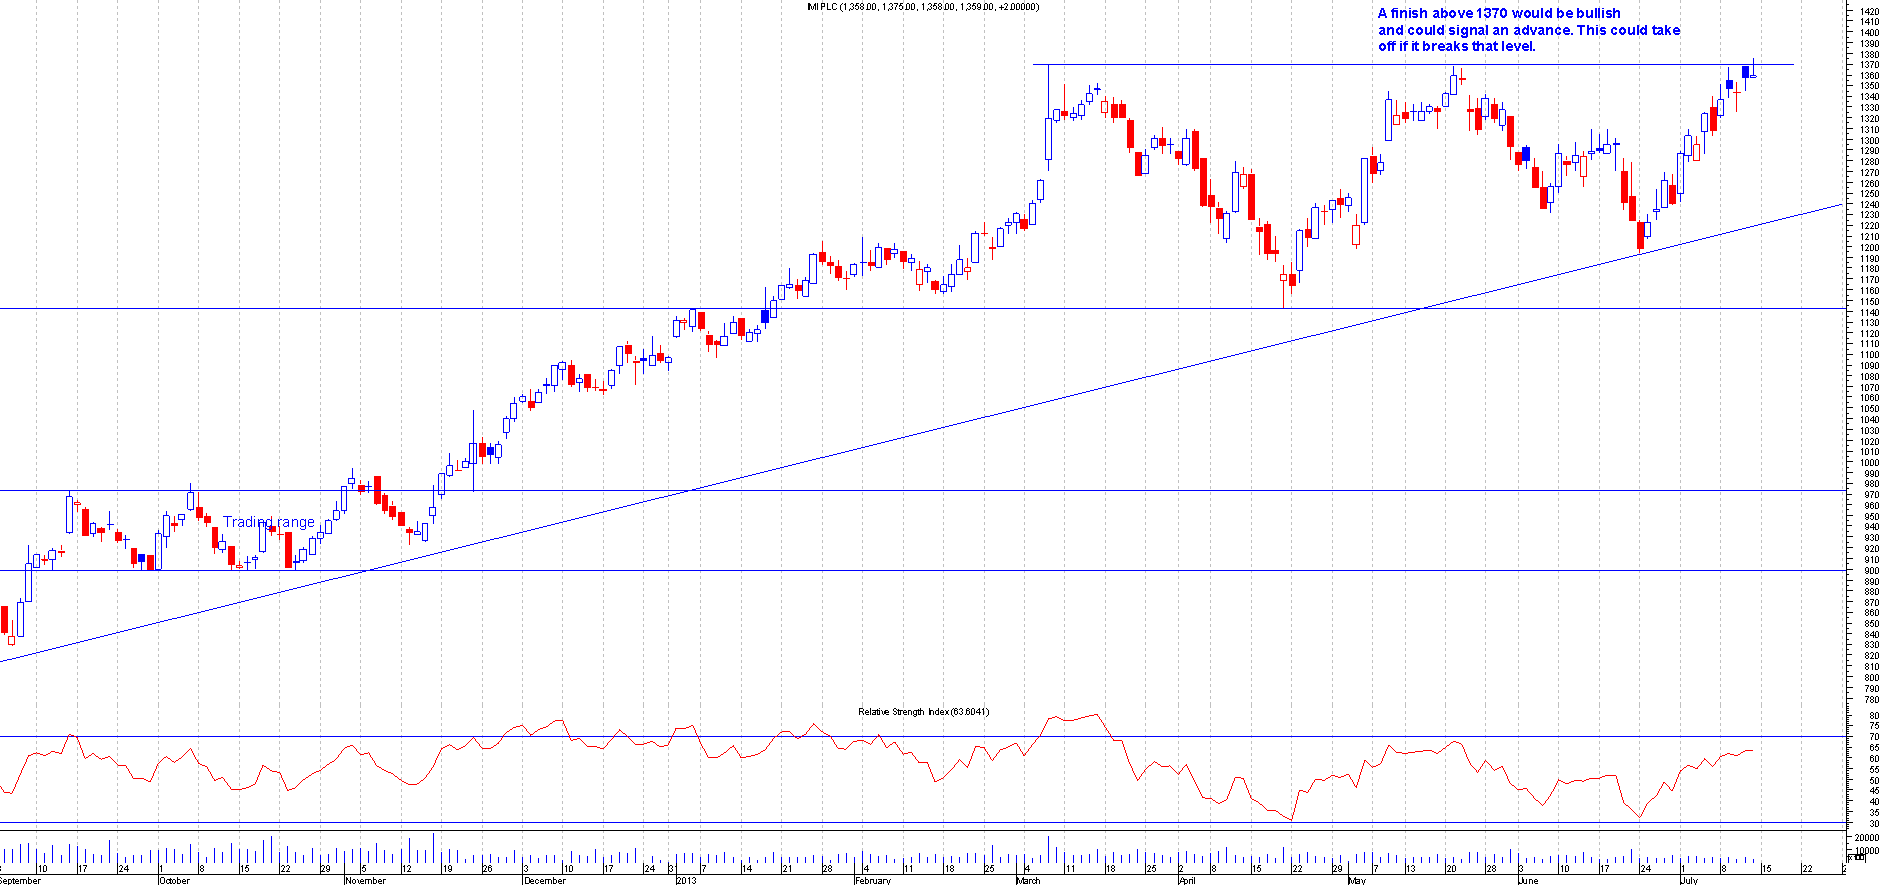
IMI.L
This is the Chart of IMI when I first mentioned this:
After : This broke out beautifully from the Assending Triangle and like the prediction on the chart this exploded out and has moved 150+ points from the breakout point.
RRS.L
This is the Chart of Randgold Resource when I first mentioned this:
After : This broke out nicely from the 123 low formation.This went on to break its down trend line as well.This share was not for the faint hearted as this has a habit of moving in the hundreds.This has gone over a 1000 points from the breakout point,yes , Thousand points.
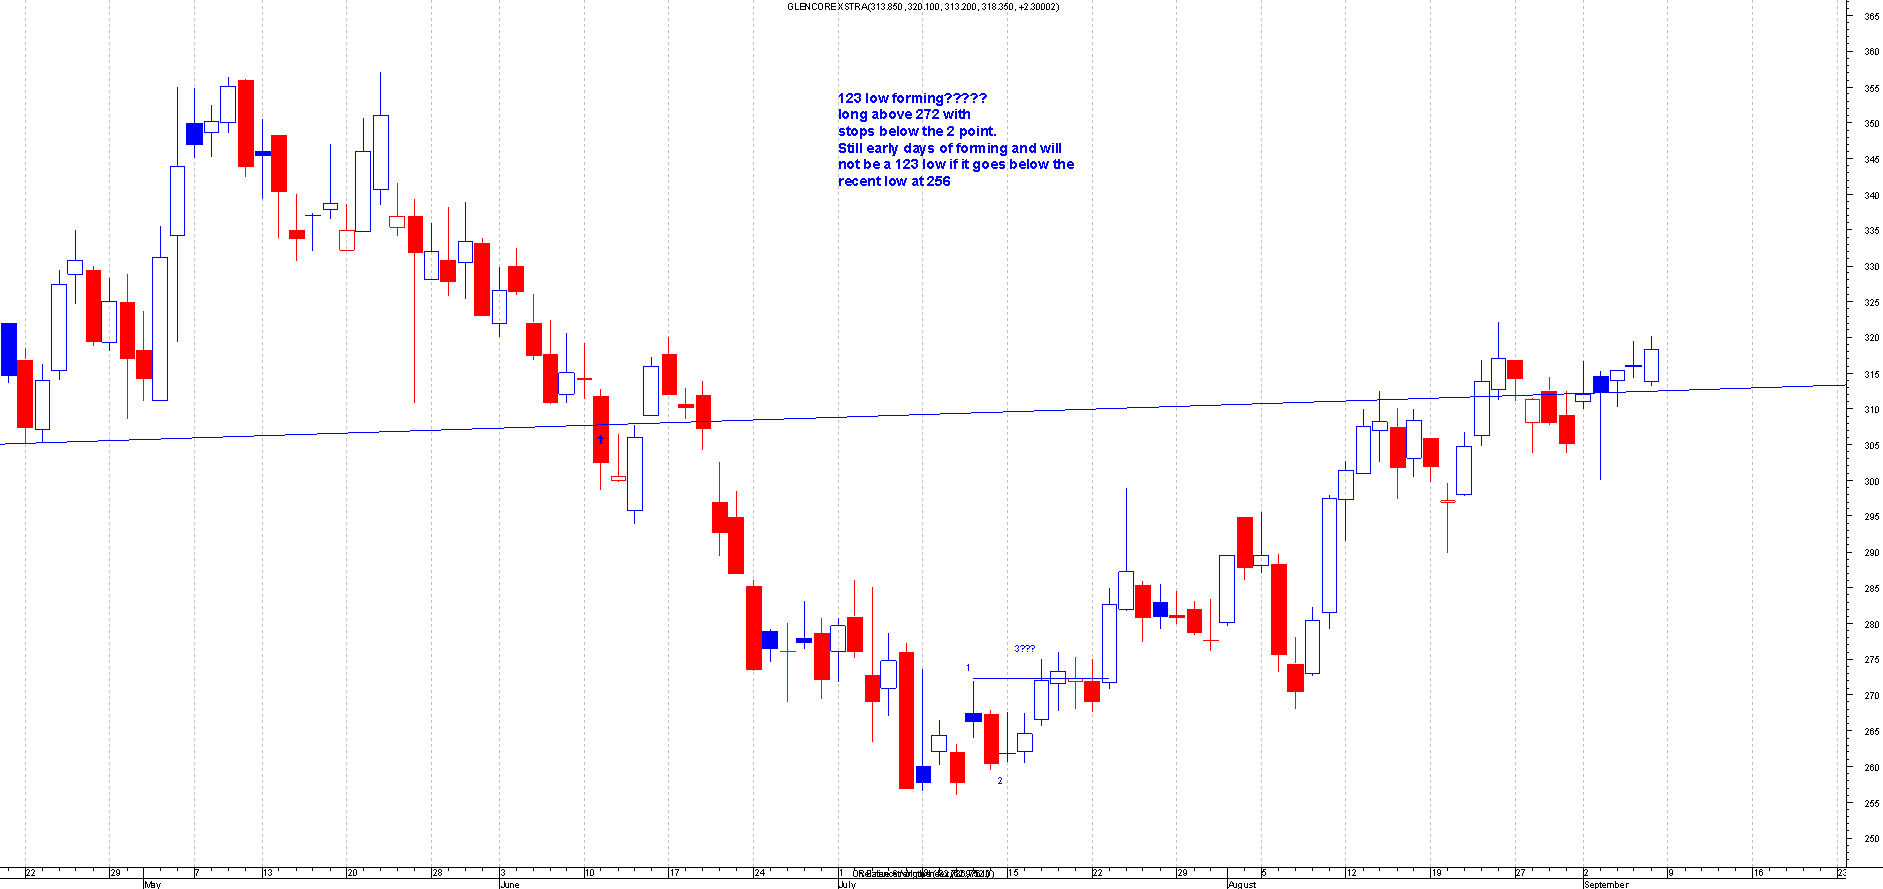
GLEN.L
This is the Chart of Glencore Xstra when I first mentioned this:
After : This broke out perfectly from the 123 low formation and even back tested this a few weeks latter and has since moved 50+ points.
Thats it for part 1 of this blog so keep an eye out for part 2 latter as i need to split this blog up otherwise it will get massive. Ill do 3 parts to it.


