


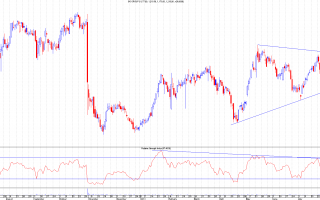
A very simple price only chart here and this is thanks to Remo who runs www.chartsview.co.uk who gave the heads-up on this during the live trading chat on his website today.What we have is a backtest of the 123-low breakout level. These trades are actually even better than simply trading the 123-low breakout if they work out because the resulting move, again if it works, ought to be stronger than the original breakout where doubt still remains and consequently we see the drop back to the breakout level.Normally I'd have a stop below the higher low but the doji offers a tighter option below 79.5p. Original link...
Continue reading
-
1 Hour Trading System - Day 1
Trading Systems Trading systems have been used all over the world for centuries, why are they so popular you may ask? Well it's because of the many benefits the trading systems provide such as providing entry and exit points, taking the emotion out
-
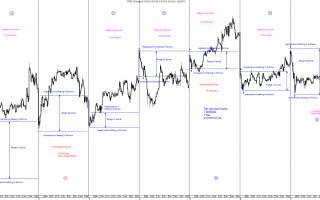
Share Tips from 4th November-1st December 2013
This blog is an update from the share tips from 4th November to 1st December 2013 from the Premium Section called Share Tips.There was a possible 2000+ points profit to have been made.This obviously assumes the max possible and some of these shares h

I thought I'd start this analysis with a really long term view using the daily chart as it shows the power of RSI trendline very nicely. We can also see the big bearish divergence at the recent high.What's interesting here is that this RSI uptrend support was hit again only a couple of days ago. In the past this has been the trigger for some decent rises but you never know when these trendlines are going to fail so is there anything else to support the hypothesis of a rise? In this near(er) term view we can see that price is at uptrend support and the 61.8% Fib as well as having formed a double inside bar pattern so there should be a decent move one way or the other. You can just make out that long term RSI support at the bottom of the chart too.I would definitely have...
Continue reading

Well, here we are at last back at the key 166p level but, no surprise, the SP closed just below.I still remain bullish here, not least because of the RSI which has continued upwards following its breakout, so we'll still have to wait for this key level to be taken out.With the meeting between Simon Murray and M&G taking place tomorrow, all eyes will be on the lookout for the resulting RNS but I suspect that if this is going to break out then it may well do so before the news comes. Only time will tell of course. Could be an interesting day tomorrow and the general markets remain bullish right into the close today too. Original link...
Continue reading

Friday saw a perfect test of the price downtrend from the 260p high but the SP remained bullish and closed such that there was also an RSI trendline breakout. This is significant because that RSI trendline is the one from the 450p high so I remain bullish here despite Friday's and Saturday's disappointing events with M&G.That's not to say that an RSI breakout results only in upward price movement. Look at the lower RSI trendline on the attached chart. The RSI breakout occurred a day before the big price move but the higher low at 129.25p came on a perfect backtest of that RSI trendline so at some point I'd expect a similar backtest of the latest RSI trendline during a retrace.Of course, there's also the possibility that this could be a false RSI breakout - we need price to follow through in the next day or two.In the short...
Continue reading

As ever, I'll try and keep the emotive issues of fundamentals out of this but it's hard to do these days!We start with the daily chart which shows a failure of the main RSI downtrend breakout and a crash through both the 166p and 158p supports. I've highlighted here the possibility of a drop to the 61.8% Fib which would also be a backtest of the previous trendline break and also at the previous support/resistance level of 147/9p. There are other possibilities which are best viewed on the hourly charts. Two ways to view this chart: one is with the bullish wave count I've annotated it with which shows the SP hitting support at the 50% Fib of the whole move or the 61.8% Fib of the move referred to by Ian in the previous comments. (Note also the circled Fib which was referred to on the daily chart)The other...
Continue reading
