


Today's gap down came after a higher high but seems to confirm a negative RSI divergence against the earlier high which is bearish.It also failed to reach the 423p target from the W formation so it now seems to me that this rally was simply a corrective pattern despite the bullish RSI divergence at the recent low. It's not clear from the chart as shown, but yesterday's price high came as the RSI touched it's downtrend resistance which shouldn't really have happened until price was close to its downtrend and this adds to the bearish nature of the chart now.I'll be steering clear of this until a clearer opportunity Original link...
Continue reading
-
1 Hour Trading System - Day 1
Trading Systems Trading systems have been used all over the world for centuries, why are they so popular you may ask? Well it's because of the many benefits the trading systems provide such as providing entry and exit points, taking the emotion out
-
Share Tips from 4th November-1st December 2013
This blog is an update from the share tips from 4th November to 1st December 2013 from the Premium Section called Share Tips.There was a possible 2000+ points profit to have been made.This obviously assumes the max possible and some of these shares h

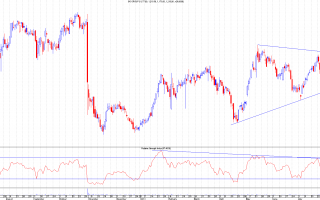
I've left the triangle I've been tracking on this chart but now it's broken out it looks a lot more like a cup and handle formation.Note how the main downtrend resistance is still capping the price and we still have the 28.75p to 30p area to get through too but this is looking set up for a breakout soon IMHO. We won't know that until it's closed above the downtrend so I'd like to now see a close above 28p and it should be good to go then. Original link...
Continue reading

Price closed slightly above the main downtrend yesterday but it failed to follow through which shows that the key level remains the major 30p resistance and gap area from 28.75p.Sirius still needs to close above those areas to bring higher prices but, once it does, the move should be powerful with a target around the 47p mark.In the meantime I'm still watching and waiting. Original link...
Continue reading

It's been an eventful two days in SXX and it won't be of any consolation to some but this has been a great example of the importance of waiting for confirmation of a resistance break on close of day.A few days ago the price closed very slightly outside the main downtrend resistance but given the 0.25p minimum spread (approx 1% of the SP) this was hardly convincing and was followed by an immediate failure to stay above. Yesterday's touch of the critical 30p level was also sold off to back below the main trendline which was another warning but the severity of today's drop is still something of a surprise. That said, it's hit RSI support as we can see from the bottom of the chart so there may be some respite tomorrow with a bounce.I'll still wait for a close above 30p to go long on this though as that's...
Continue reading

We'll start this review with a look at the daily chart. My last blog entry suggested there could be bounce off that RSI trendline support. Indeed there was but it was very short-lived. Since then, as can be seen in the highlighted area, the RSI broke through the trendline and has backtested and dropped confirming the break. This is not good unless it quickly breaks back and holds.One thing to look out for is Friday's inside bar (highlighted) though the range is very wide on that so it's risky to trade.The day of the RSI backtest also saw the price drop through, and close below, 2 trendline supports. In fact, that RSI support shown belongs not to either of those price trendlines, but to the trendline lower down from the 2009 lows as we'll see on the following weekly chart as we look towards where this could go. Unsurprisingly, the...
Continue reading
