


There wasn't any sign of a convincing bounce at the 141p 61.8% Fib level so it seems to me that the most likely option remains wave C down from 260p. There is an alternative big picture count which has the whole move from the original 203p high as a very big correction (including the 450p high) but we'll leave that for now as the only additional possibility that option gives us is that of a new low below 87p as far as I can work out.Had this been wave 2 of a new uptrend I'd have expected more volume and a reversal candle pattern to form at this level but neither occurred and last week's weekly candle looks quite bearish.So where does that leave us? Well, it's still possible that the new uptrend is on but it will need to bounce from the off on Monday and will need to...
Continue reading
-
1 Hour Trading System - Day 1
Trading Systems Trading systems have been used all over the world for centuries, why are they so popular you may ask? Well it's because of the many benefits the trading systems provide such as providing entry and exit points, taking the emotion out
-
Share Tips from 4th November-1st December 2013
This blog is an update from the share tips from 4th November to 1st December 2013 from the Premium Section called Share Tips.There was a possible 2000+ points profit to have been made.This obviously assumes the max possible and some of these shares h

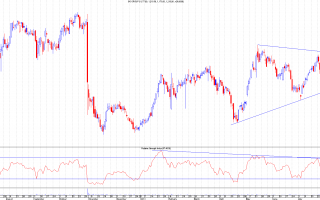
Here's a simple daily chart showing why I thought that 141p was a key level (aside from it having been instrumental in the past).There are multiple supports here: the short term uptrend support from the 126.3p low; the support from the drop off the 159.5p high; the half-way mark of the big bull candle and the 61.8% Fib all converge at this price today.What I'm looking for now is a close around the 145.5p mark which would give a hammer at this key level. I'd then be looking to see how that's followed up on Monday.There's nothing particular in the RSI to note but OBV (on balance volume) has flat-lined during this drop rather than following price down which supports the observations there there has been some quite buying in the background. Should be an Original link...
Continue reading

Following on from the discussion today on the previous blog entry, here we have a possible inverse head and shoulders formation as identified by Gary. This is, of course, conditional upon price returning to the "neckline" and then breaking through.I've shown here how we would calculate a target from such a pattern - we take the difference between the top of the head and the neckline (vertically) and the plot that from the breakout point (which I've just put there for illustrative purposes).I've also drawn a horizontal line which could be another iHS but this one seems unlikely to me.I'm not sure of this is exactly the form Gary was talking about but I'm sure he'll enlighten us later on.From my own point of view, I'm not a big fan of H&S formations unless they're really clear and the neckline is fairly horizontal. Anyway, we just about hit the 61.8%...
Continue reading

This type of penny share is extremely hard to analyse and even hard to get right due to the long periods of no price movement followed by huge spikes so I wouldn't read too much into this post (a request).Clearly the short term trendline broke but a low formed near the 61.8% Fib (could be a permanent or temporary low) so I've drawn a new trendline there.IMHO it needs to hold that low of 0.7p from a couple of days ago or it could easily go back to that gap at 0.45p or even lower.For me, this type of share is either an investment on fundamentals or a gamble. Occasionally a decent looking chart develops. Spreads and slippage on stop losses can cause nightmares in these but if I'd bought the 61.8% Fib (I didn't), I'd have stops just below that 0.7p level. If it works out, where it goes...
Continue reading

I've zoomed in to the daily chart here in order to show the detail of the Fibs. We've already seen how the downtrend channel provided support and today's price action suggests that a higher low formed today which is a positive sign.In fact, when we look at the Fibs on this we can see that the 61.8% Fib came into play perfectly this morning and it strongly suggestive of a wave 2 low. A close at the day's high confirms the bullishness of this and a break of 384.7p would create a higher high to follow the higher low we may have had today.All in all Original link...
Continue reading
