
- Posts: 199
- Thank you received: 0
Elliot Wave Discussion (Test GBP/JPY)
11 years 6 months ago - 11 years 6 months ago #10840
by gclark25
Elliot Wave Discussion (Test GBP/JPY) was created by gclark25
I know there are a few on here who trade using EWT, so was hoping for some input on the following chart.
I have poured over the GBP/JPY chart this morning and this is my findings.
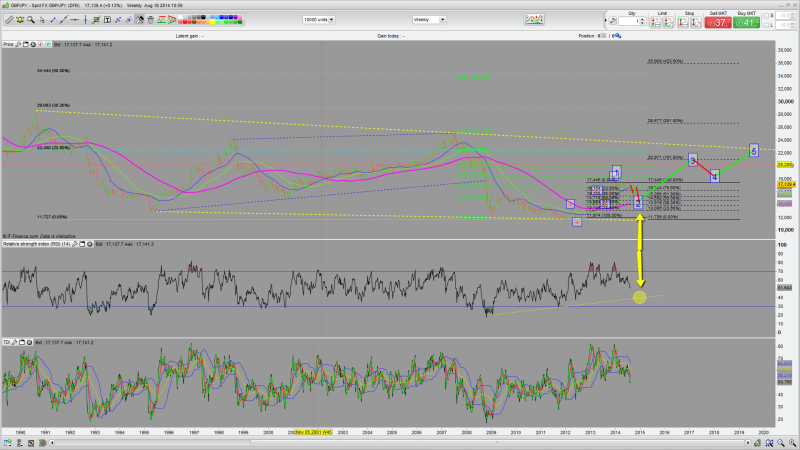
Firstly, the yellow trendlines are what I call my predominant trednlines. Blue ones are intermedate trendlines within bigger moves etc.
Looking at the following chart, I believe the GBP/JPY is in a descending range. We bounced off major ssupport trendlines in Jan 2012, from here I believe we are heading to the upper descending trendline.
link - dl.dropboxusercontent.com/u/63552262/Cha...t_Wave_-_18-8-14.png
Closer view
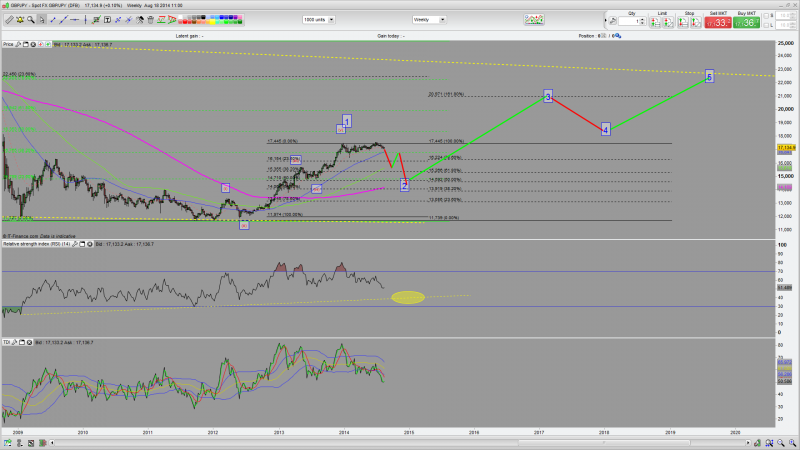
link - dl.dropboxusercontent.com/u/63552262/Cha...ser%29_-_18-8-14.png
I believe we could have completed a wave 1 on the way back up (??). I have put the intermediate waves in to show my thinking. From here I believe a triangle is forming, and if correct, a break on the downside for a wave 2 correction will be in play. I have forget what fib extension you should really be targetting for a wave 2 correction, but I have placed it between the 50 & 61.8% extensions from the swing high to swing low as shown on the chart. From there I have projected a wave 3 @ the 161.8% fib extension of Wave 1 (I have noted there is no real confluence at this part, s this is just an assumption - the previous high to low 61.8% fib (light green)@ [price] 19940/20000 is also a possibility). From there I have a wave 4 which does not breach the original wave 1 and from there a wave 5. The Wave 5 has several areas of confluence with the MAJOR low to high fib retracement of 23.6% along with the recent high to low retracement of 78.6% and perhaps more importantly the major descending trendline.
Of course I understand that the chances of this playing out as above is low, but I just would like to know that (1) my basic understanding of the theory is ok and (2) does anyone have a similar outlook?
I have poured over the GBP/JPY chart this morning and this is my findings.
Firstly, the yellow trendlines are what I call my predominant trednlines. Blue ones are intermedate trendlines within bigger moves etc.
Looking at the following chart, I believe the GBP/JPY is in a descending range. We bounced off major ssupport trendlines in Jan 2012, from here I believe we are heading to the upper descending trendline.
link - dl.dropboxusercontent.com/u/63552262/Cha...t_Wave_-_18-8-14.png
Closer view
link - dl.dropboxusercontent.com/u/63552262/Cha...ser%29_-_18-8-14.png
I believe we could have completed a wave 1 on the way back up (??). I have put the intermediate waves in to show my thinking. From here I believe a triangle is forming, and if correct, a break on the downside for a wave 2 correction will be in play. I have forget what fib extension you should really be targetting for a wave 2 correction, but I have placed it between the 50 & 61.8% extensions from the swing high to swing low as shown on the chart. From there I have projected a wave 3 @ the 161.8% fib extension of Wave 1 (I have noted there is no real confluence at this part, s this is just an assumption - the previous high to low 61.8% fib (light green)@ [price] 19940/20000 is also a possibility). From there I have a wave 4 which does not breach the original wave 1 and from there a wave 5. The Wave 5 has several areas of confluence with the MAJOR low to high fib retracement of 23.6% along with the recent high to low retracement of 78.6% and perhaps more importantly the major descending trendline.
Of course I understand that the chances of this playing out as above is low, but I just would like to know that (1) my basic understanding of the theory is ok and (2) does anyone have a similar outlook?
Last edit: 11 years 6 months ago by gclark25.
Please Log in or Create an account to join the conversation.
Moderators: remo
Time to create page: 0.088 seconds