This is an update to the Interesting Chart section on www.chartsview.co.uk. This section shows the shares that have great potential for the coming weeks.
In this blog i will be looking at how well these tips have done by showing you the before and after picture.
Its been a mixed few weeks on the interesting chart section. There have been a few false breakouts but thats where the stops would kick in.Some shares just went sideways and faded out and others just took off . The Interesting chart section is primarily for short term trading and not long term. So some of the charts that i put up will show prices moved back down or up but from a day trading point of view were perfect. Thats the goal of the interesting chart section. For more great tips your best bet is to monitor the forums as thats where i post live currency trades and more.
Heres how well some of the tips have done.
6TH MAY to 12thMay
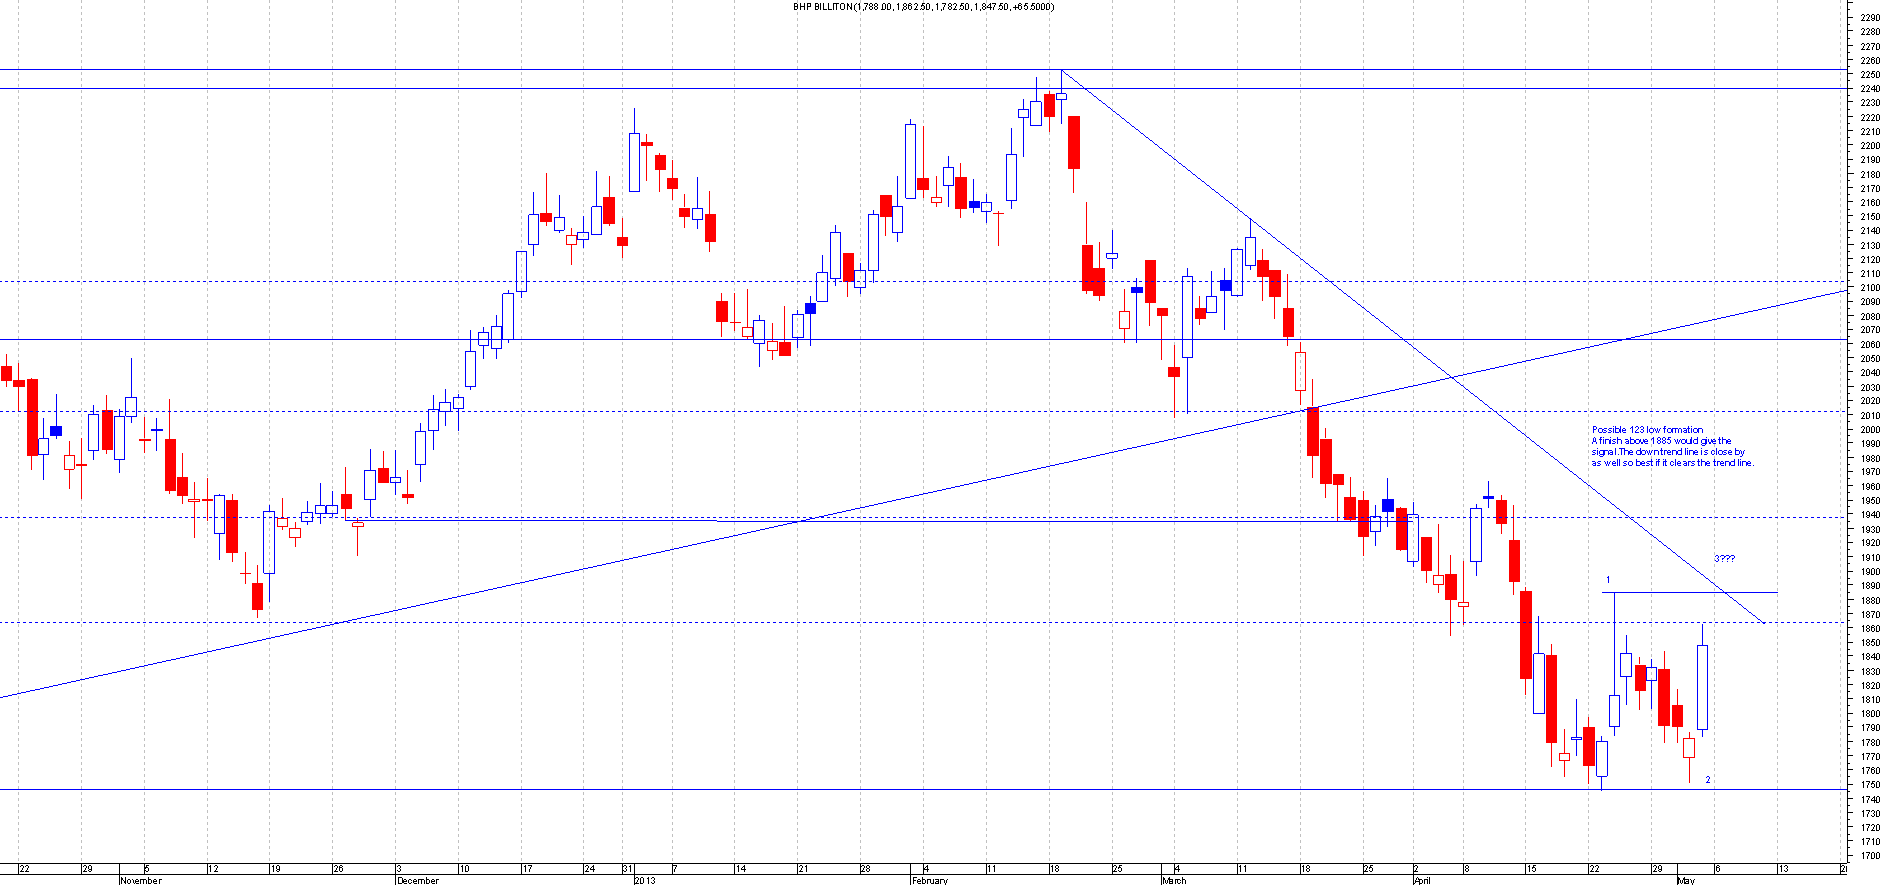
BLT.L
This is the Chart of BHP Billiton when I first mentioned this:
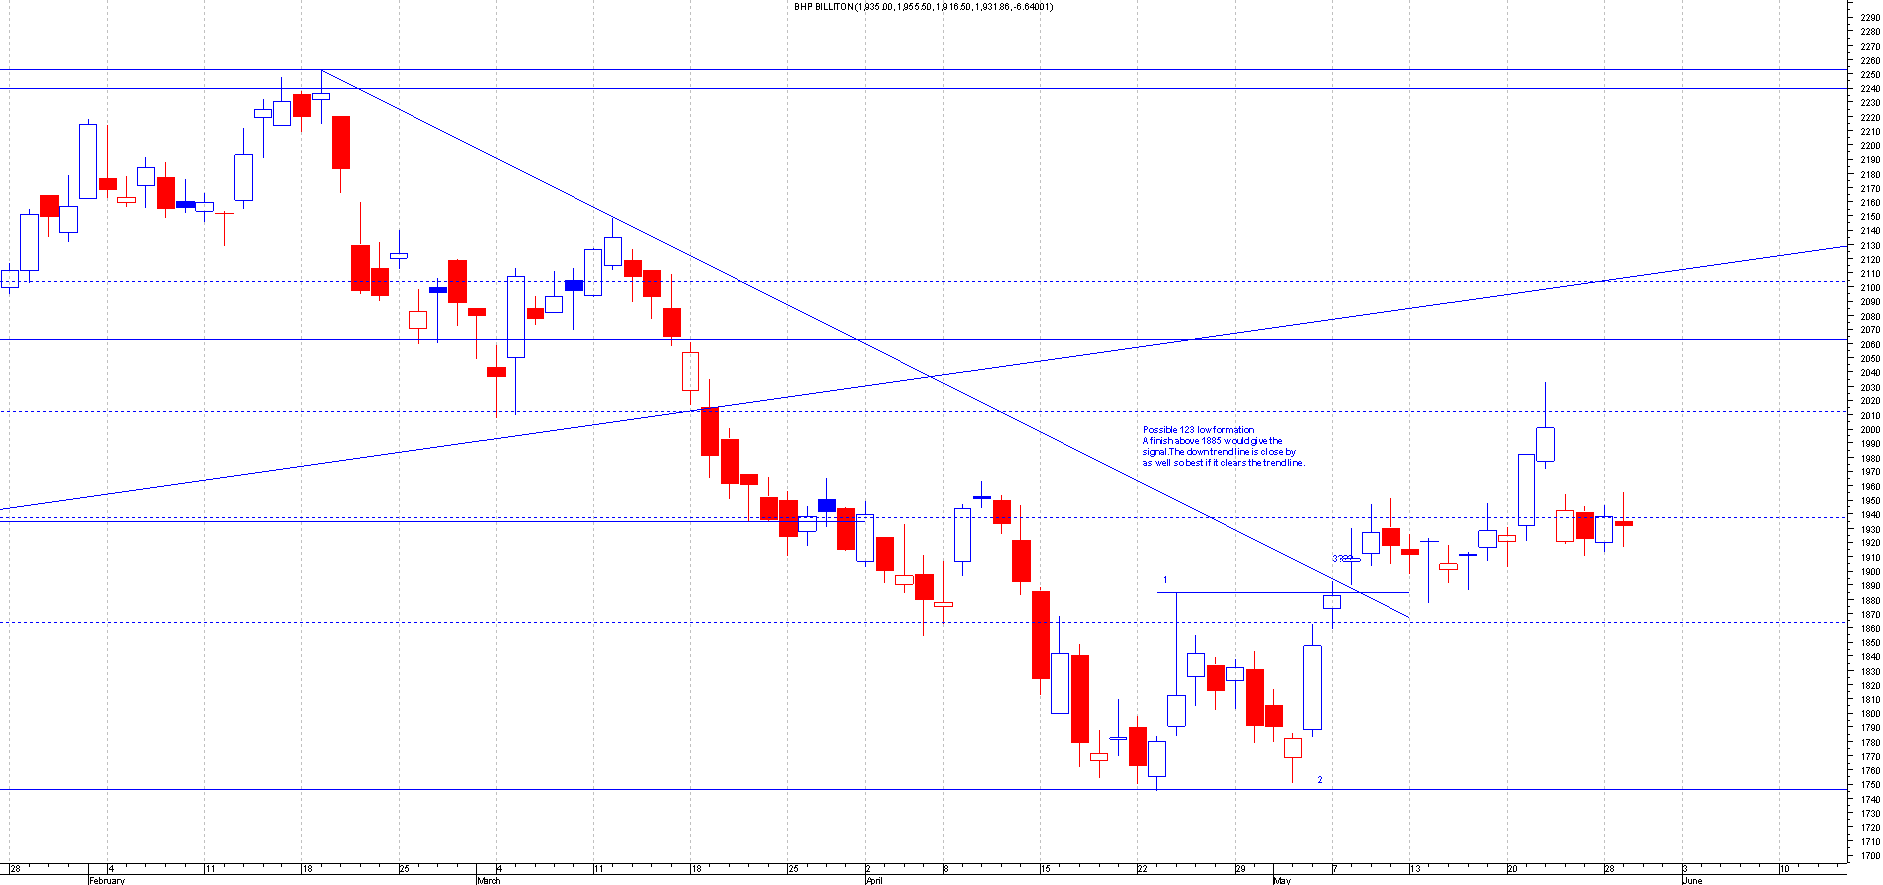
After: This broke out perfectly and even back tested the breakout for people that missed the first entry. This has since moved higher to even breakout past the down trend line thats been in play since febuary.This signalled a possible trend change to up or sideways trend.So far it looks like a new up trend. The trade should be a free trade now and profits taken.
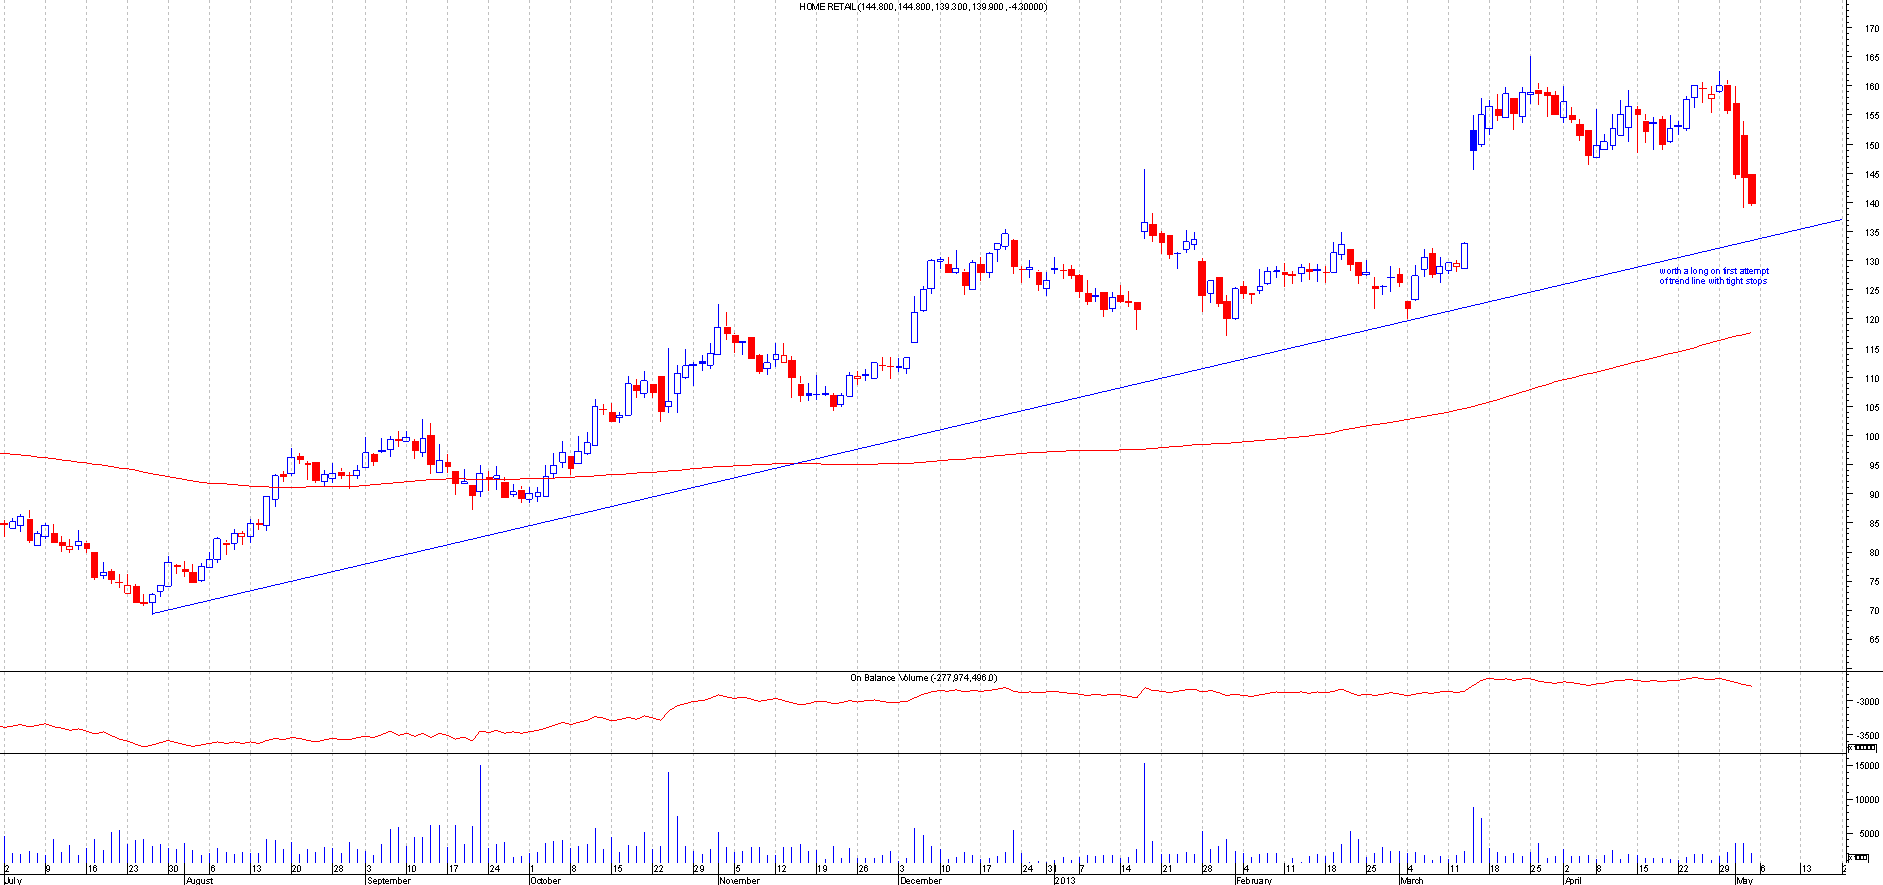
HOME.L
This is the Chart of Home Retail when I first mentioned this :
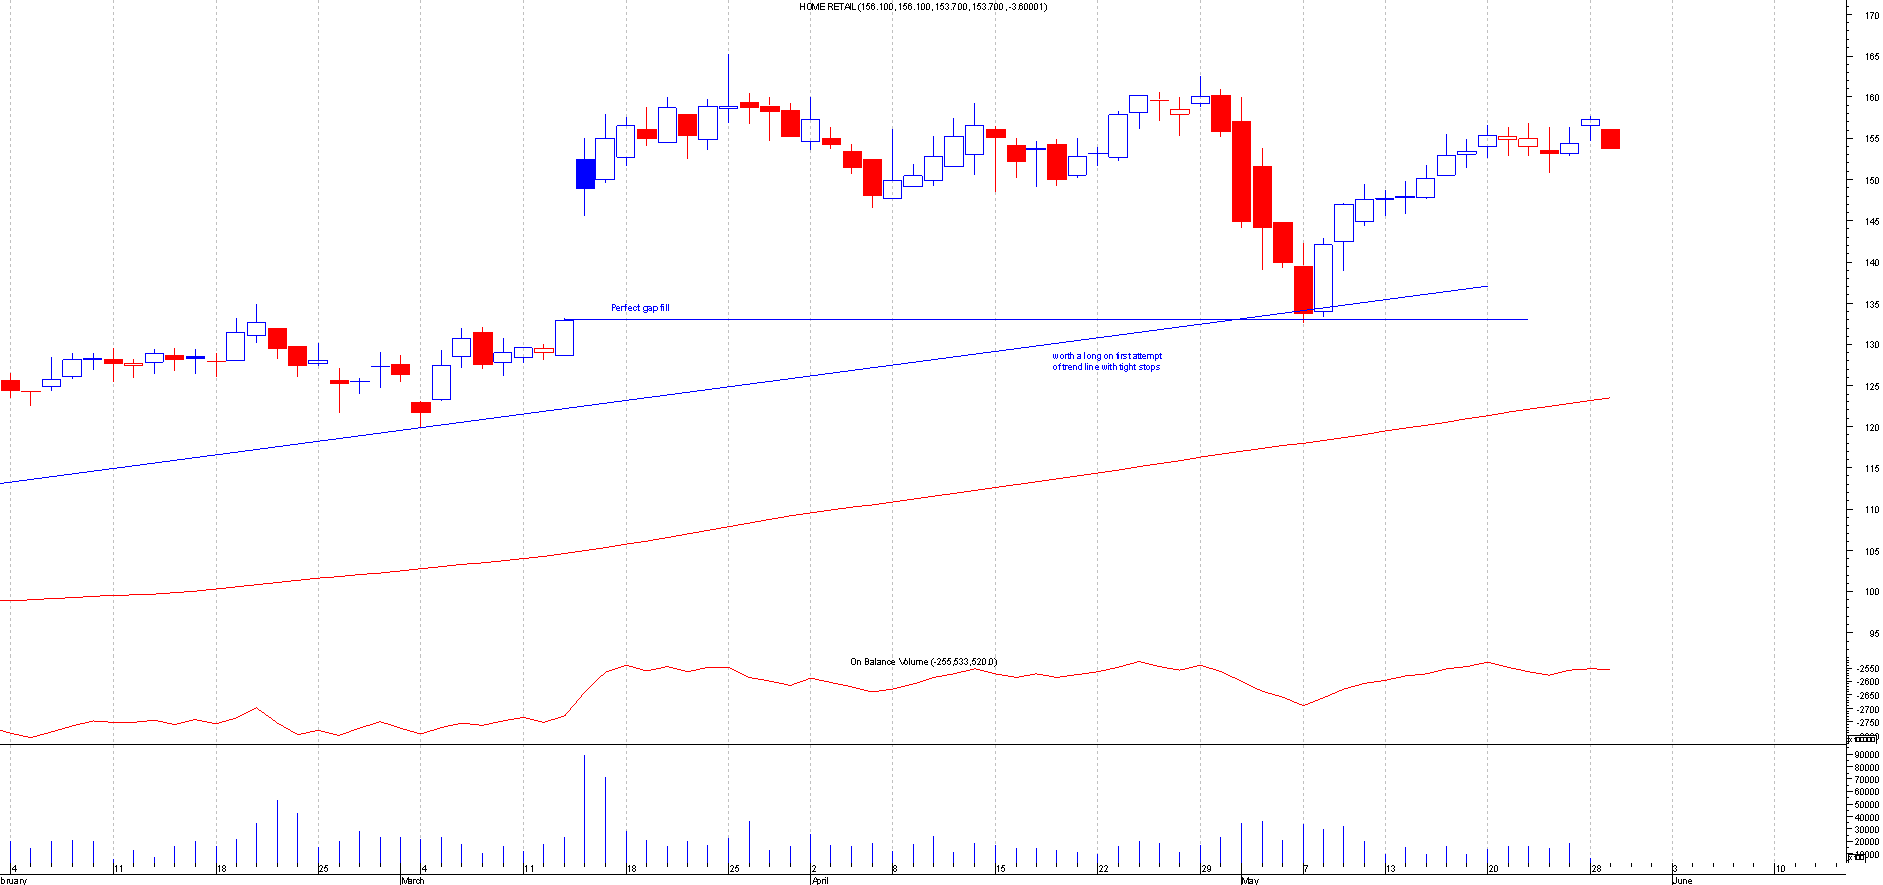
After: This filled the gap support perfectly and with the added support of the up trend line made this a perfect trade. You cant get more perfect than this,well you can . You had 2 convergin supports at the same level almost which is what you should be looking for in trades.Having more than one support gives the trade more chance of success, as can be seen from the chart below .
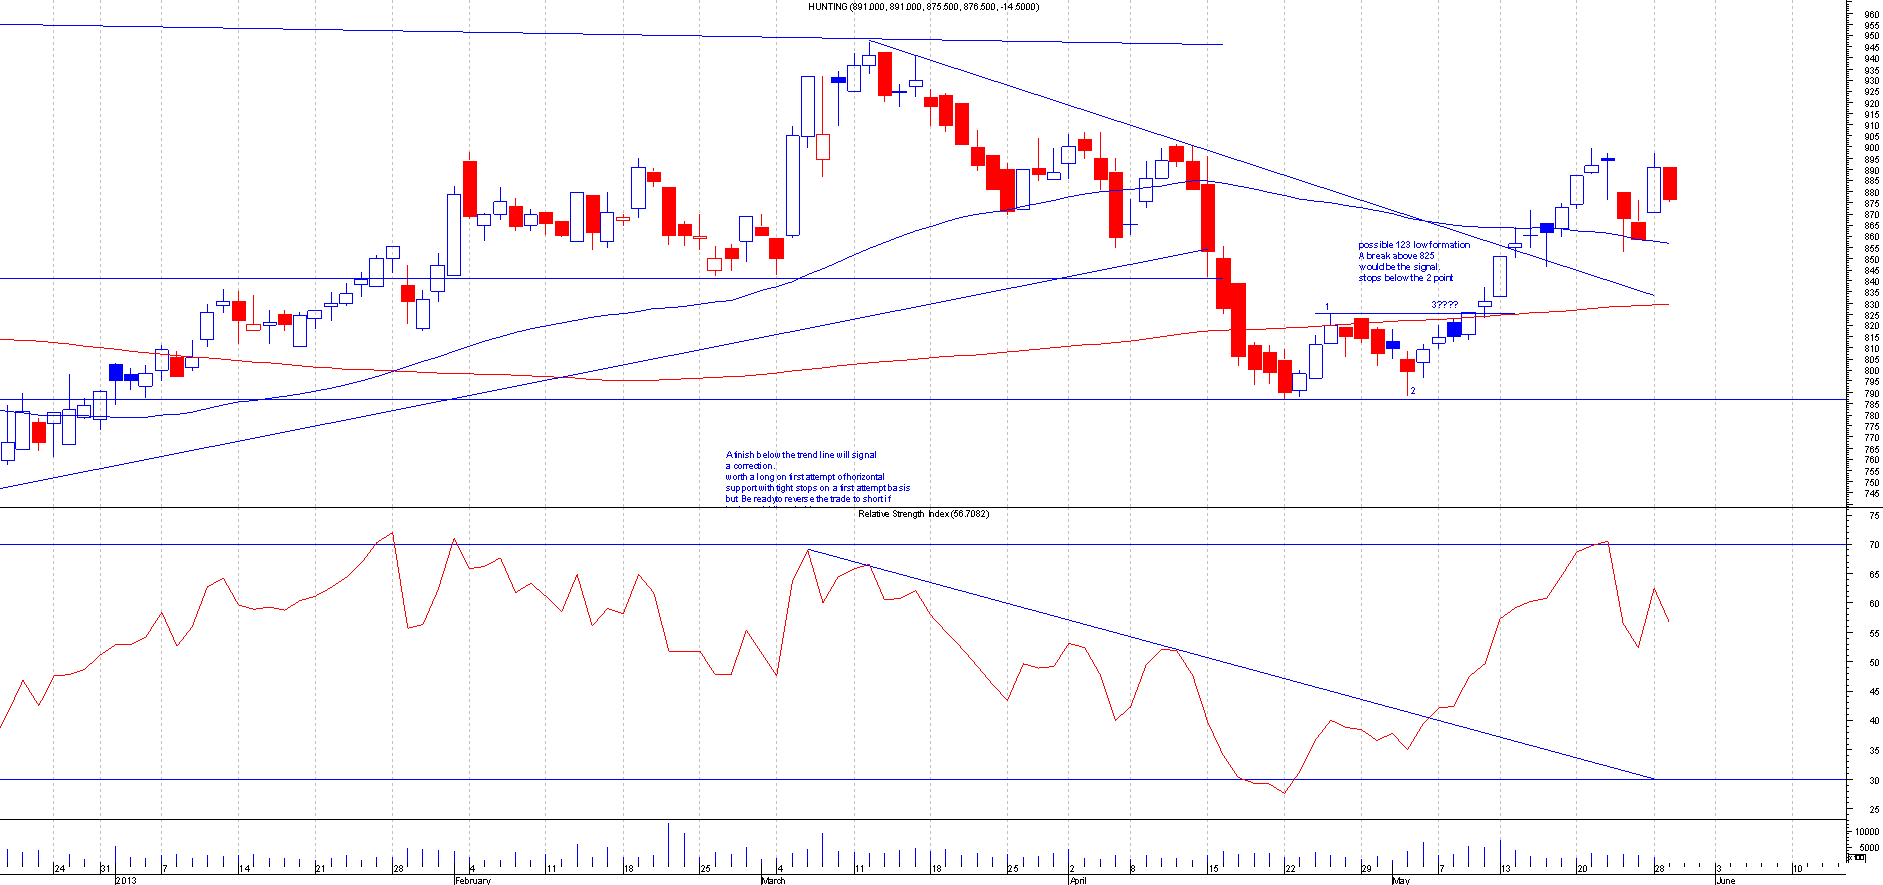
HTG.L
This is the Chart of Hunting when I first mentioned this:
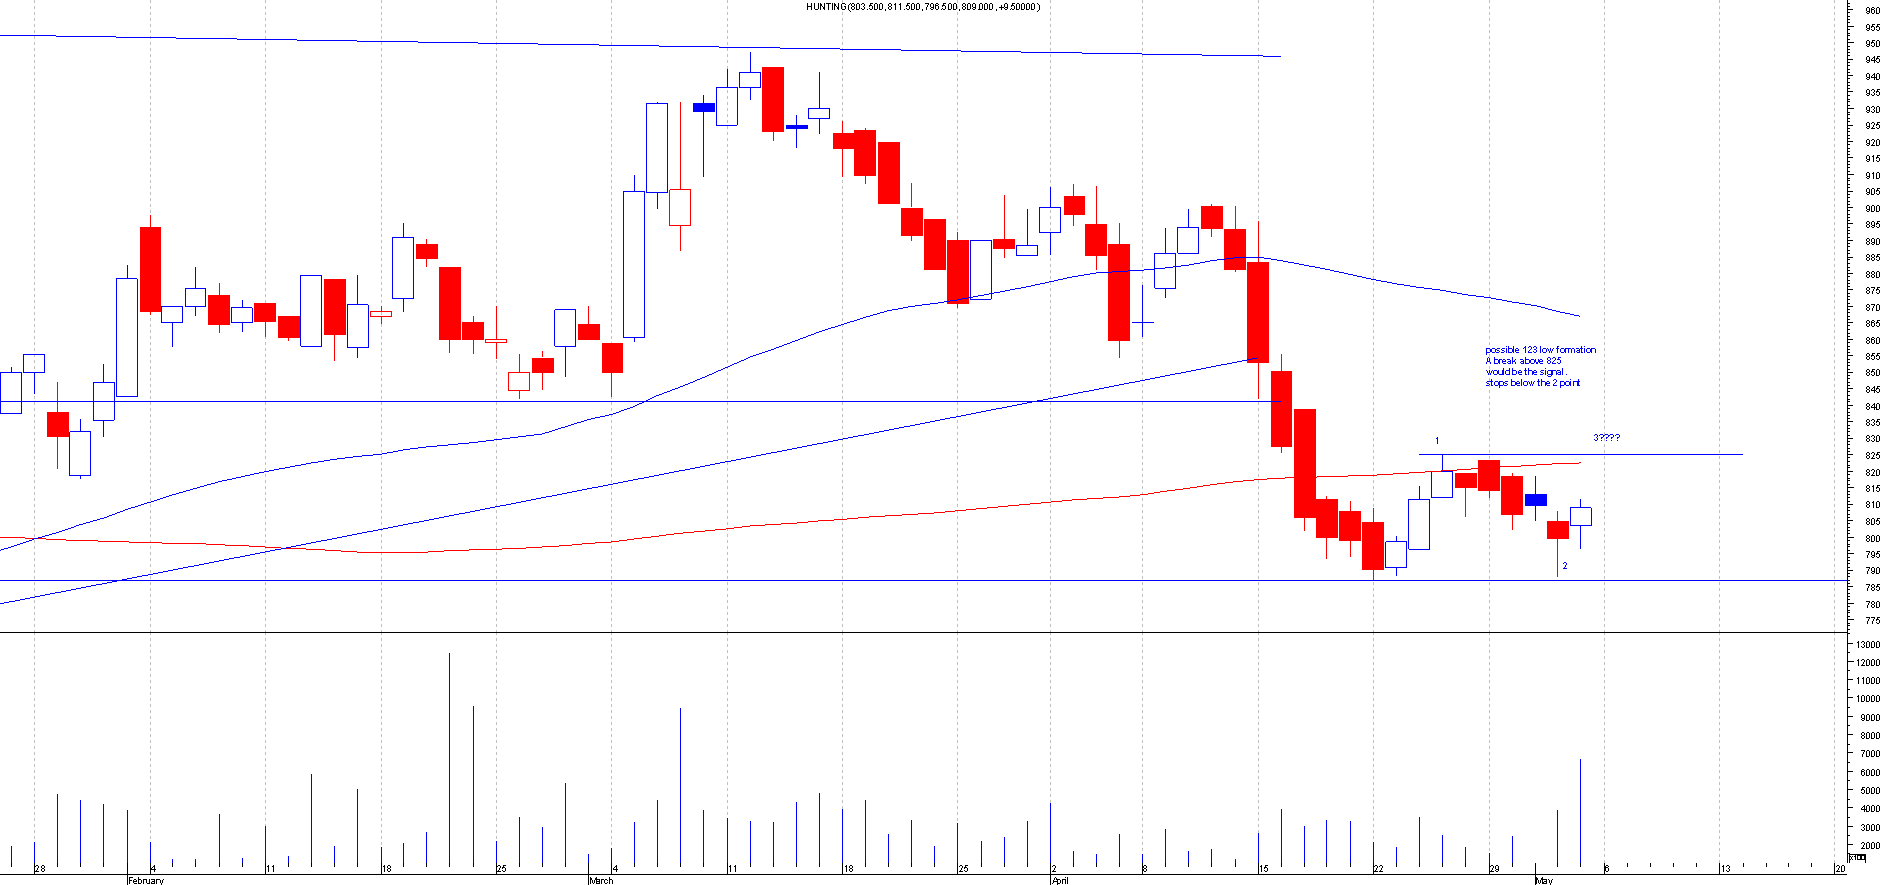
After: This broke out of the 123 low formation perfectly. If you followed the RSI indicator then that showed this breaking its trend line early so giving this an added signal. The share price then moved onto the down trend line thats been in play since the begining of march and broke through nicely.If you follow moving averages then you could tell that the 50 day moving average gives this support. This trade should be a free trade now as profits should have been taken.
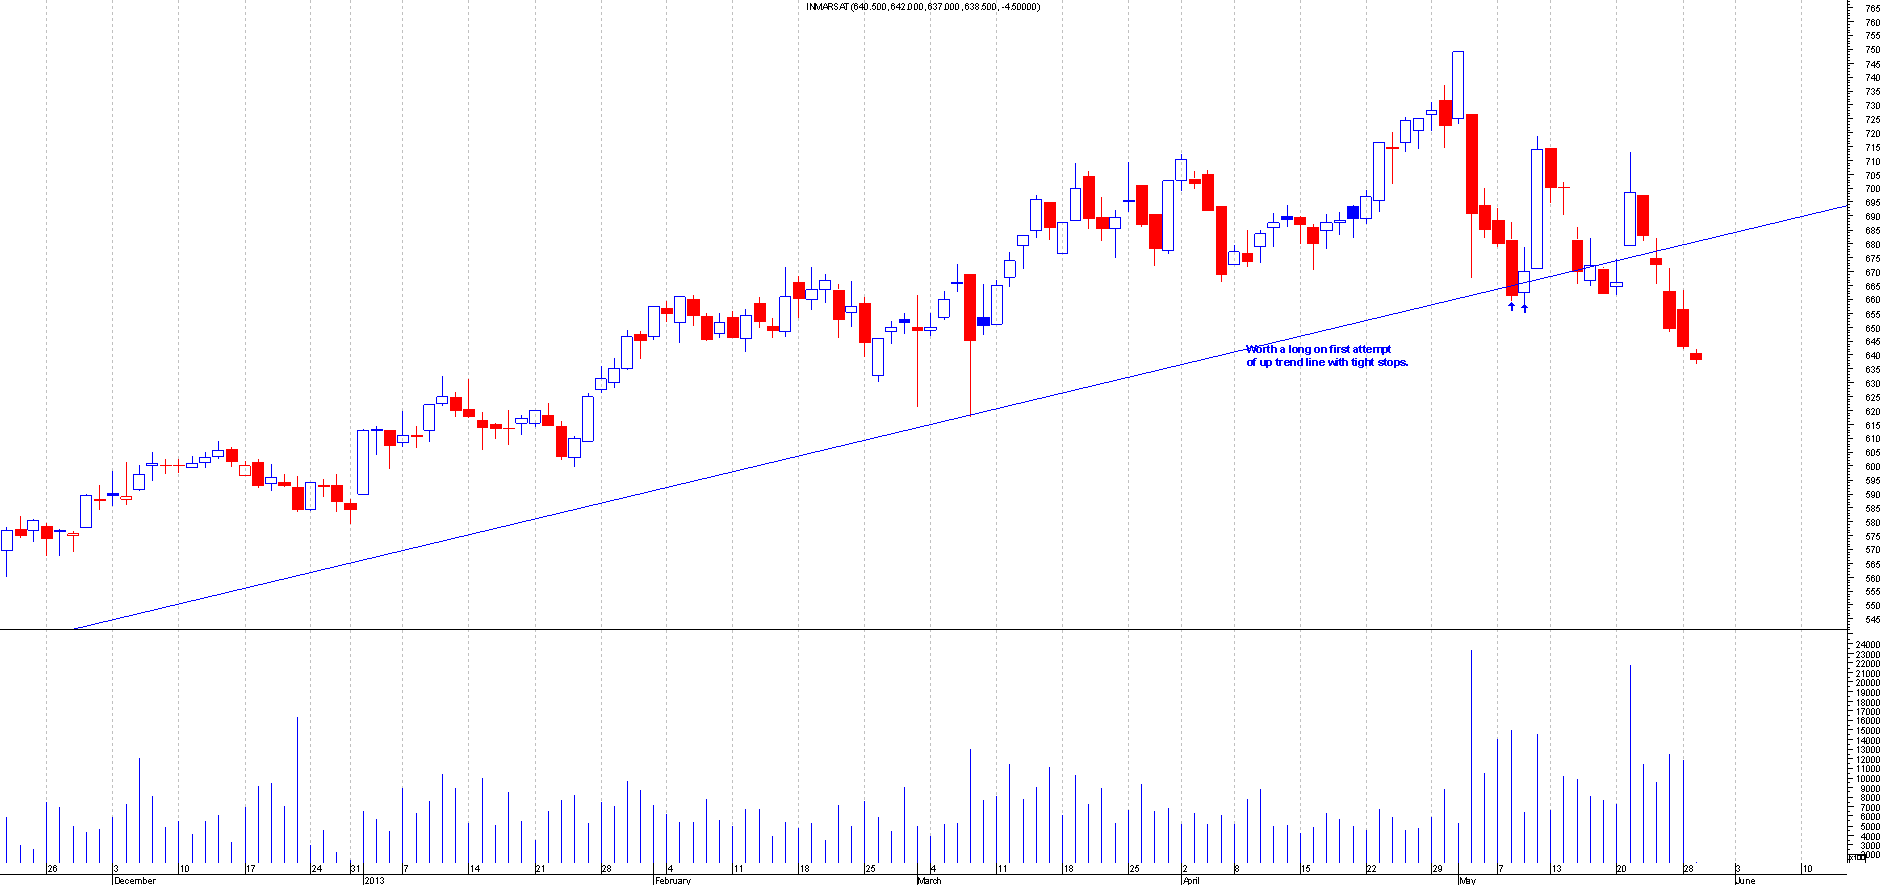
ISA.L
This is the Chart of Inmarsat when I first mentioned this:
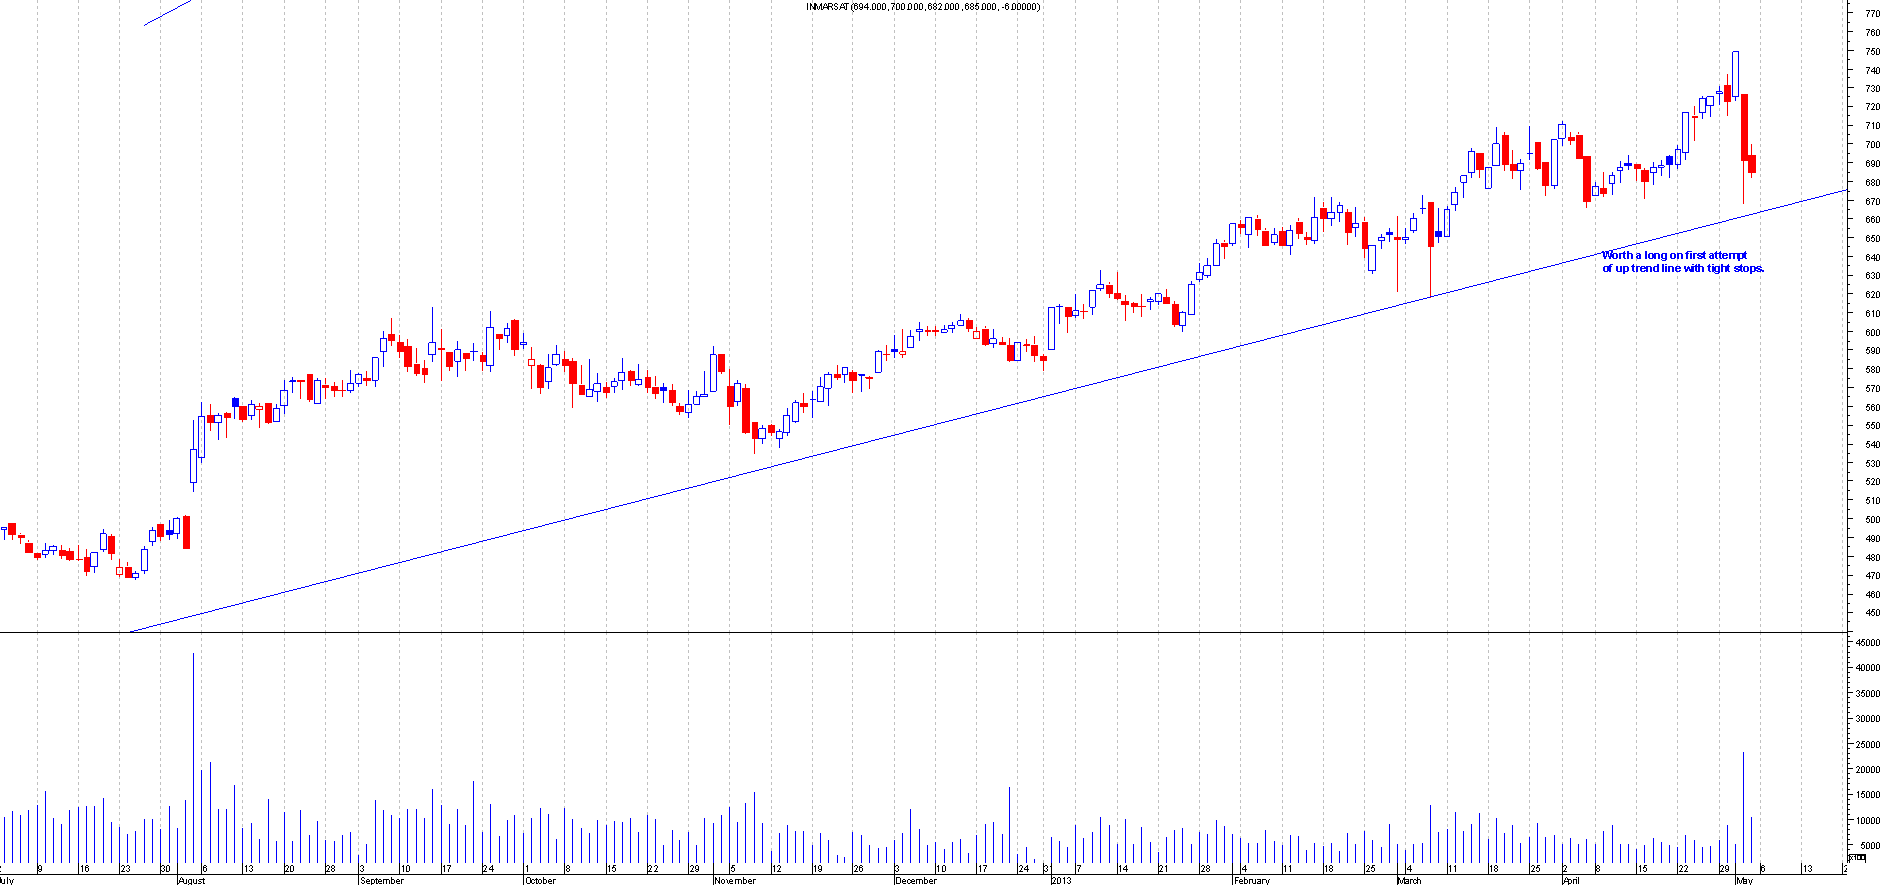
After: This touch the trend line and moved a little below that day and then followed with a bounce on the next day. This should have been a profitable trade if you left the stops untouched. Funny really as i missed this trade myself as i closed the trade due to the fact that it closed below the trend line only to kick myself the following day. I always close trades down if they finish below a trend line.I close the trades down around 4.25pm UK time just before the markets close on the day of penertration. So i missed this trade due to my own system.dohhhhhhh
13th May to 19th May
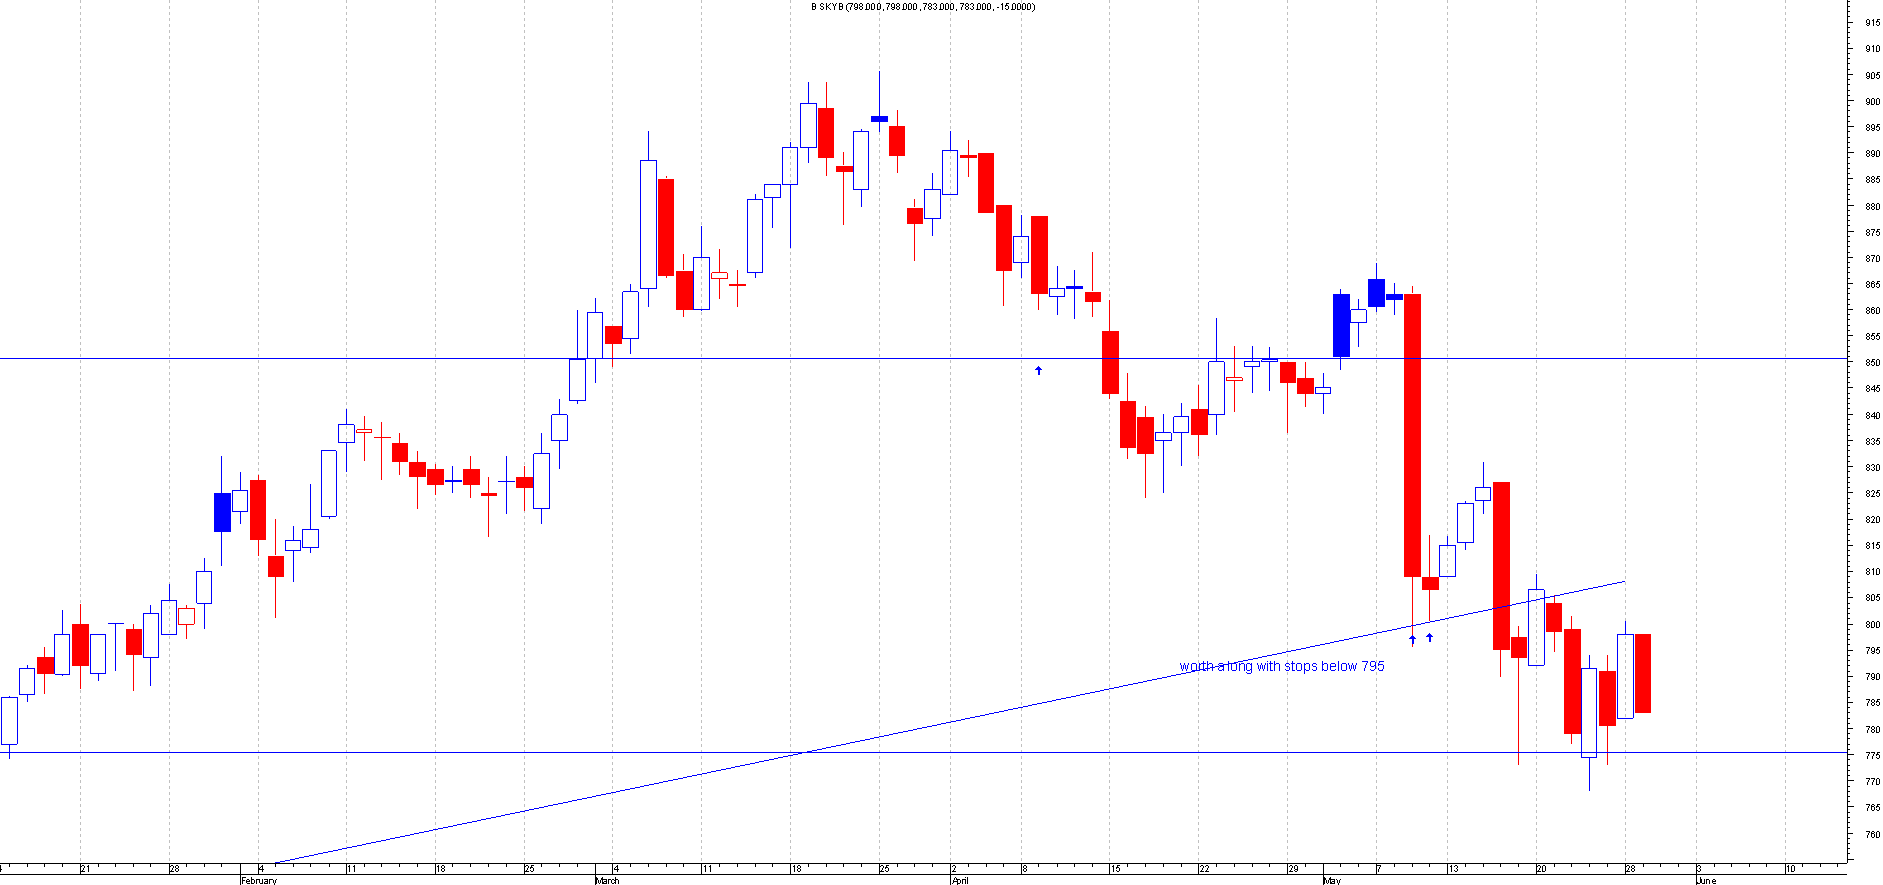
BSY.L
This is the Chart of BskyB when I first mentioned this:
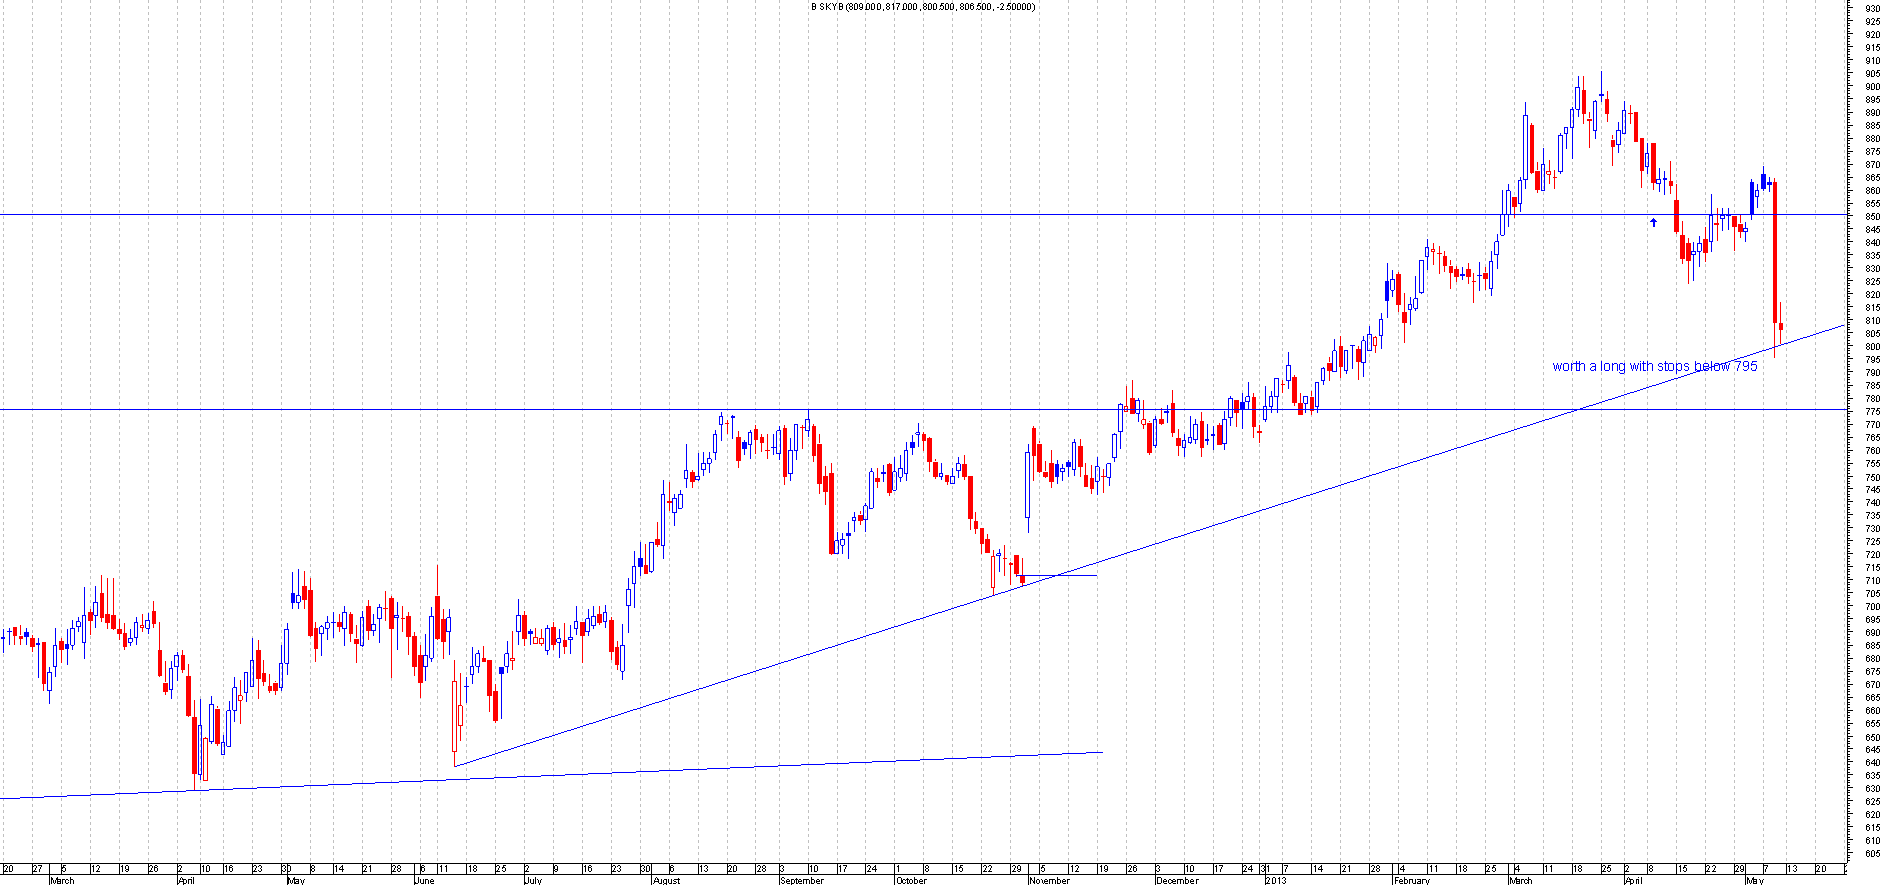
After: This bounced perfectly from the first attempt of the trend line.This moved 30 points from there. This should have been a free trade . Since the initial bounce from the trend line it went and tested it again but this time it went through. Thats why my first attempt method means exactly that.Only ever do the trade on a first attempt basis.
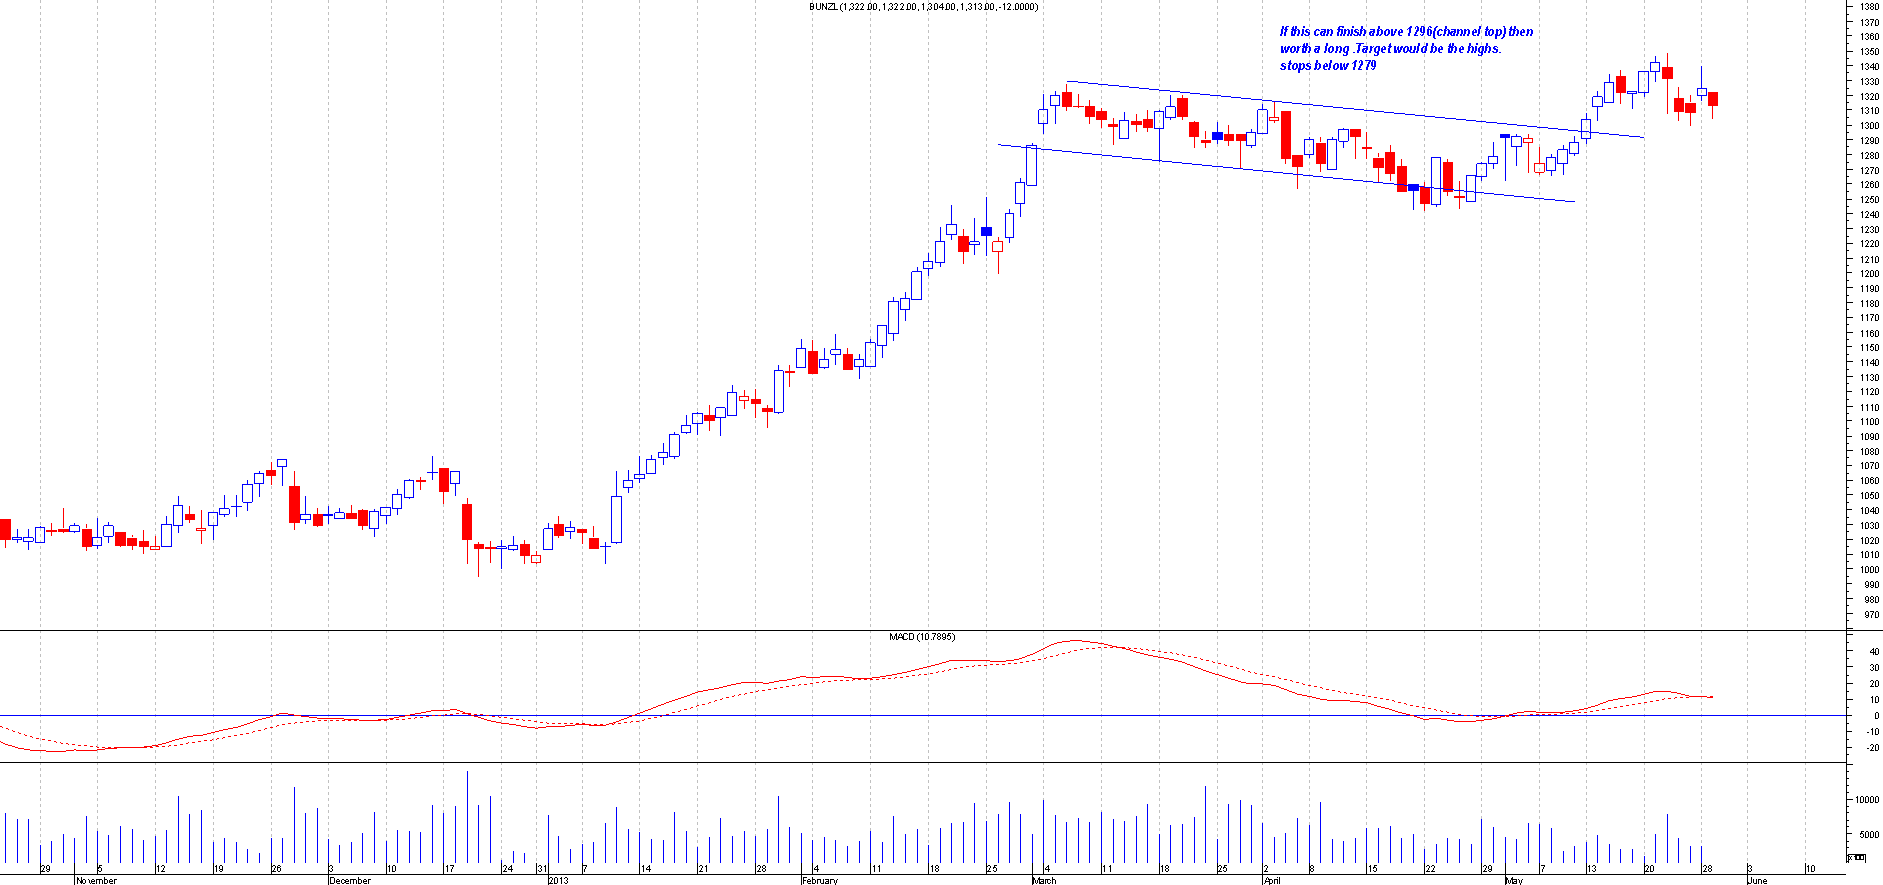
BNZL.L
This is the Chart of Bunzl when I first mentioned this:
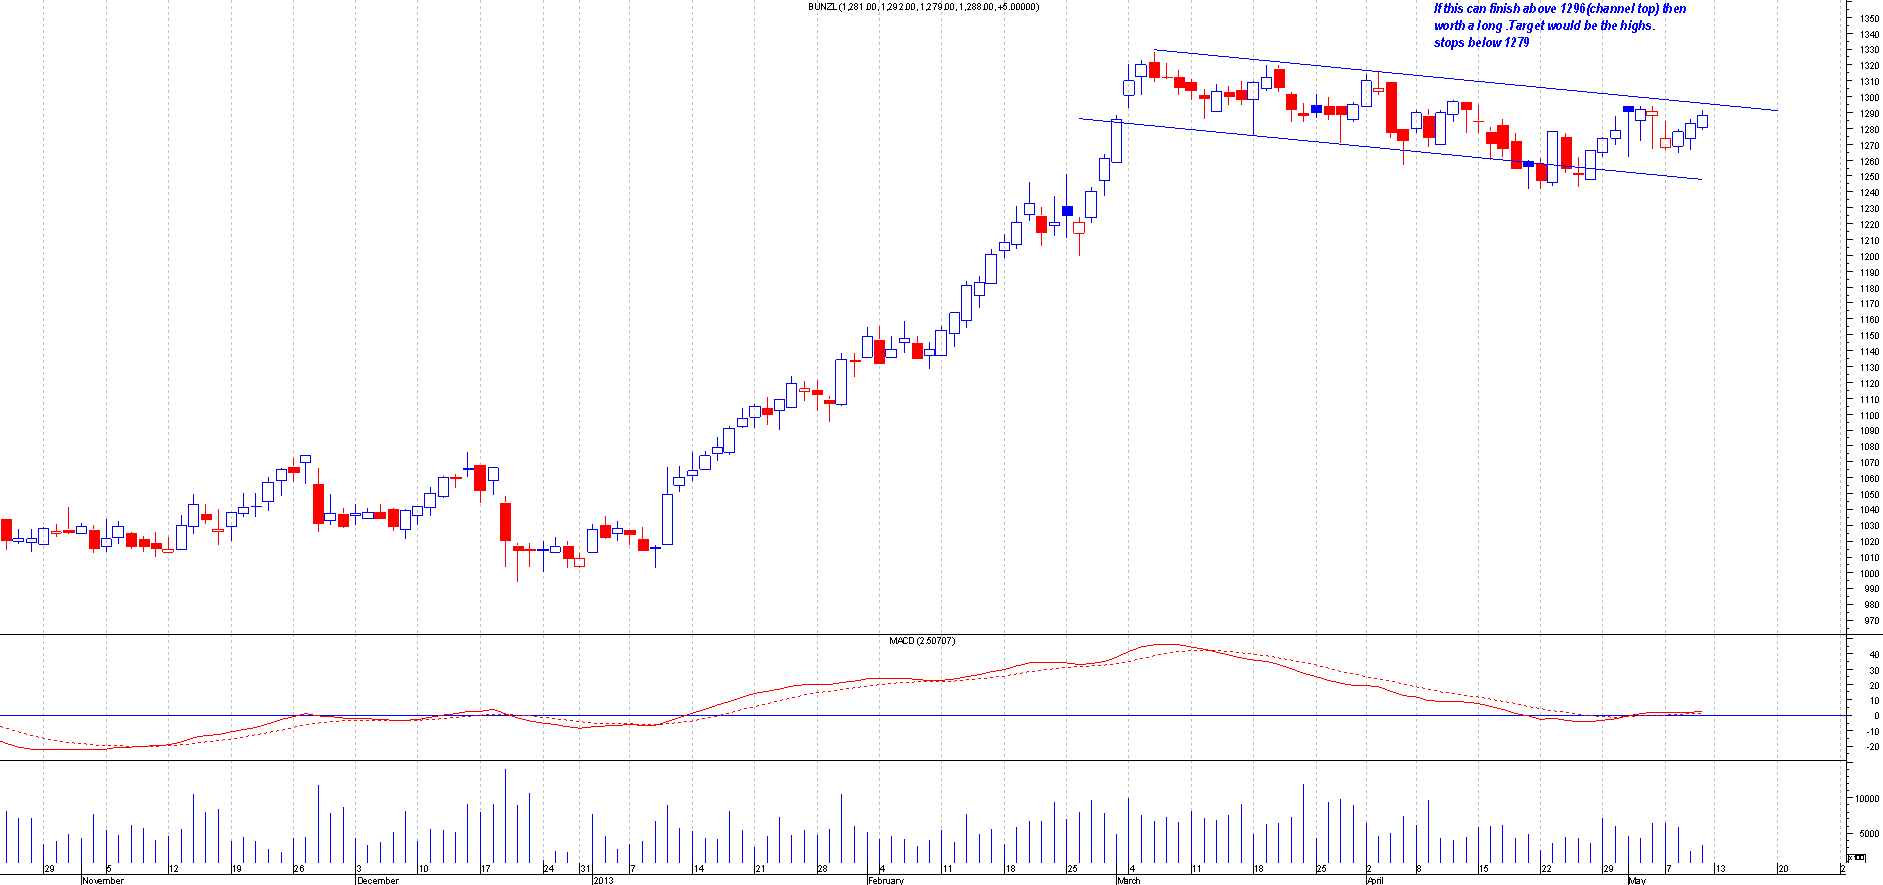
After: This broke out nicely from the range and hit the target that i mentioned. The trading range . This moved 55 points + so a perfect trade.
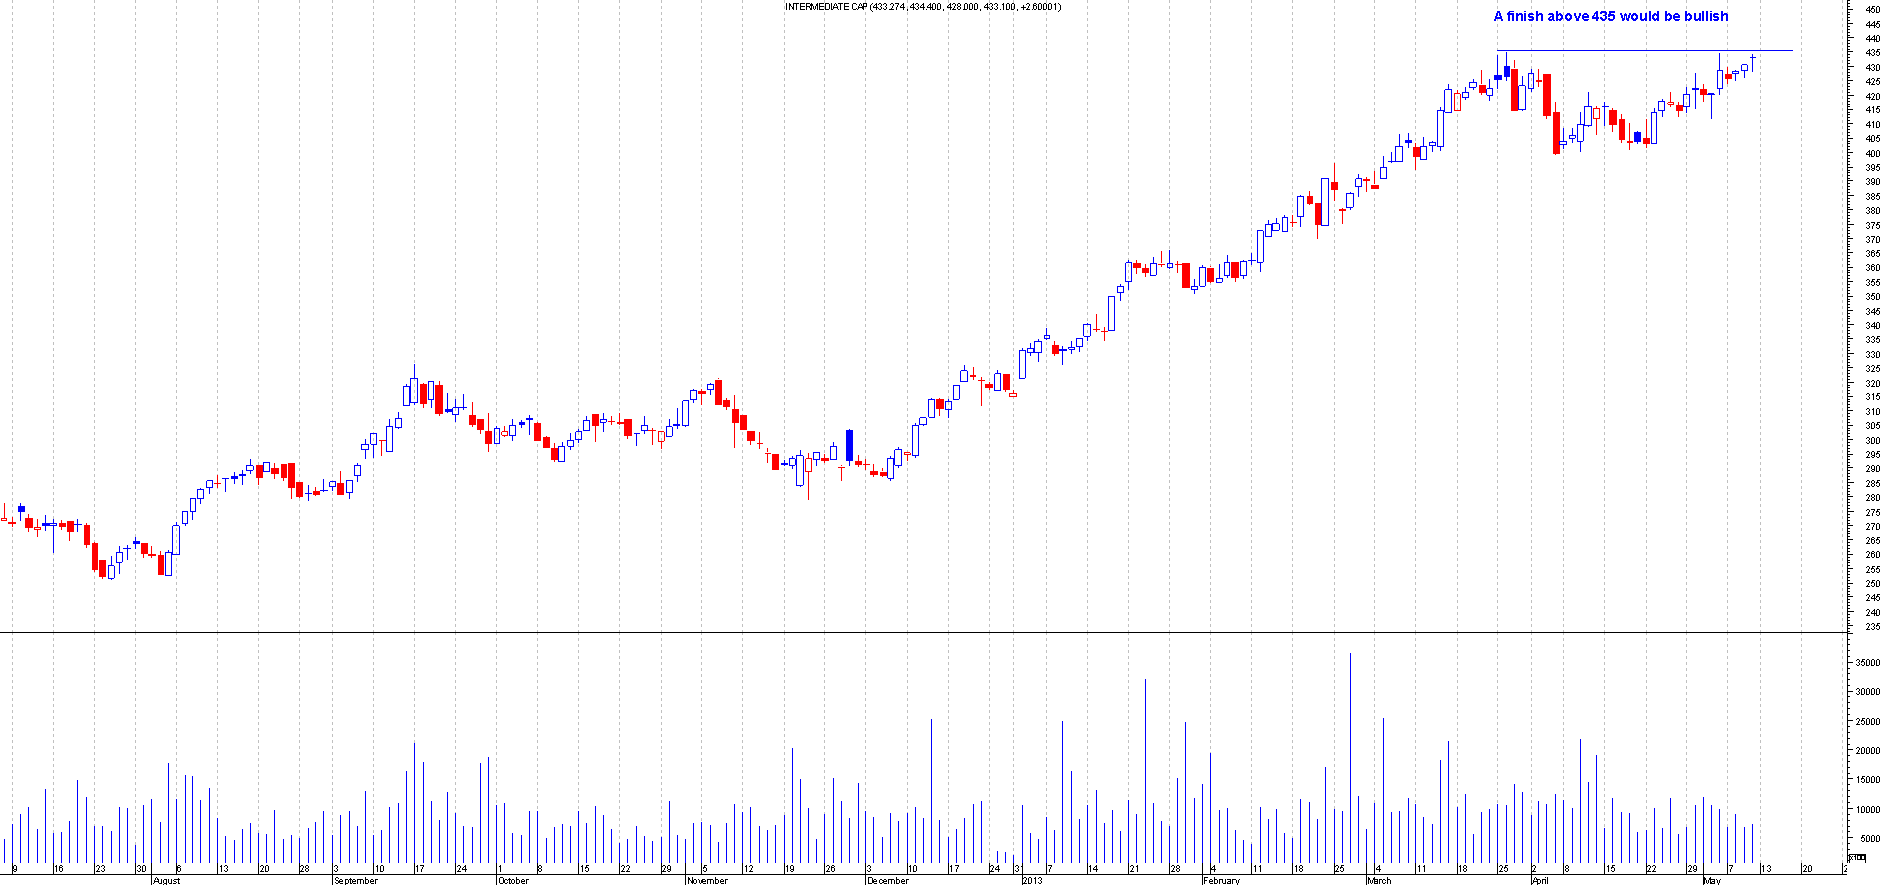
ICP.L
This is the Chart of Intermediate Cap when I first mentioned this:
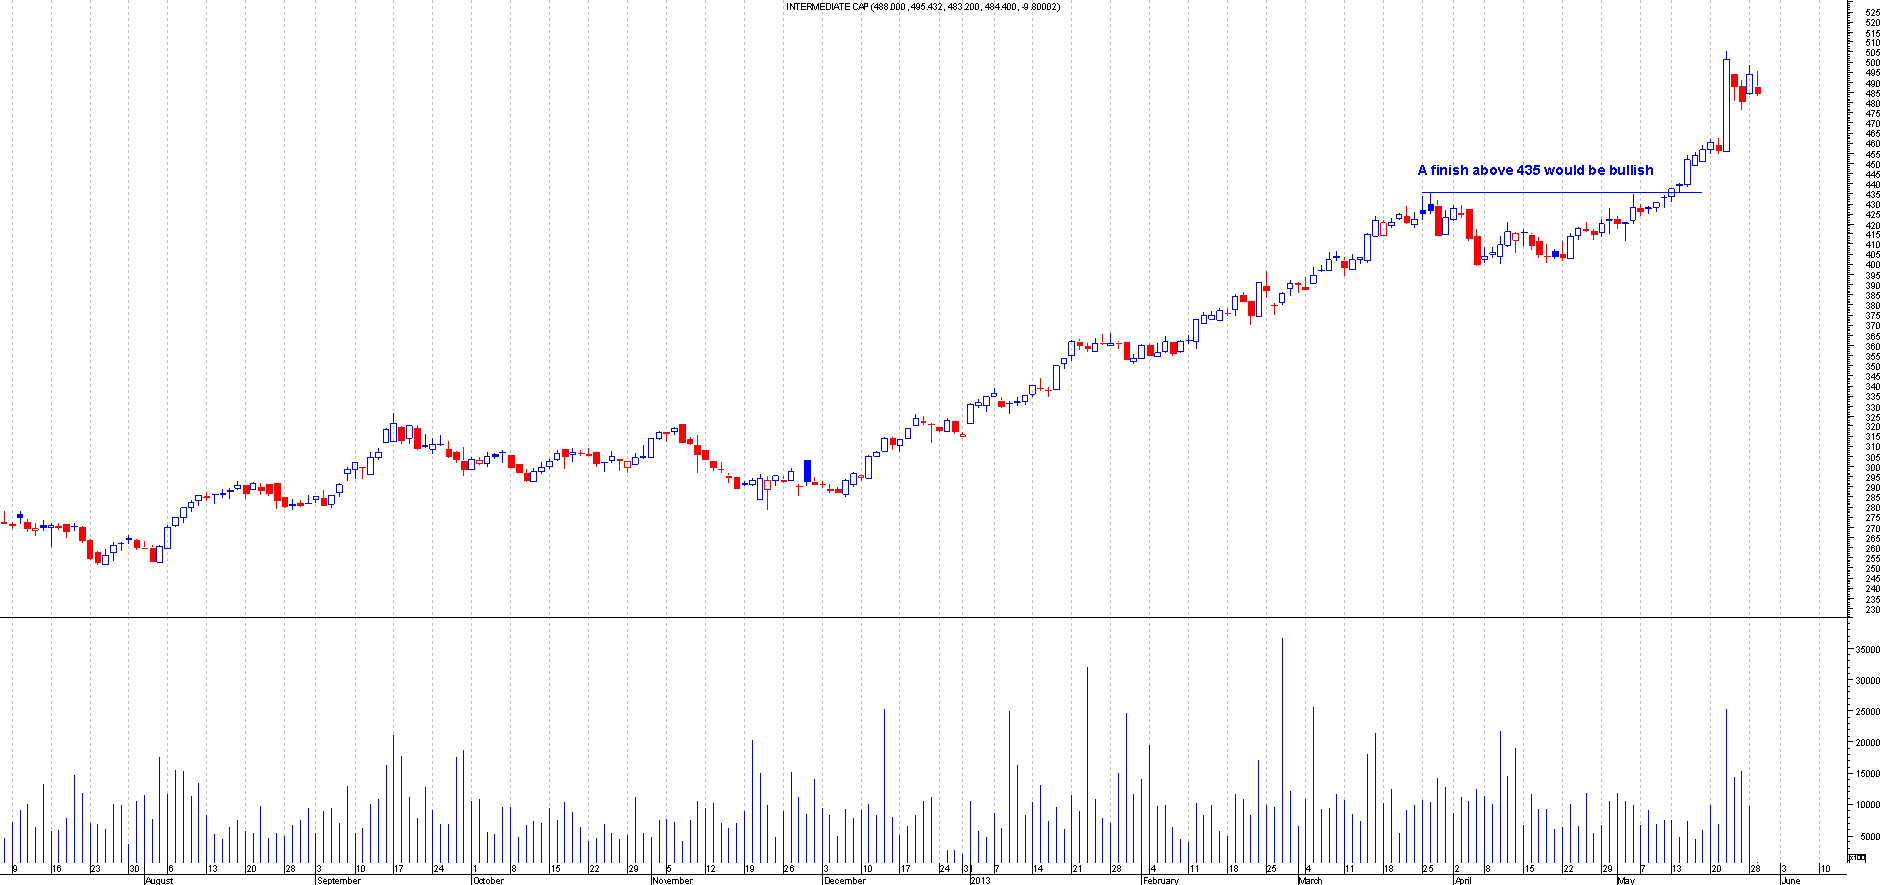
After: This broke out beautifully and had moved a lot higher from the breakout point.This moved 70+ points .This should be a free trade now.
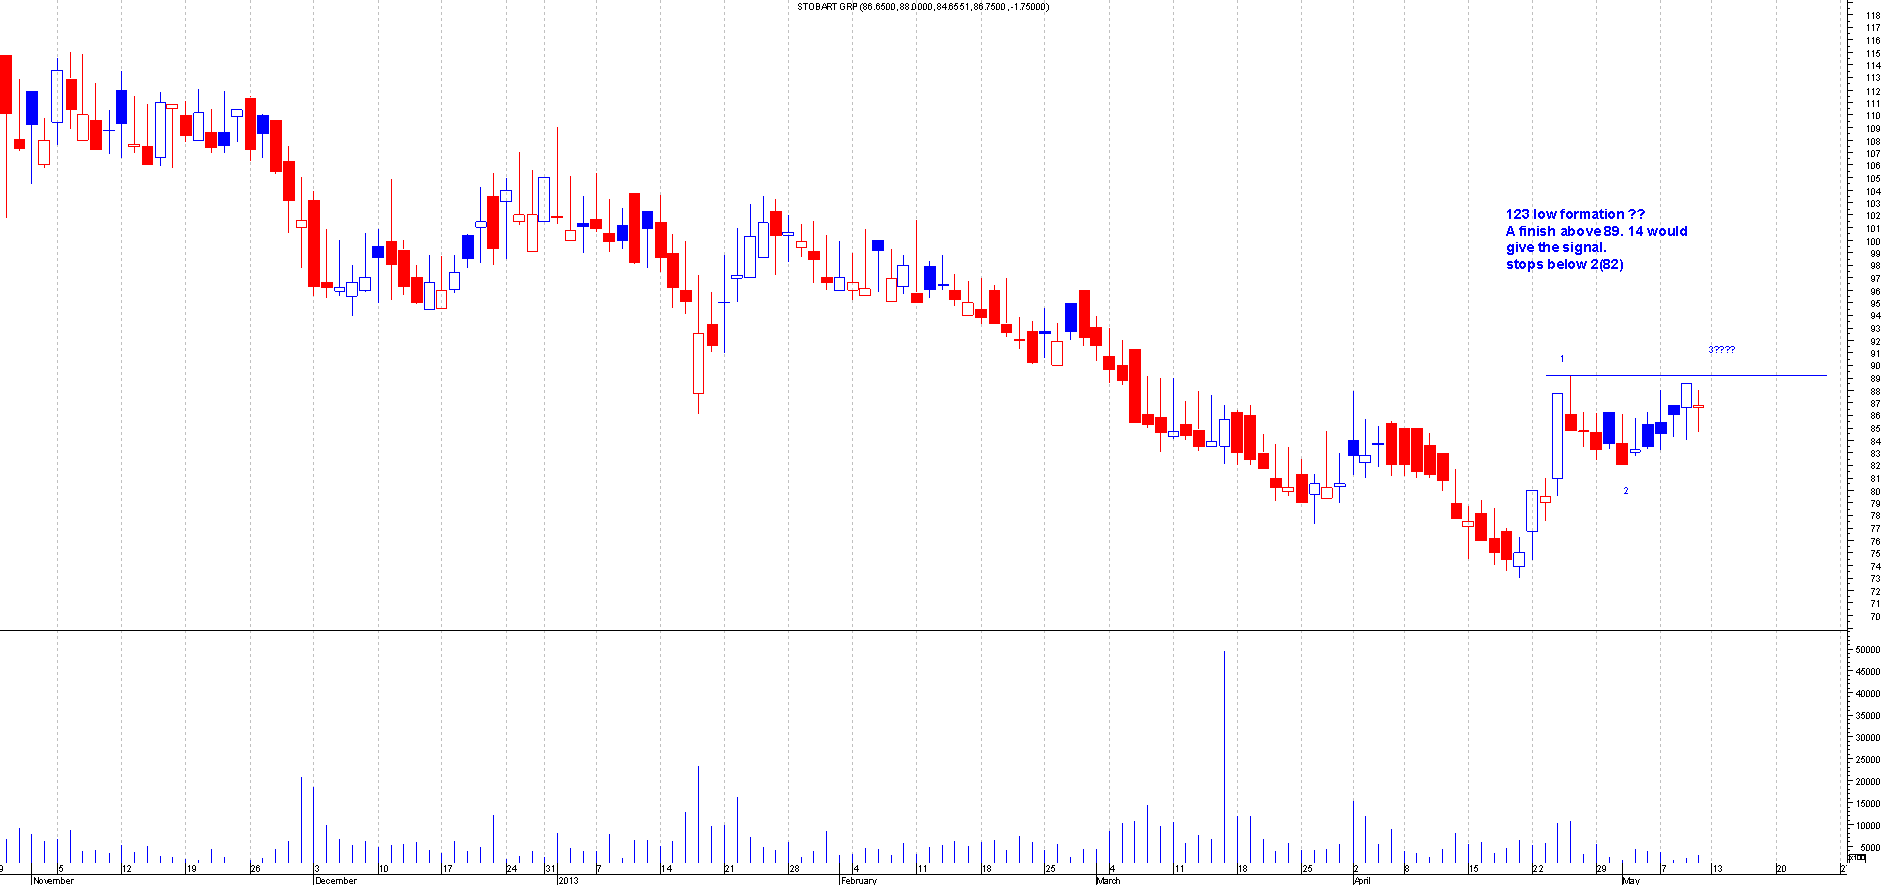
STOB.L
This is the Chart of Stobart when I first mentioned this:
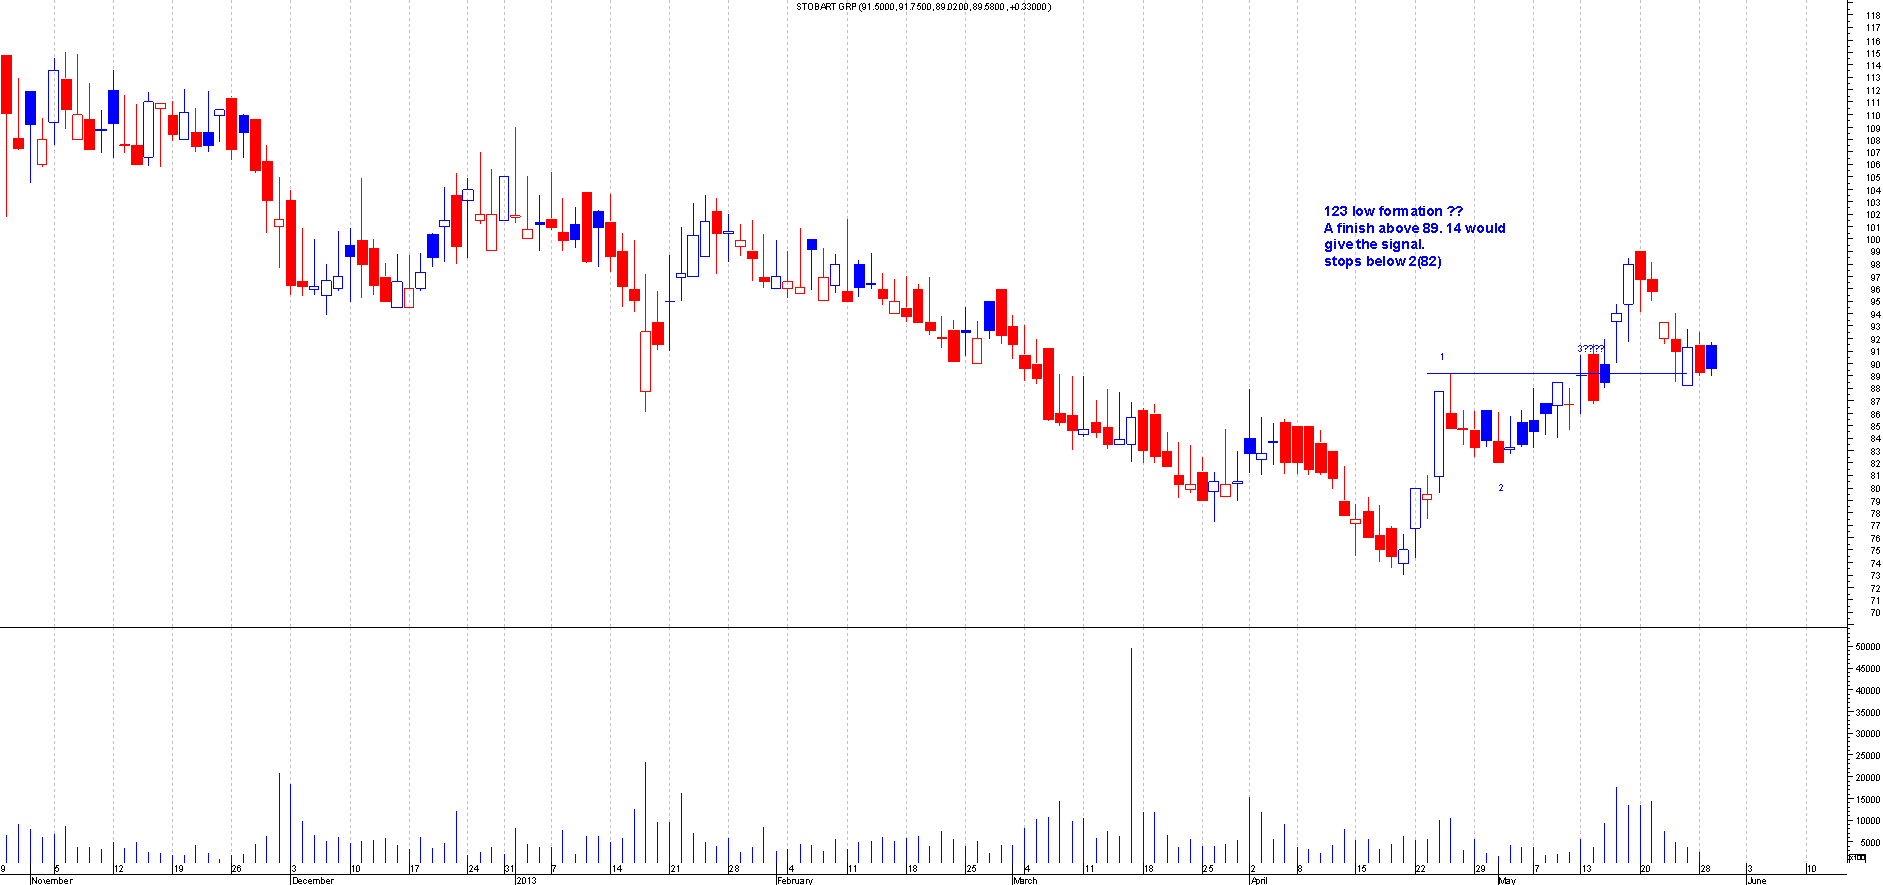
After: This broke out of the 123 low formation and moved higher. This should be a free trade.
20th May to 26th May
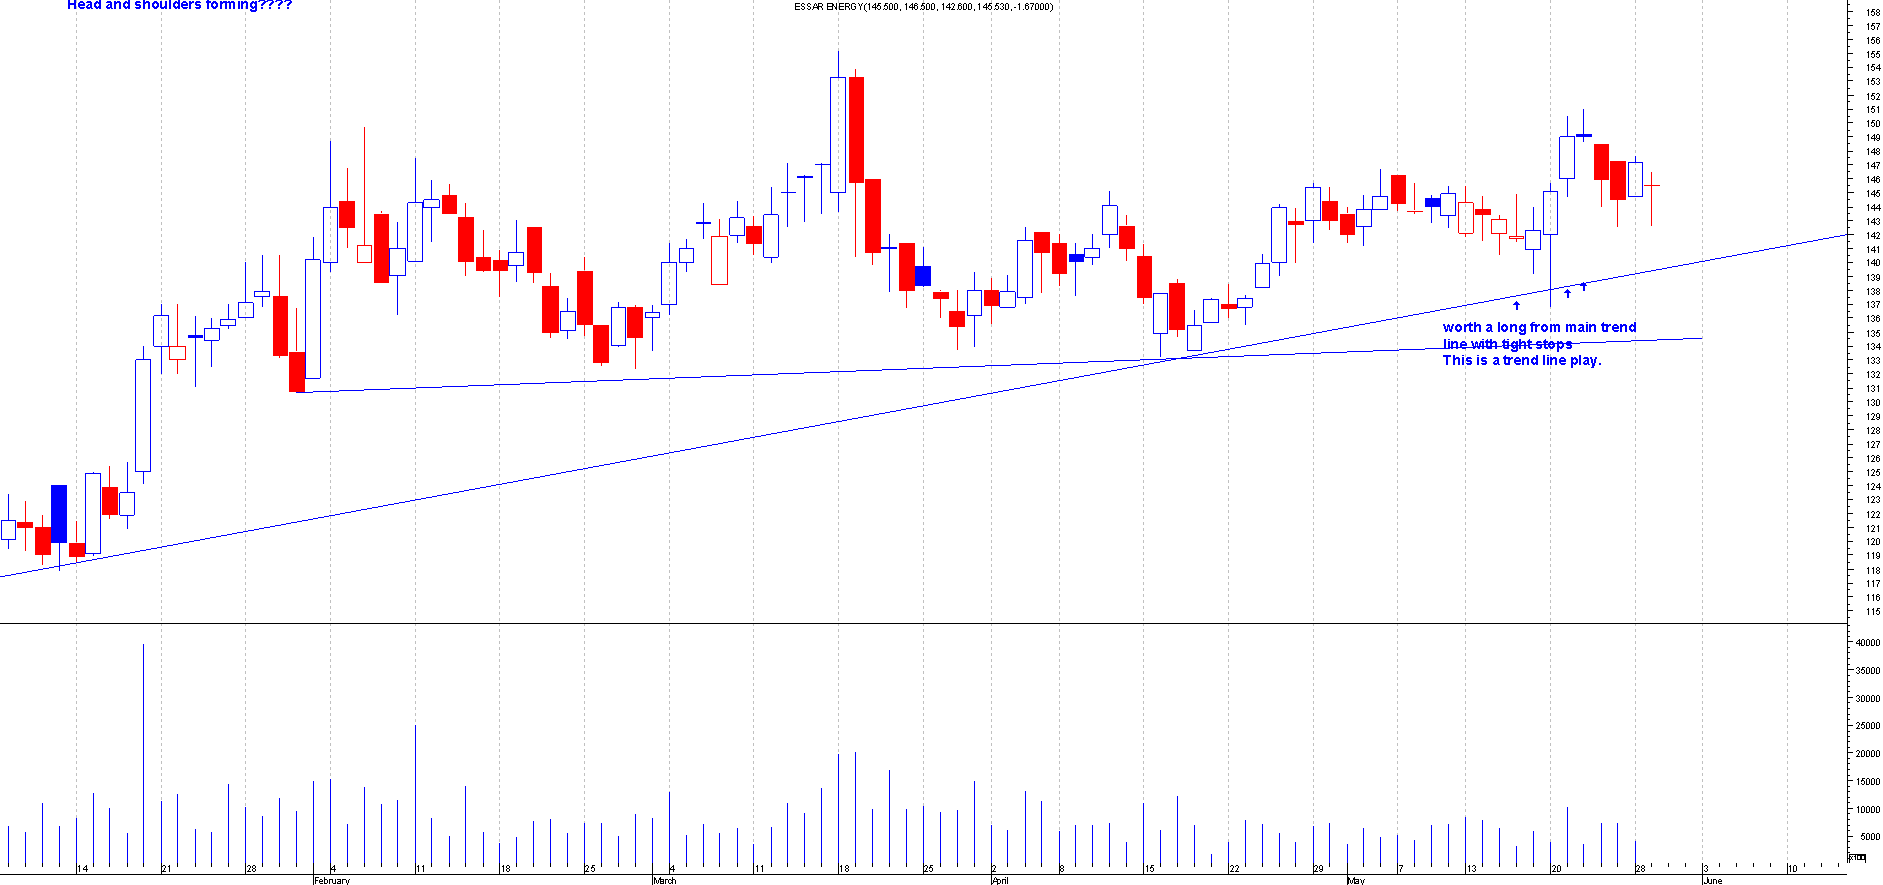
ESSR.L
This is the Chart of Essar energy when I first mentioned this:
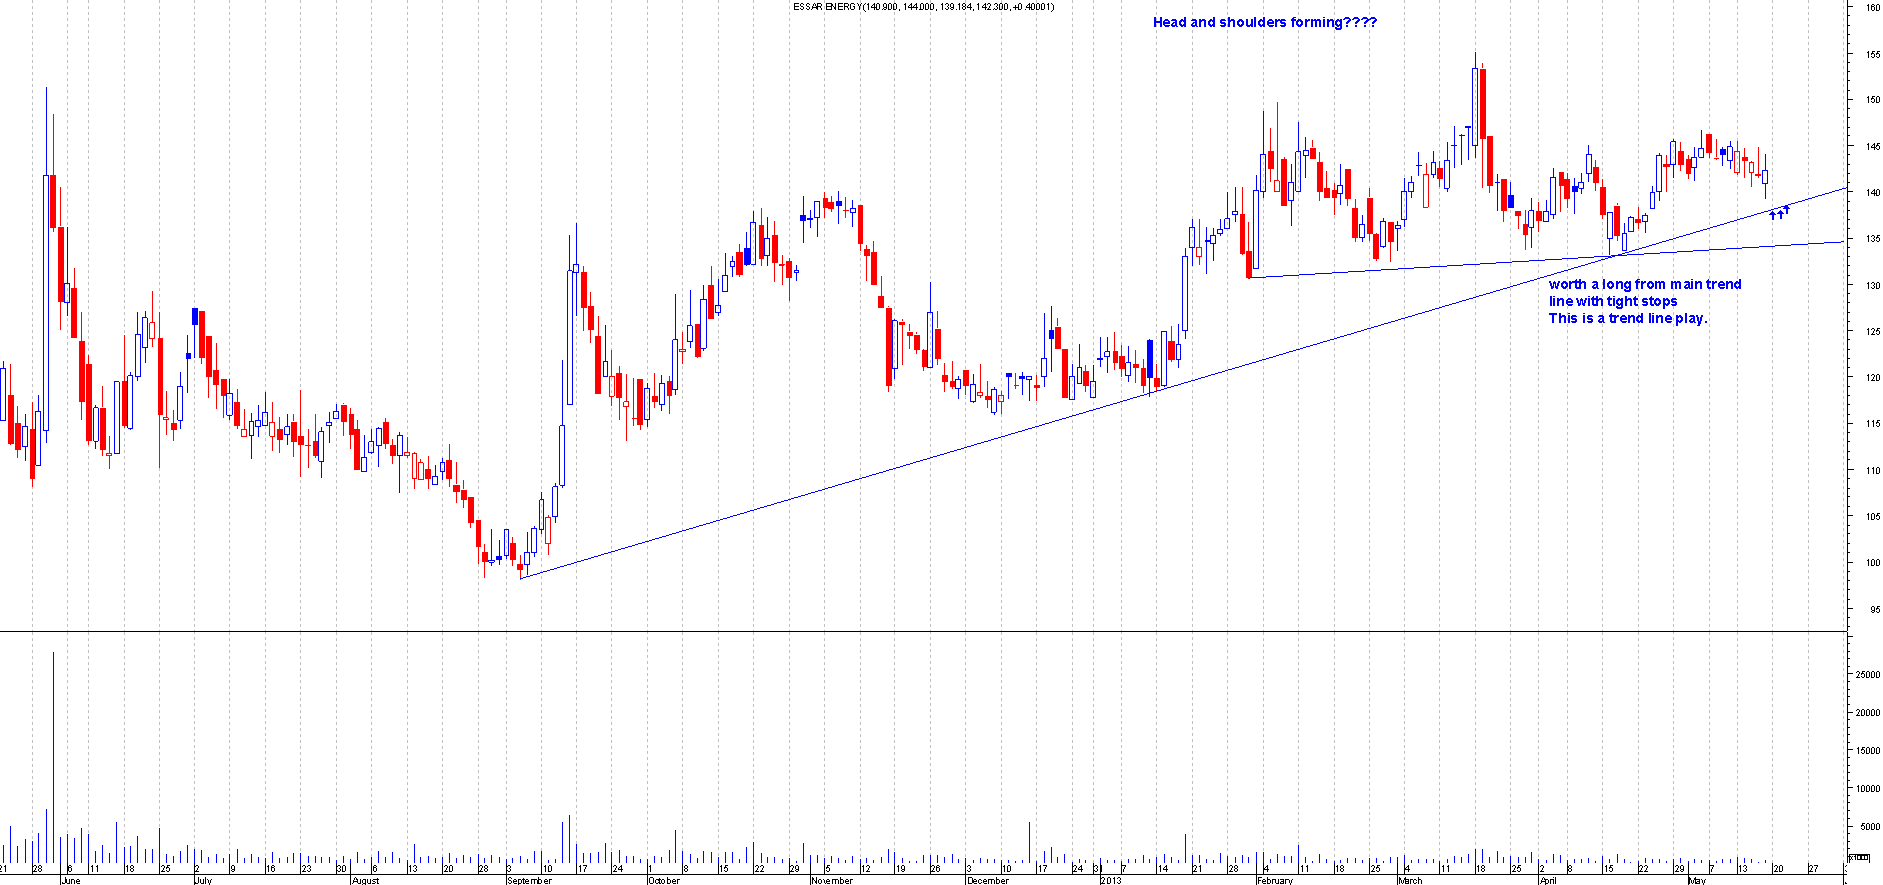
After: This bounced inch perfectly from the trend line .This was a trade based on the firts attempt basis. This worked out great and should be a free trade now.
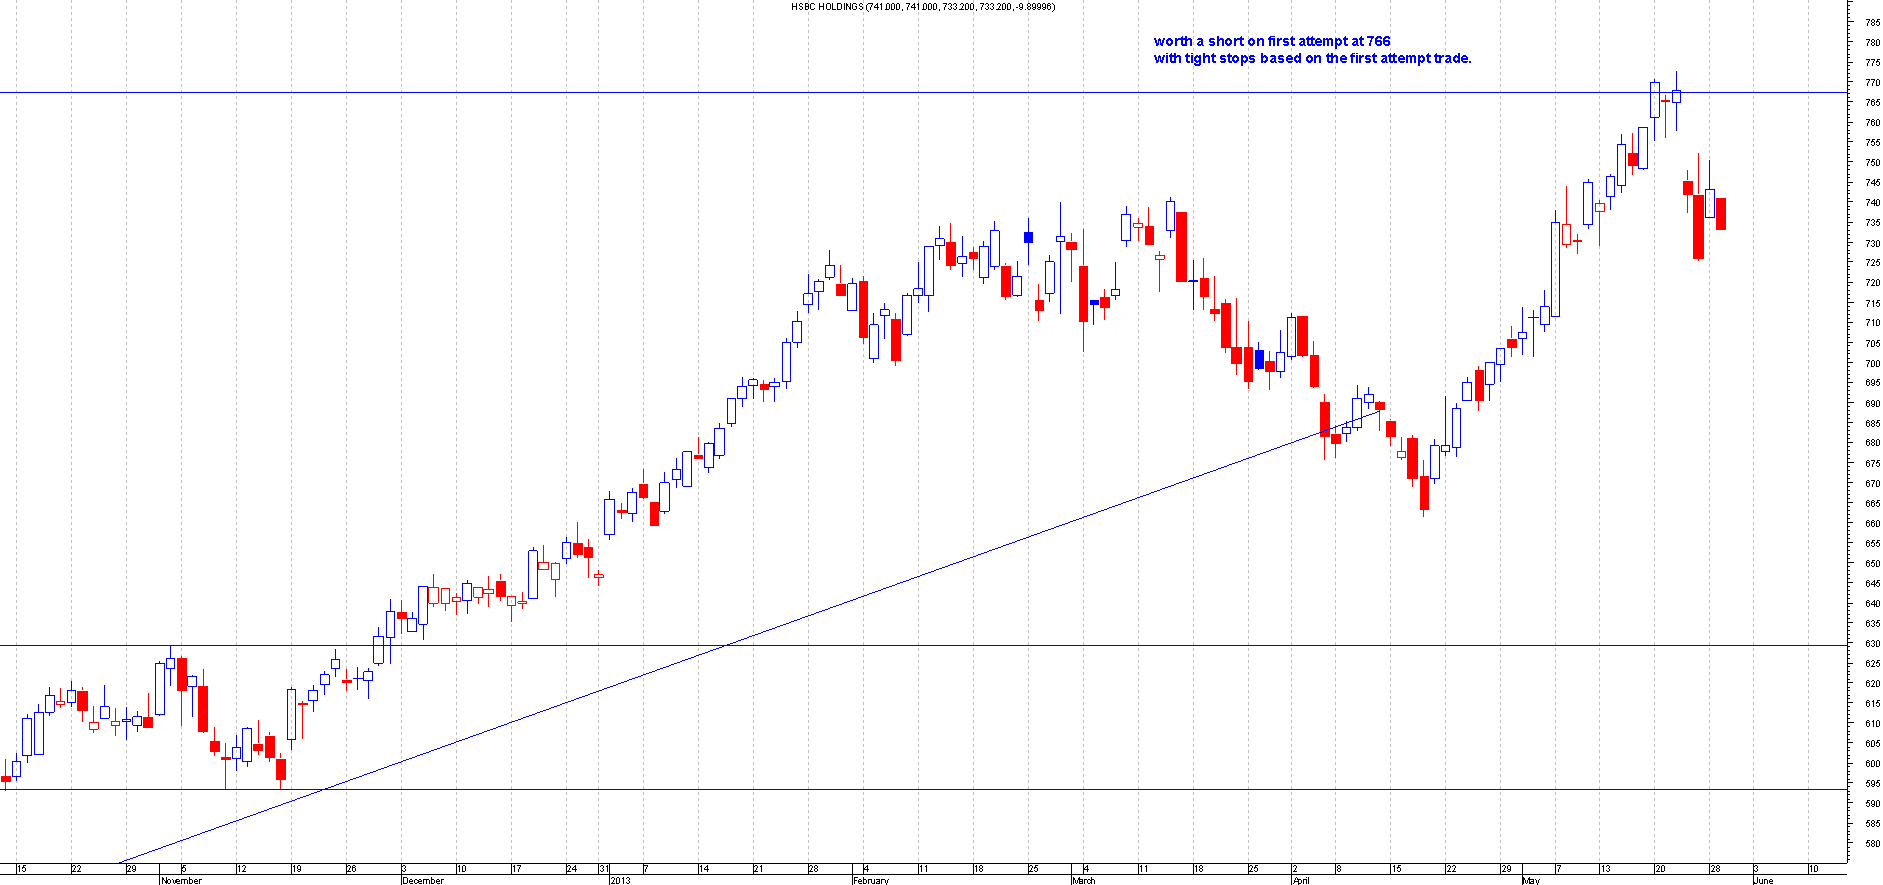
HSBA.L
This is the Chart of HSBC when I first mentioned this:
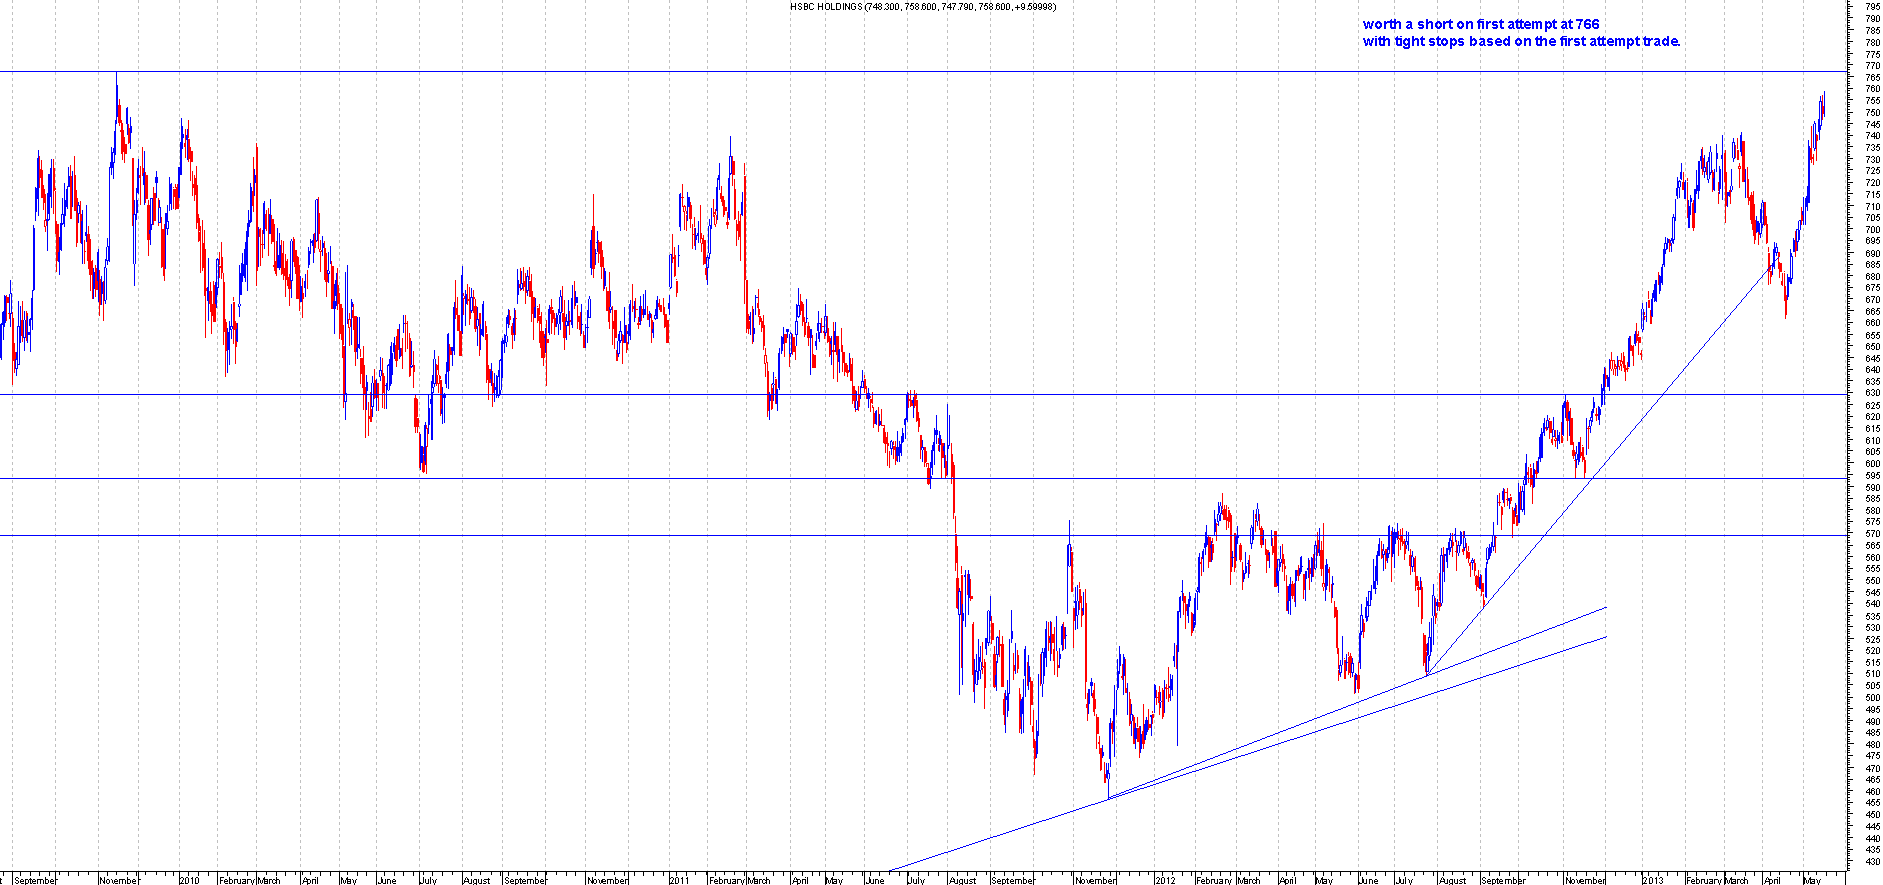
After: This was a perfect short based on a first attempt basis of a strong resistance area. This is why its crucial to be able to plot supports and resistances. Even the the trend was up and i was going against the trend this trade was very profitable. This was based on day trading as you would not be shorting based on long term as its going against the trend. This should be a free trade now.
PSON.L
This is the Chart of Pearson when I first mentioned this:
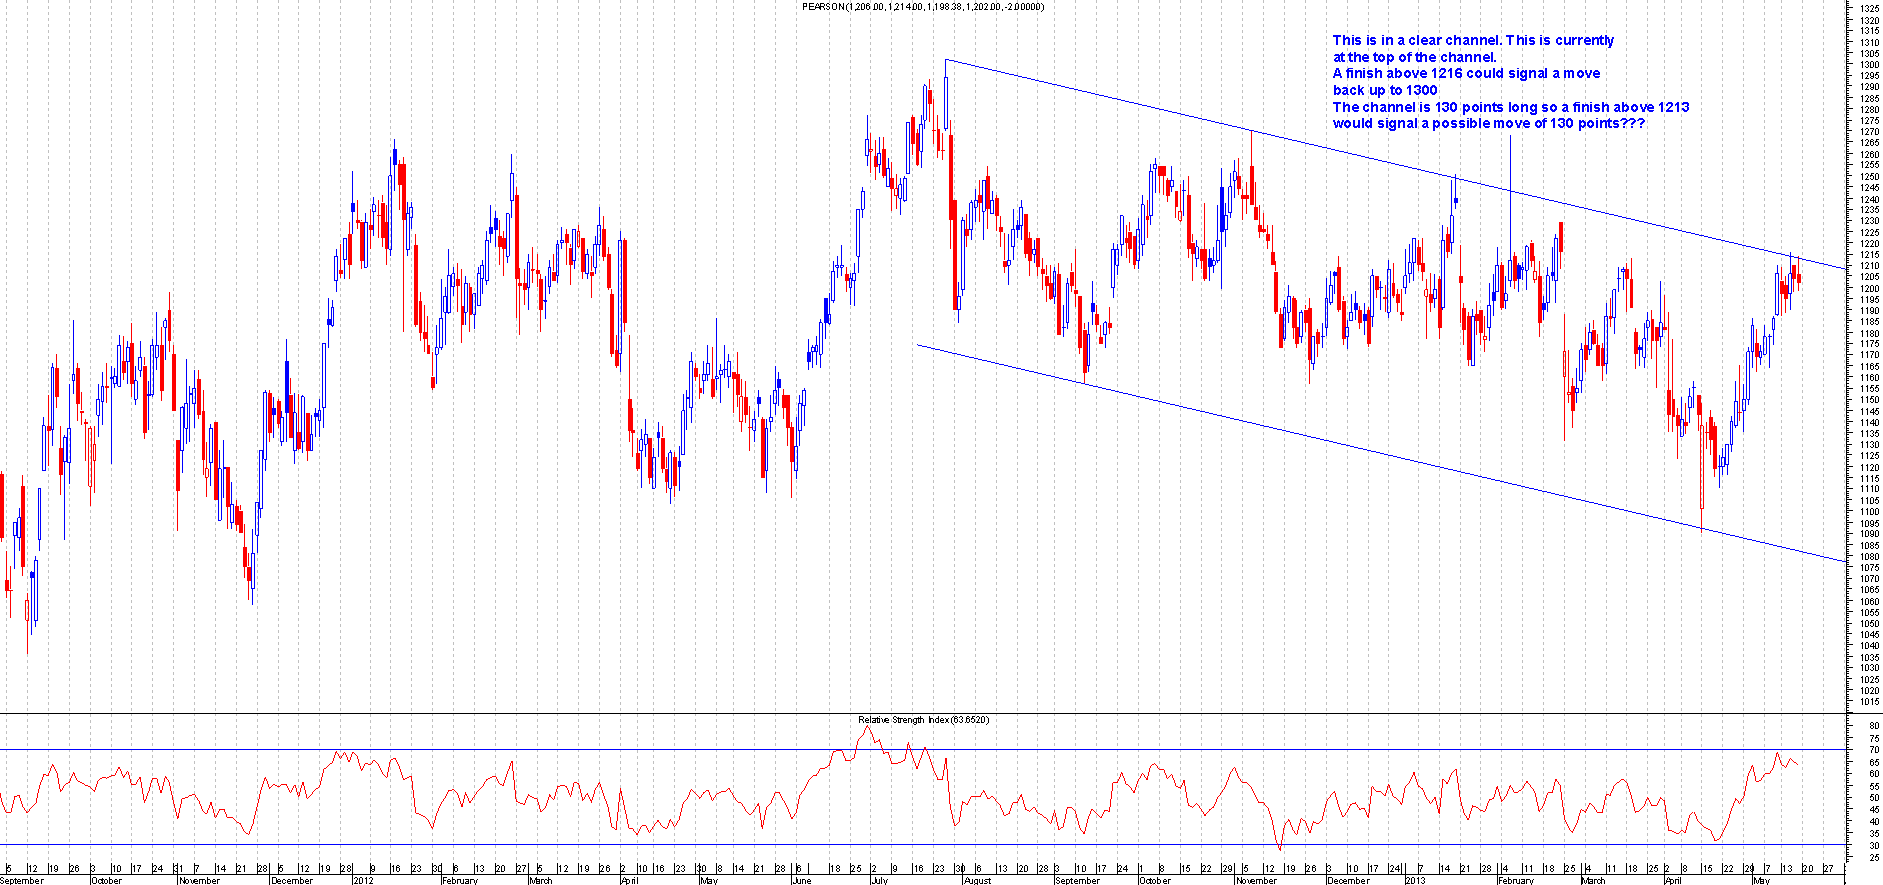
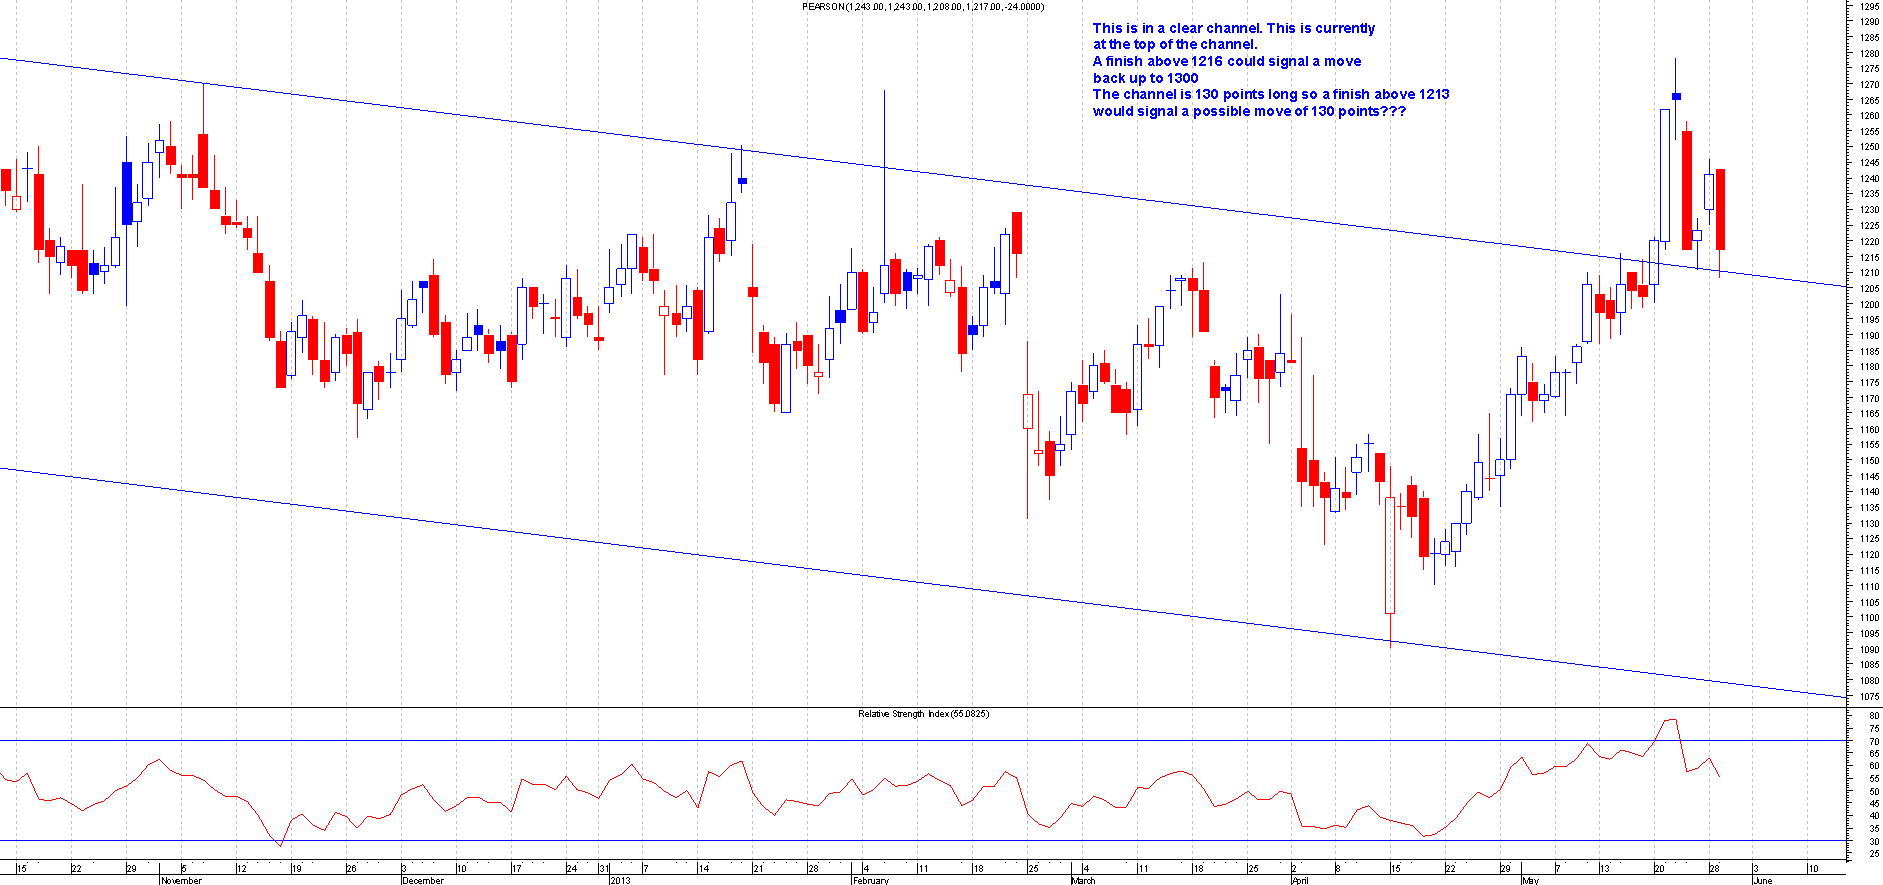
After: This broke out perfectly and moved swiftly higher .This then came back and tested the same level so i managed to re-enter on a back test. So made 2 sets of profits on this.
TLPR.L
This is the Chart of Tullett Prebon when I first mentioned this:
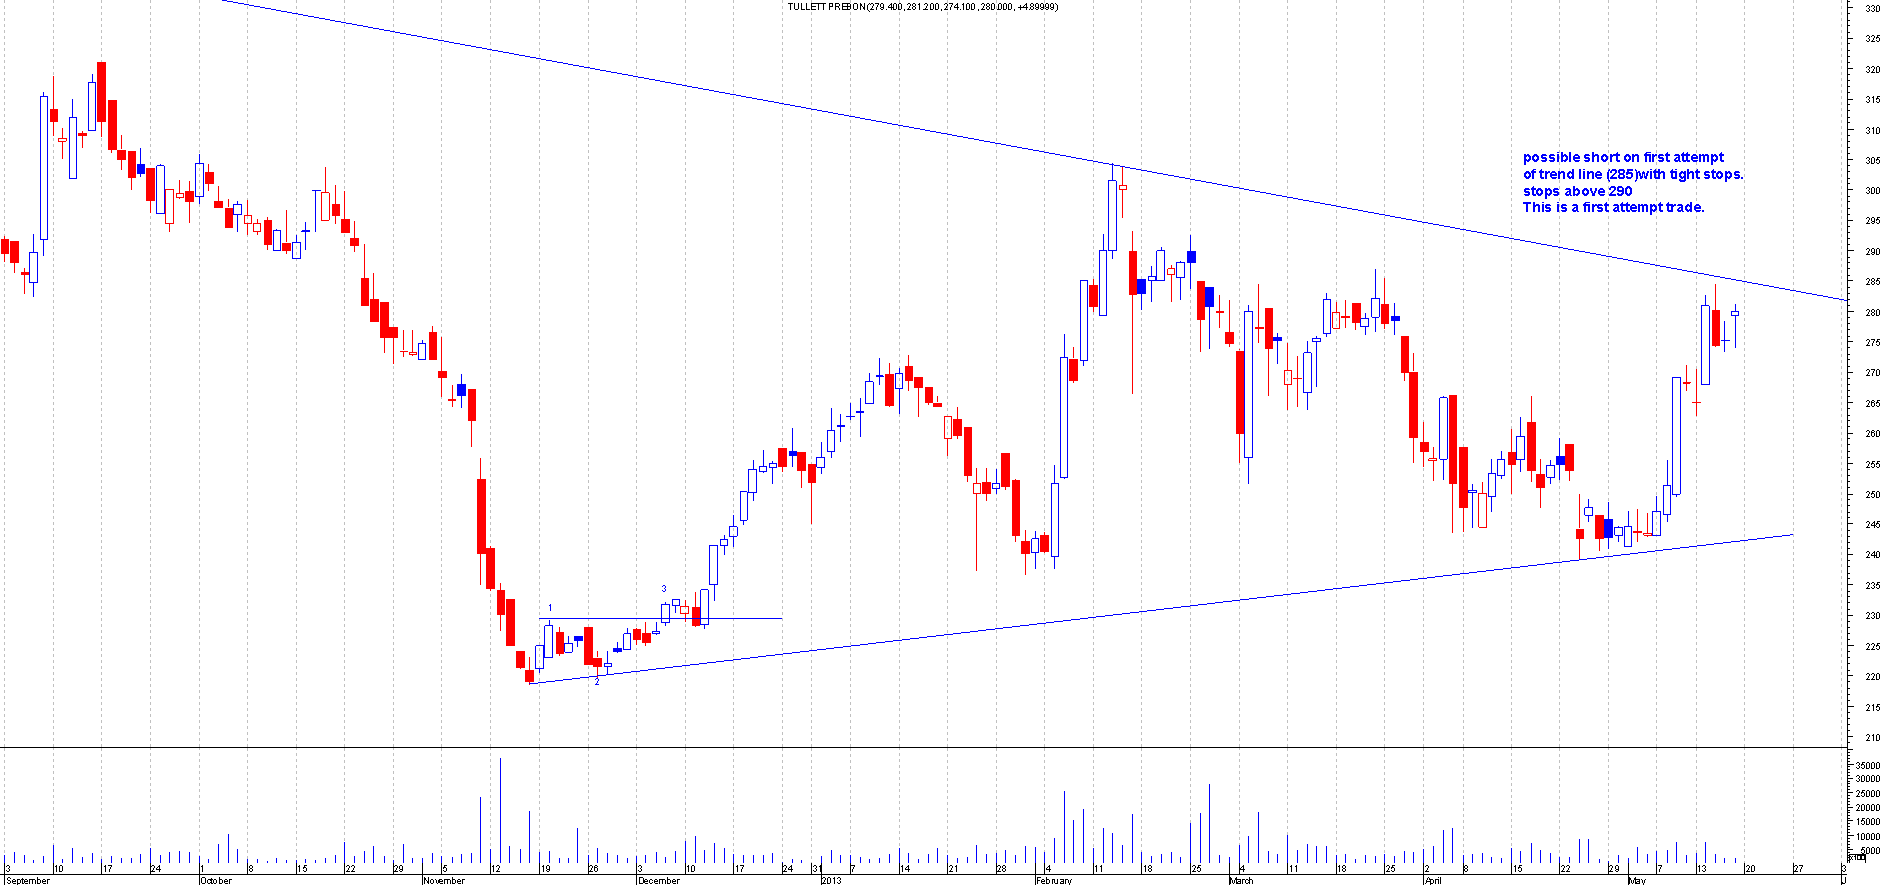
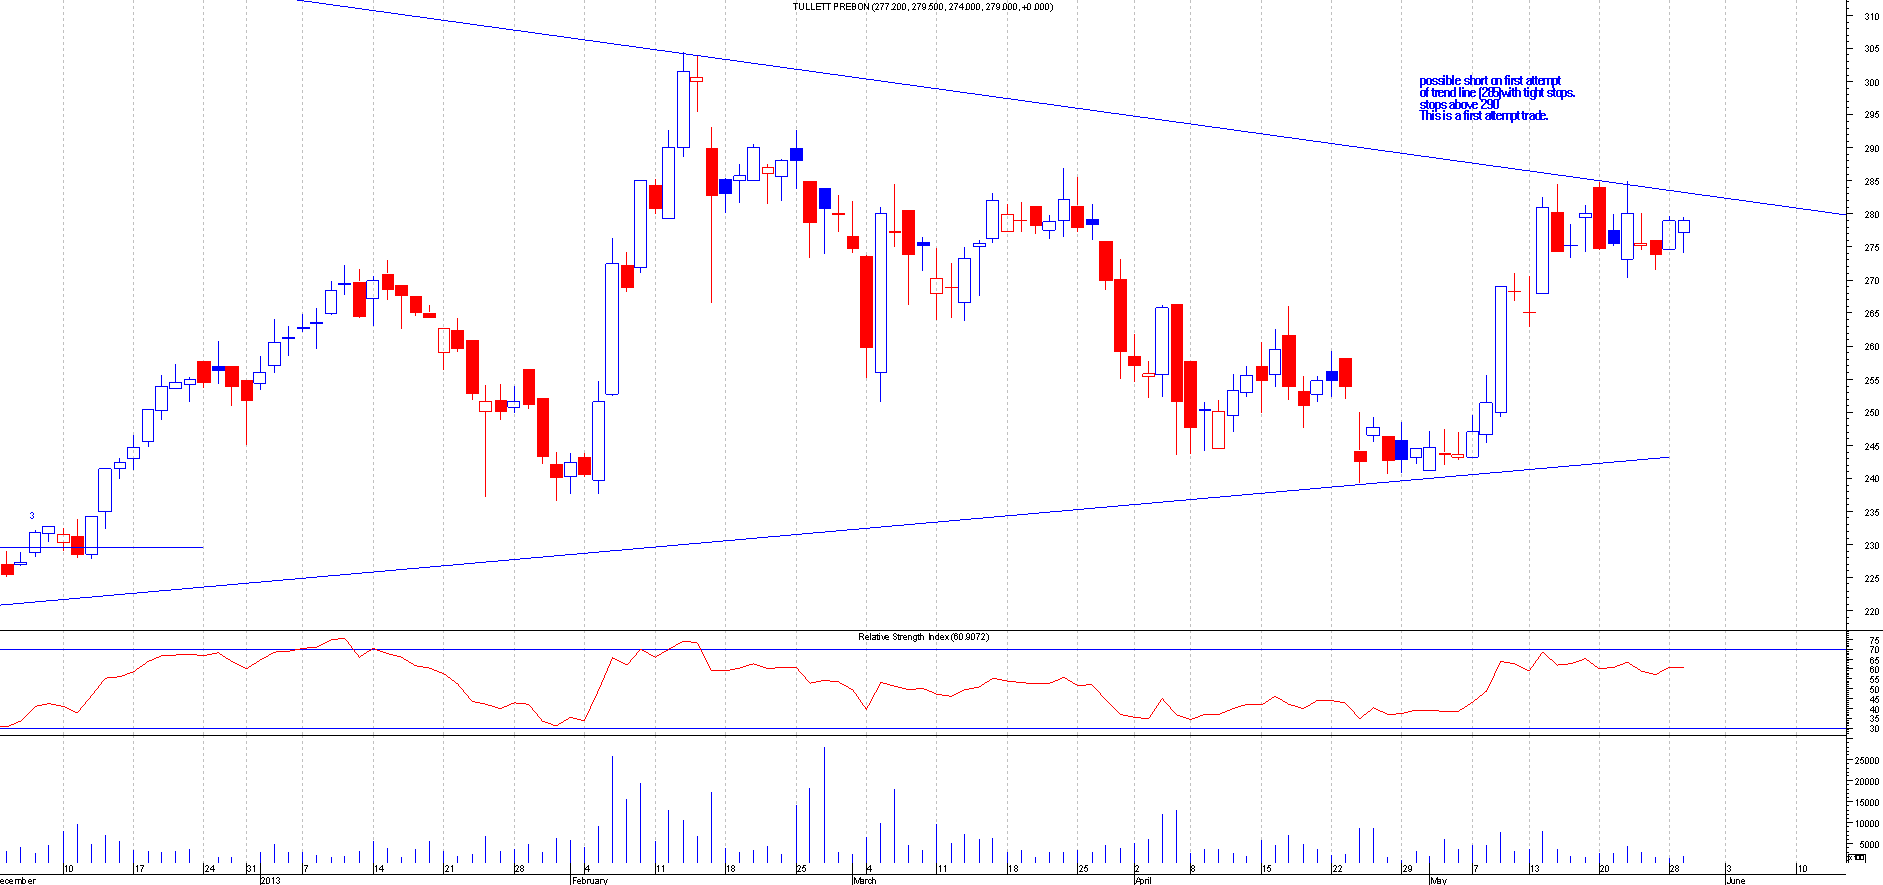
After: This was a perfect short on a first attempt basis. Since then its actually started to go sideways so now i suspect its building strength to breakout of the symmetrical triangle thats in play. This share has been wonderful to trade recently. This is in this weeks interesting chart section for a possible entry.
As can be seen from the above charts ,i am a short term trader and not a long termer. Short term trading requires more discipline and faster reaction. This is not for every one.
For more interesting charts please keep an eye out every weekend for the best charts to trade for the week ahead.
As can be seen from the charts above it's well worth following the interesting chart section on ChartsView. The best way to use the Interesting Chart section is to save all the companies into a charting software so that you can monitor it regularly. I use MetaStock Pro charting software powered by Thomson Reuters, which is a professional full-featured real-time trading package. If you would like to use it too then please take up our great offer: MetaStock Pro FREE for 2 months through ChartsView.
Get it Now: MetaStock Software Free for 60 days
It's worth the trial, you get to use professional software for free and there is no obligation to buy and it's the best way to monitor the shares.
I update the interesting chart section every week for the coming week ahead. These are the charts that I feel would have a great chance of a good trade based on a short term trading.This section is not for the long termers so bear that in mind.
Please feel free to join fellow traders on the discussion forums but please bear in mind that the forums are only for the serious traders and not really for kids hense the subscription fee. Its only £39.95 for the year but you get great tips and a great bunch of real active traders from around the world on there and much more. There is also a free 7 day trial to test out the great features on the site please check out the options and join a growing successful stock trading community: ChartsView Membership
Hope you have learned from this blog, Happy Trading!