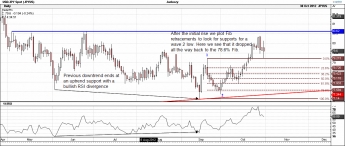
Here we're going to look at a live example of this theory in action. Prices almost never perform precisely to TA theory so please view this post as educational rather than a trading tip.
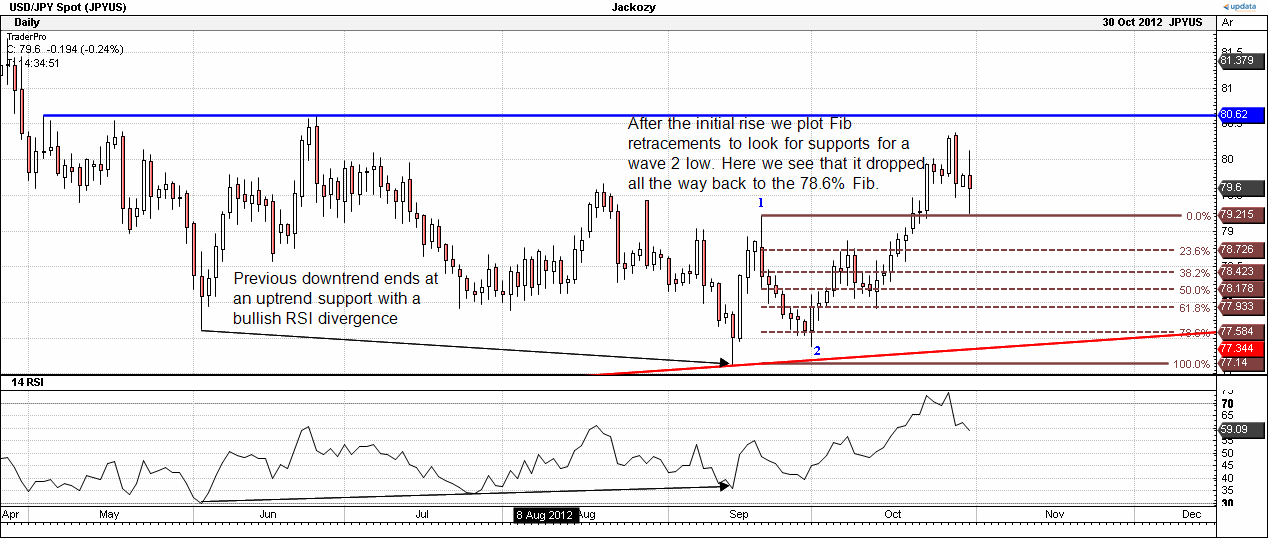
USDJPY had been in a downtrend which ended at a known uptrend support with a bullish RSI divergence. We've seen an initial rise and retrace so we can see how the theory matched up:
dl.dropbox.com/u/20815047/USDJPYexample1.gif
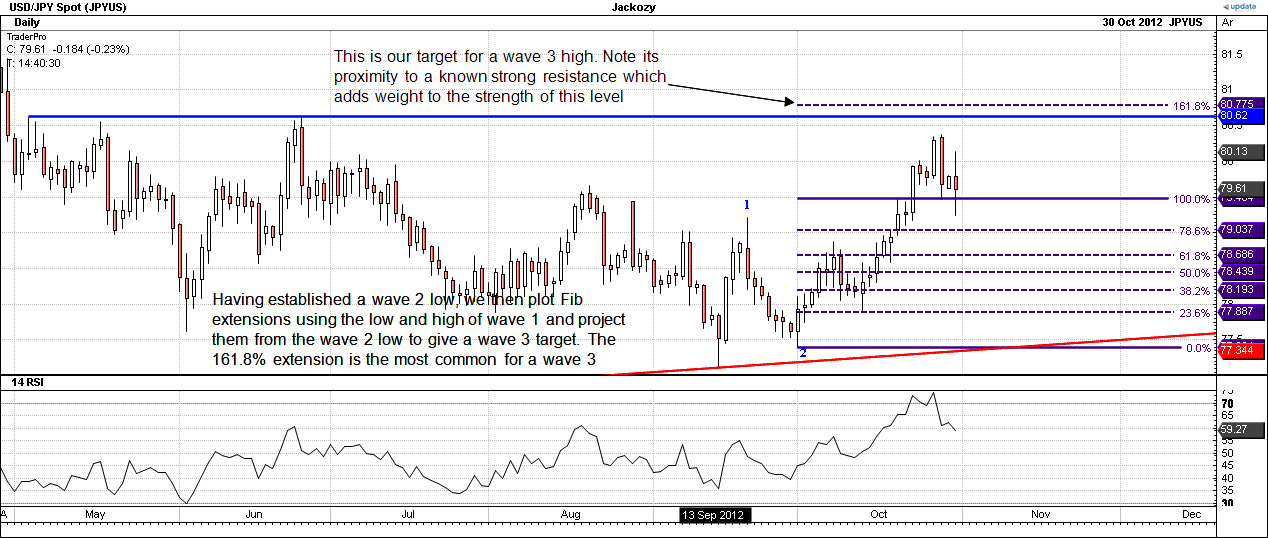
We can see it dropped to the 78.6% Fib so we plot the Fib extensions from there to give us resistances on the way up to a wave 3 target:
dl.dropbox.com/u/20815047/USDJPYexample2.gif
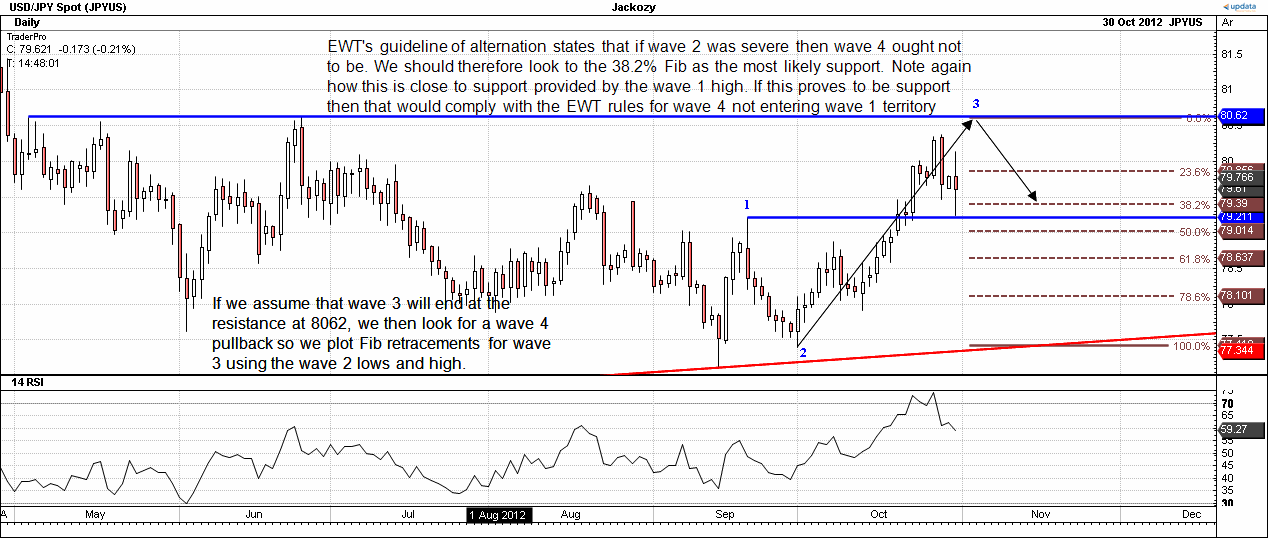
We have not (so far) reached that target so the rest is theoretical. The wave 3 target from the Fib extensions comes in very close to a known, strong resistance level so it seems a good place to trade from. We can then theorise as to how the rest of the waves could look:
dl.dropbox.com/u/20815047/USDJPYexample3.gif
And then on to a possible 5th wave move:
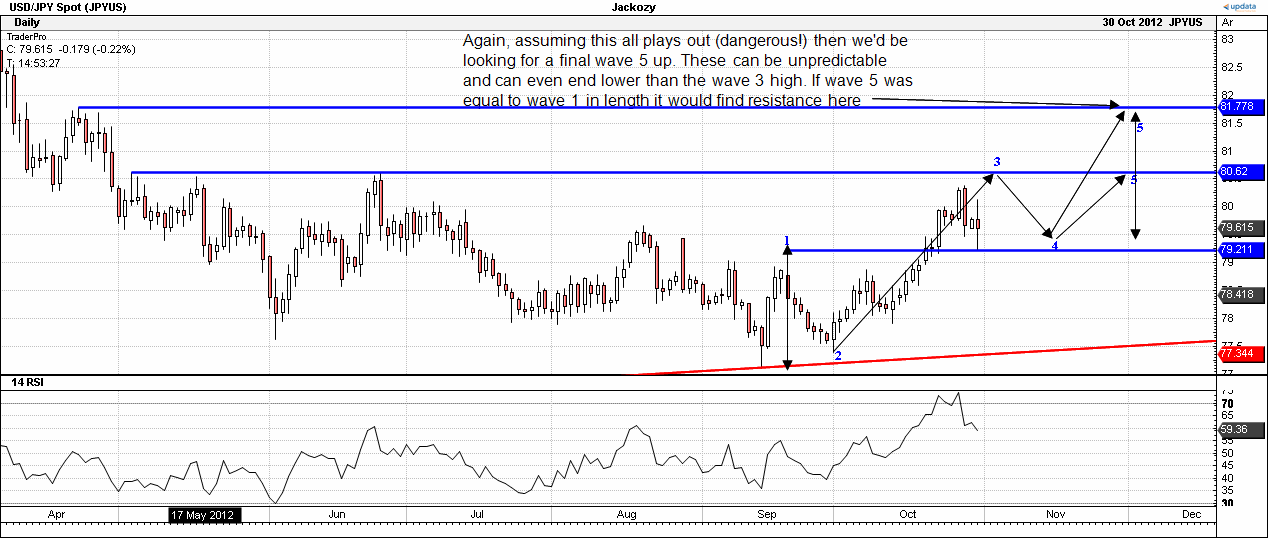
dl.dropbox.com/u/20815047/USDJPYexample4.gif
Note again how a wave 5 equal to wave 1 target coincides with a natural, known resistance. We can even look at the subwaves of wave 3 we we appear to still be in:
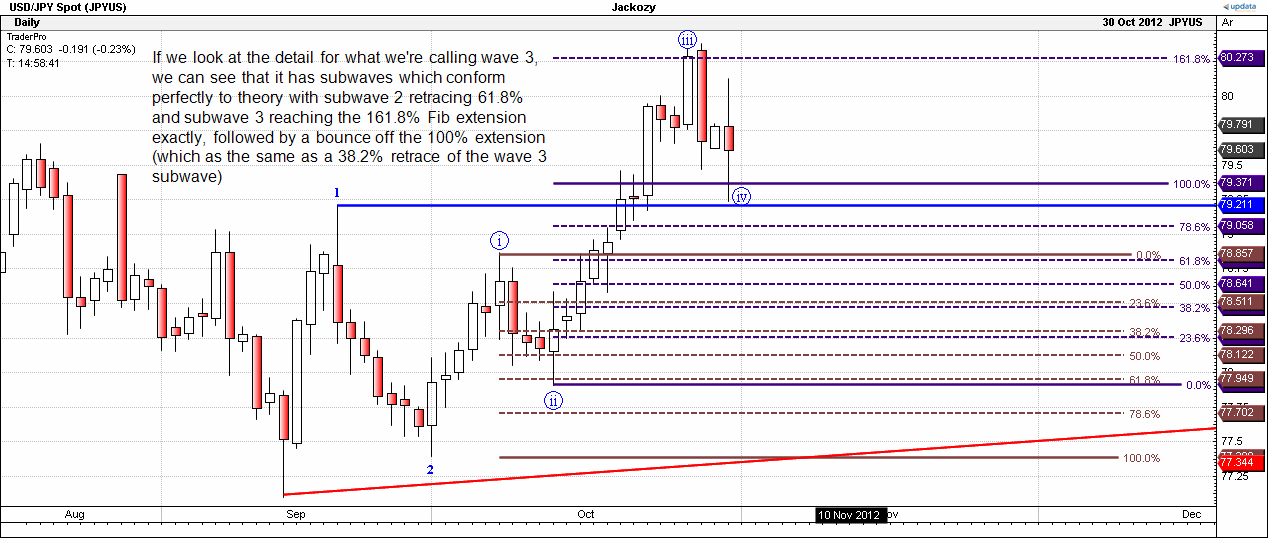
We can see that so far it's performing very nicely according to theory but we should never assume that this will continue.
Good luck!
