


Chartsview blog
General trading and all to do with financial markets

Share tips from 28th May - 2nd September Part 2
in ChartsView Blog:- Font size: Larger Smaller
- Hits: 5305
- 0 Comments
- Subscribe to this entry
- Bookmark
This is the continuation of the share tips. This is part 2
22nd July 2013
DPLM.L
This is the Chart of Diploma when I first mentioned this:
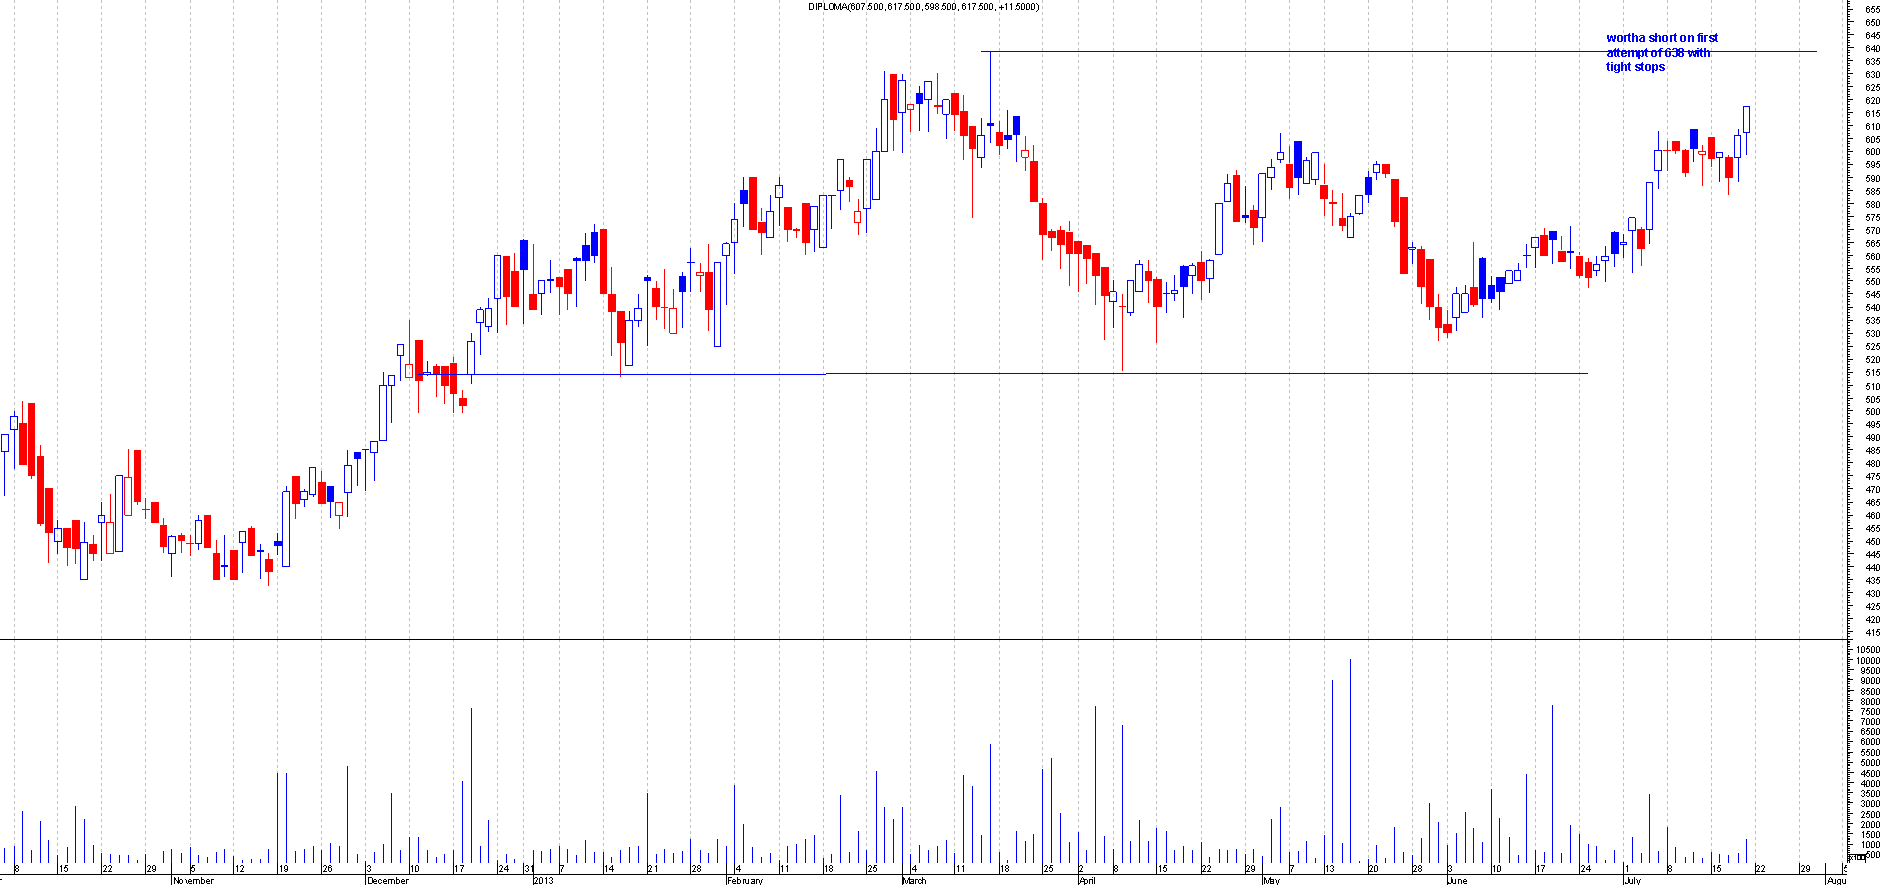
After : As can be seen the short worked really well.It reversed right on resistance on first attempt and moved 50+ points lower. This shows the power of good resistance on first attempts.

DRX.L
This is the Chart of Drax Group when I first mentioned this:
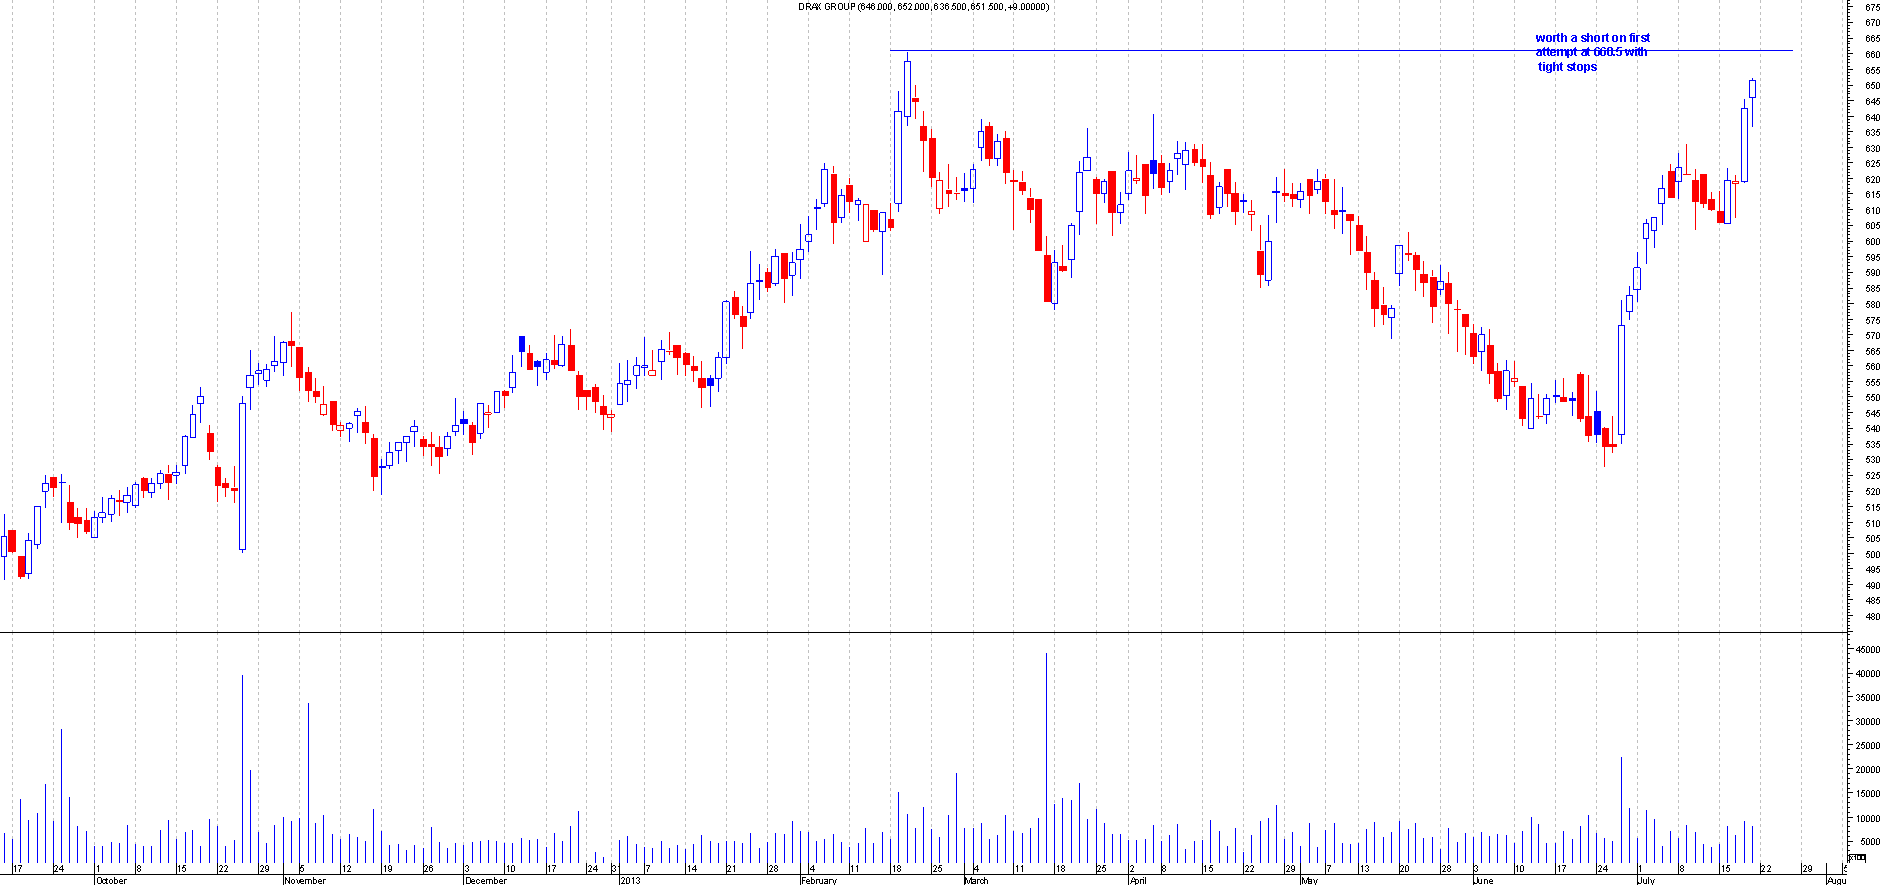
After : This was a good day trade as it hit the resistance perfectly and reversed 30+ points. This shows why its pretty good to attempt a trade on first attempt only. The price latter went on to break through that resistance a week latter.Thats why i always mention first attempt only.This is a classic example what can happen on the second attempt so soon afterwards.

MRW.L
This is the Chart of Morrison SuperMarket when I first mentioned this:

After : This hit the resistance on the first attempt and reversed 10+ points.

POLYP.L
This is the Chart of Polymetal Int when I first mentioned this:
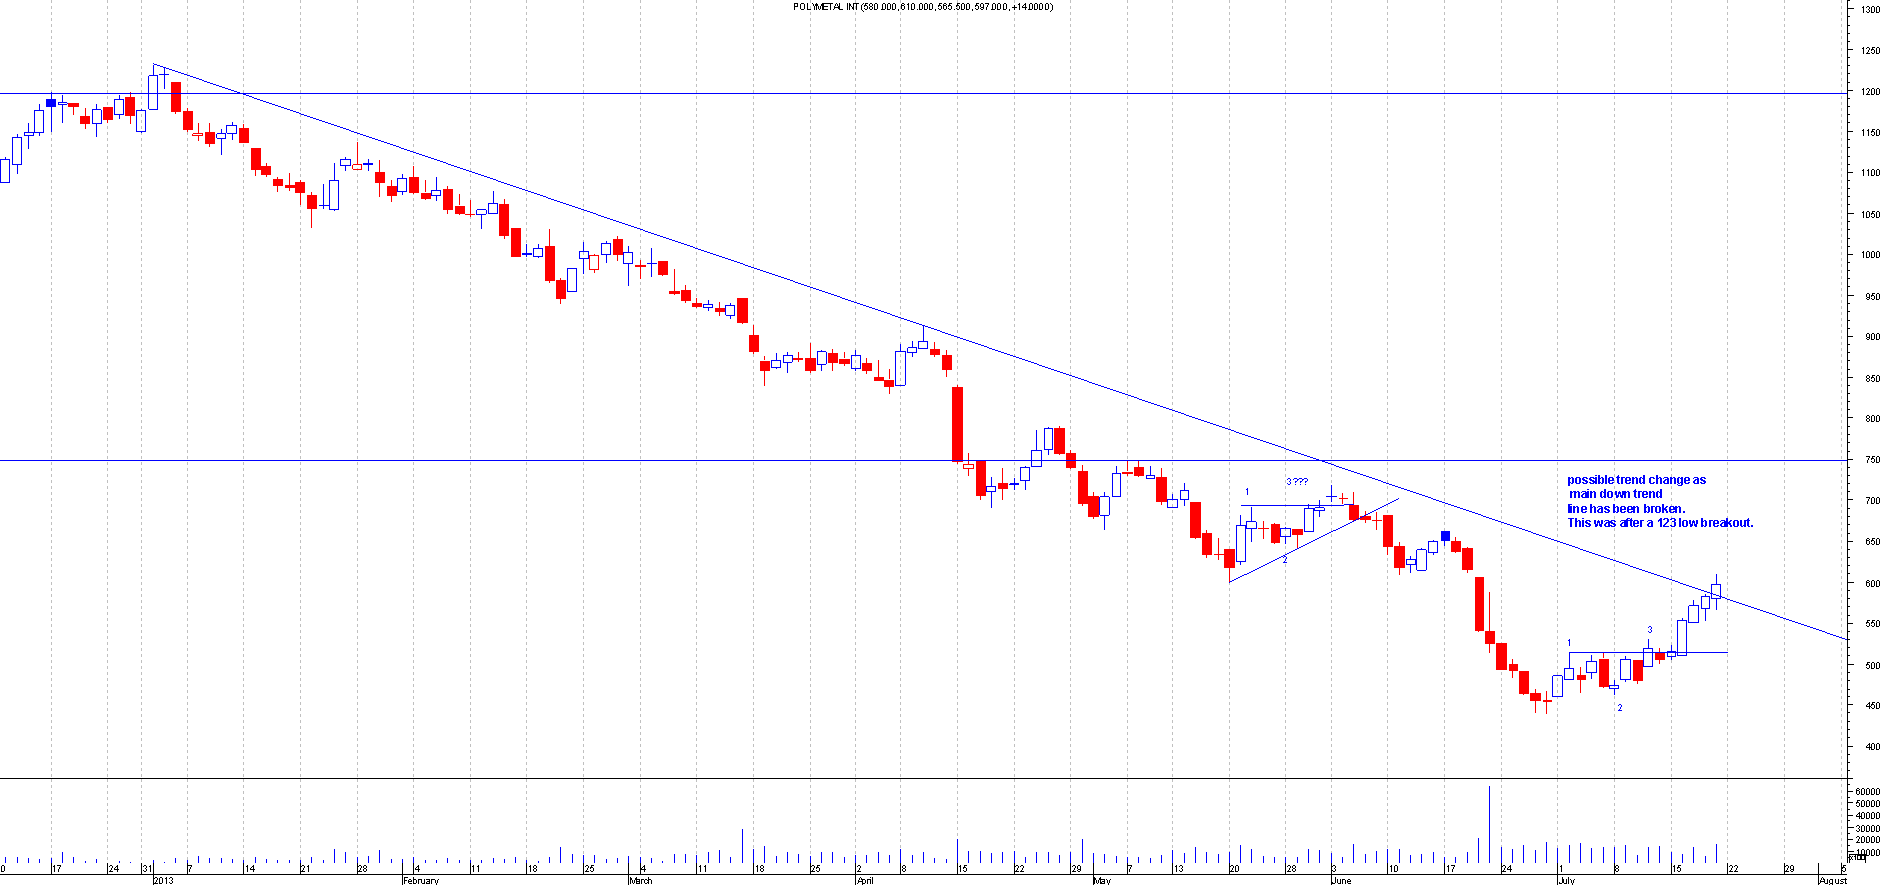
After: I mentioned this when the down trend line was barely breached.This had a 123 low breakout a week before and the trend line break was the comfirmation of possible higher prices. This proved to be the case as now it stands at over 200+ points higher.This clearly shows the advantage of drawing a good trend line and having a 123 low breakout just before.

29th July 2013
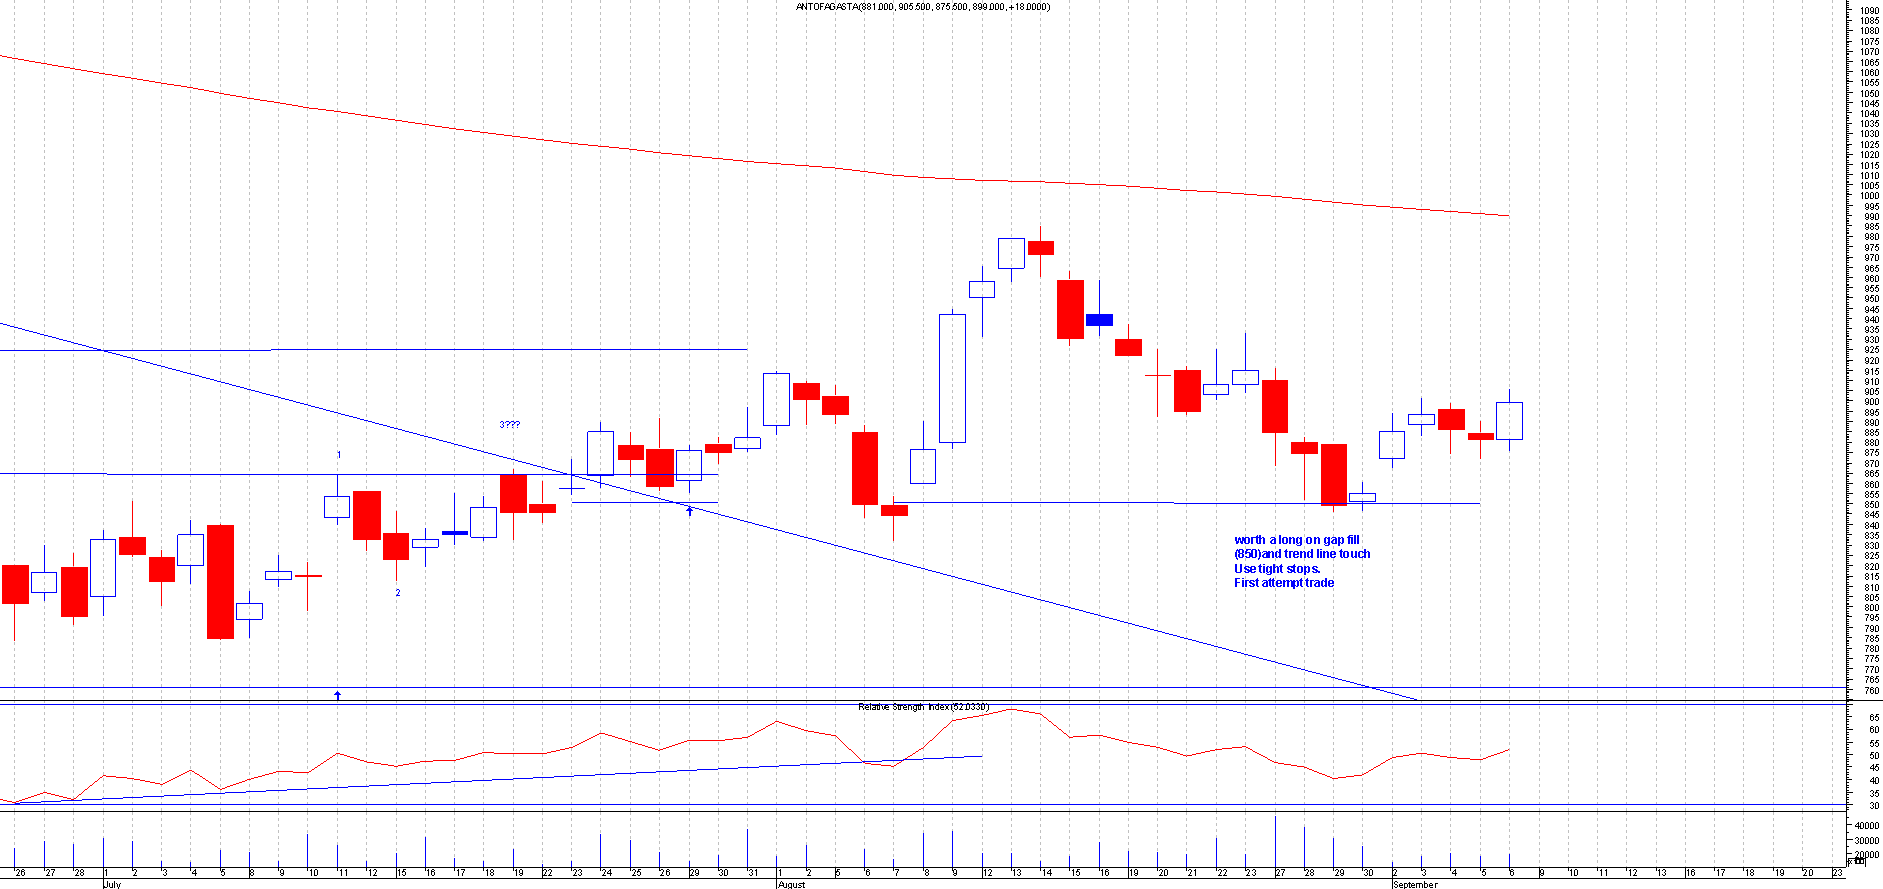
ANTO.L
This is the Chart of Antofagasta when I first mentioned this:
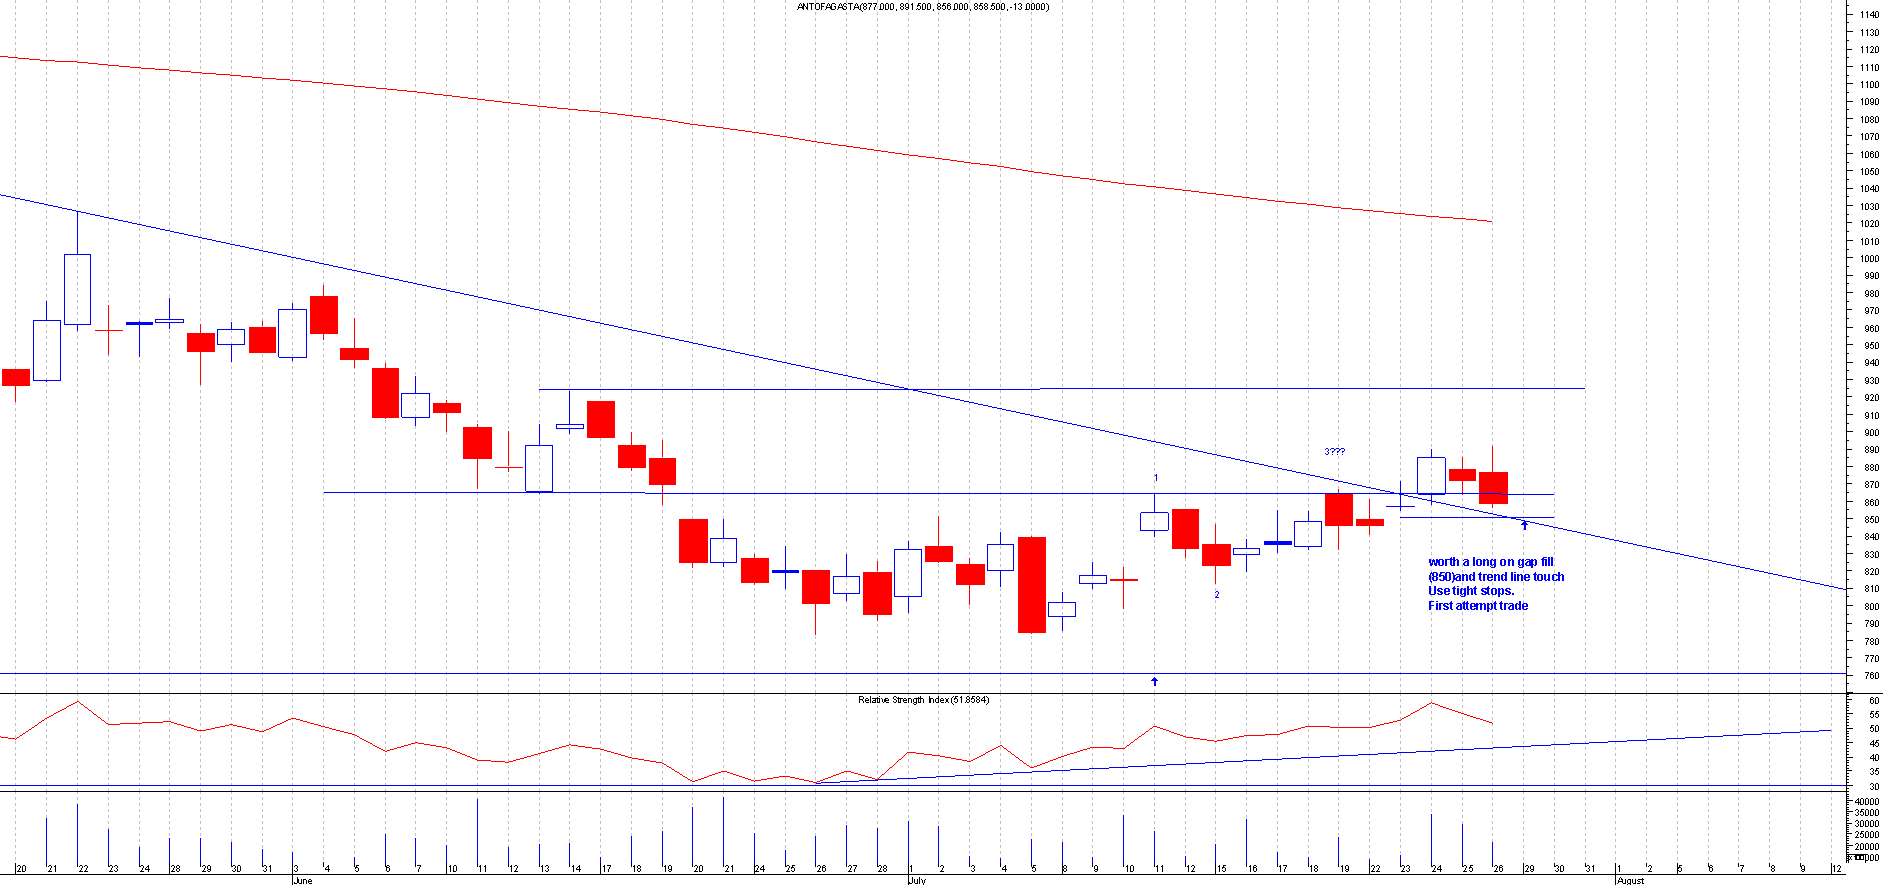
After : This filled the gap and moved over 130+ points. This also filled the new gap latter as well and moved higher for a second time.
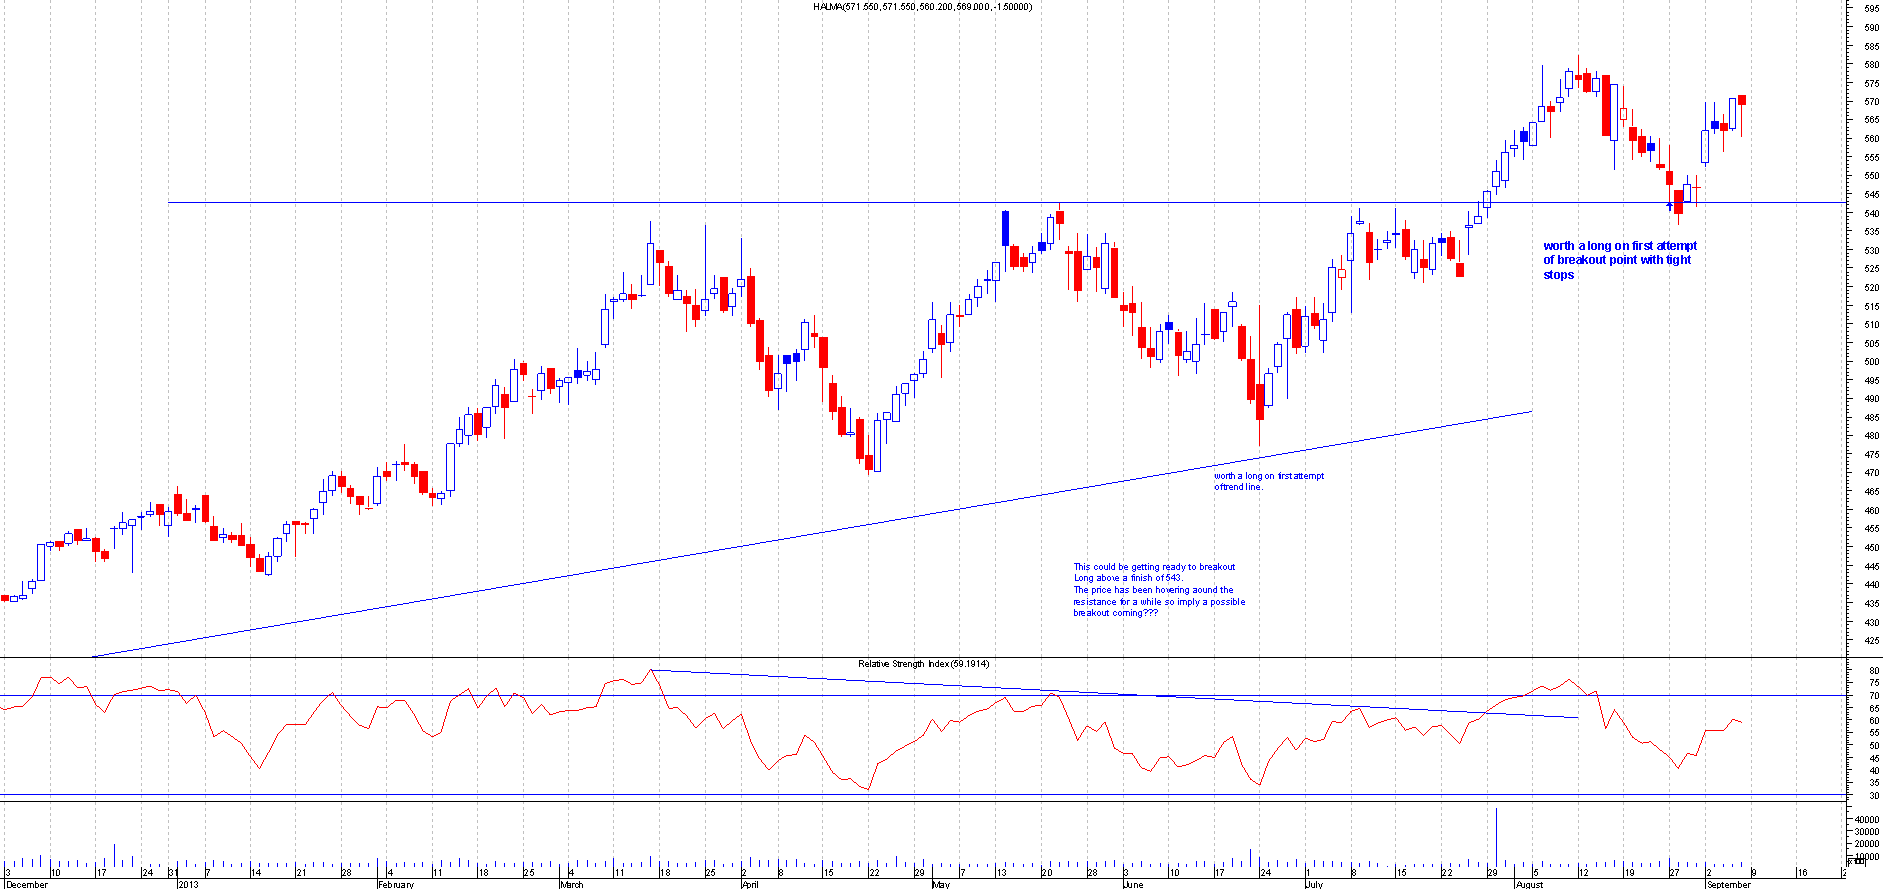
HLMA.L
This is the Chart of Halma when I first mentioned this:
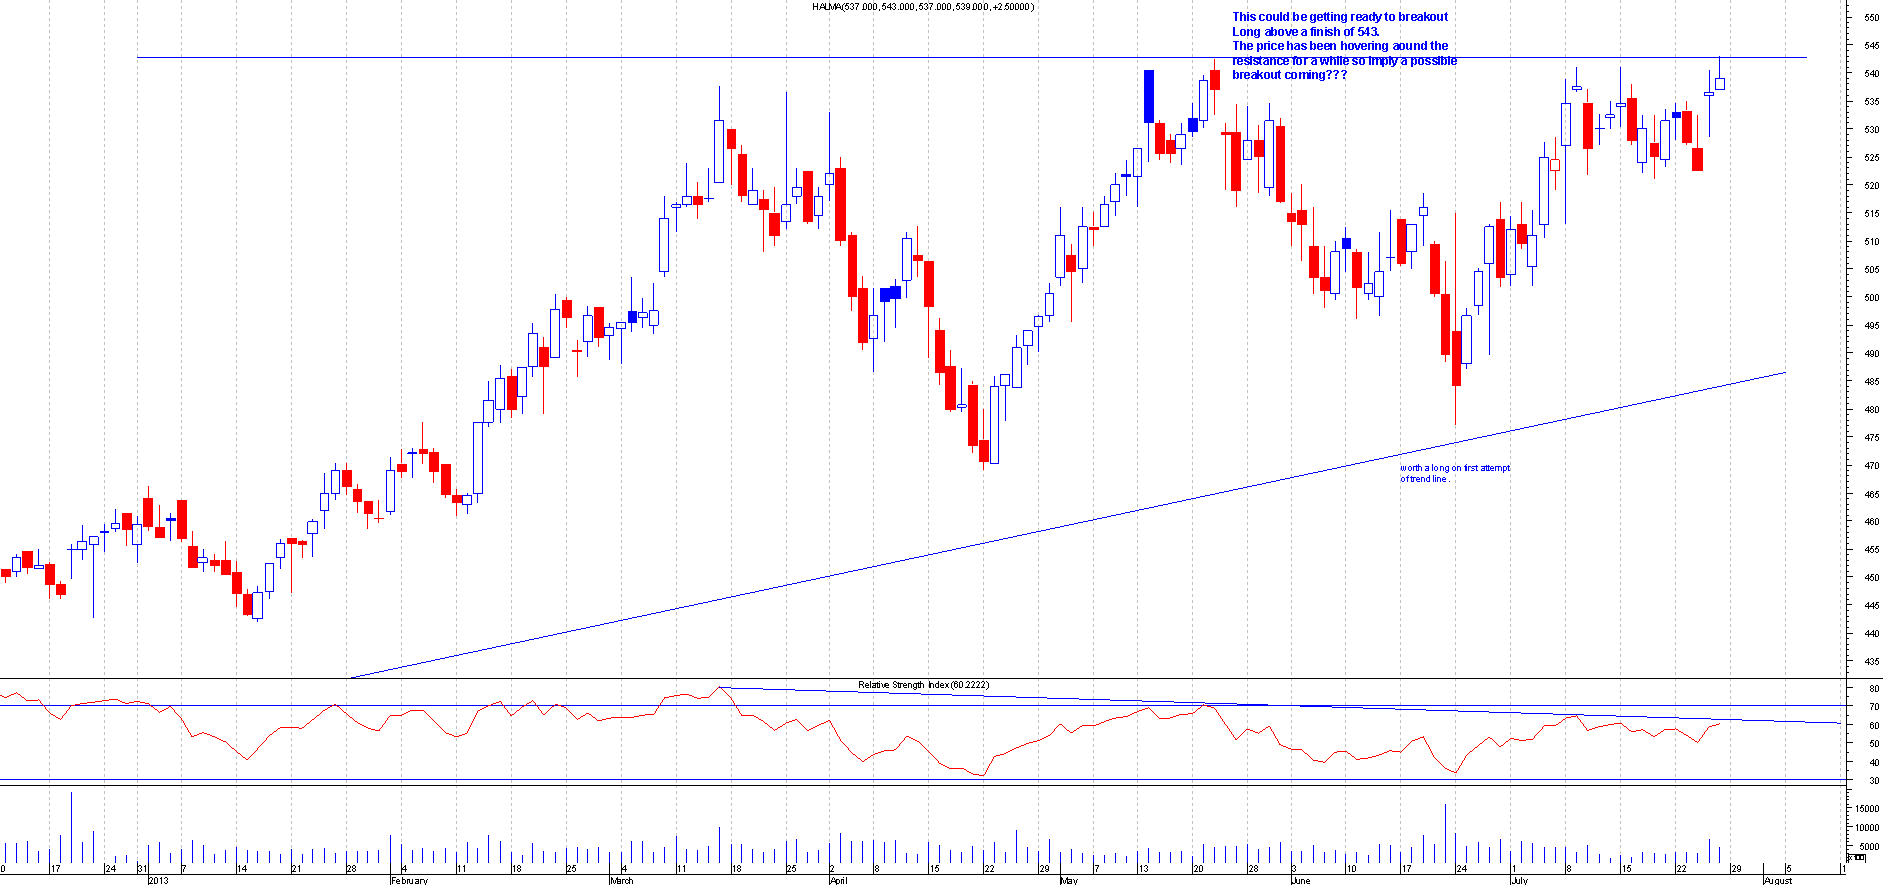
After : This did breakout of the assending Triangle after i gave the tip. This even back tested the breakout point a month latter and went higher.This share gave a chance twize to get in.This share moved 40+ points from the oringinal tip.
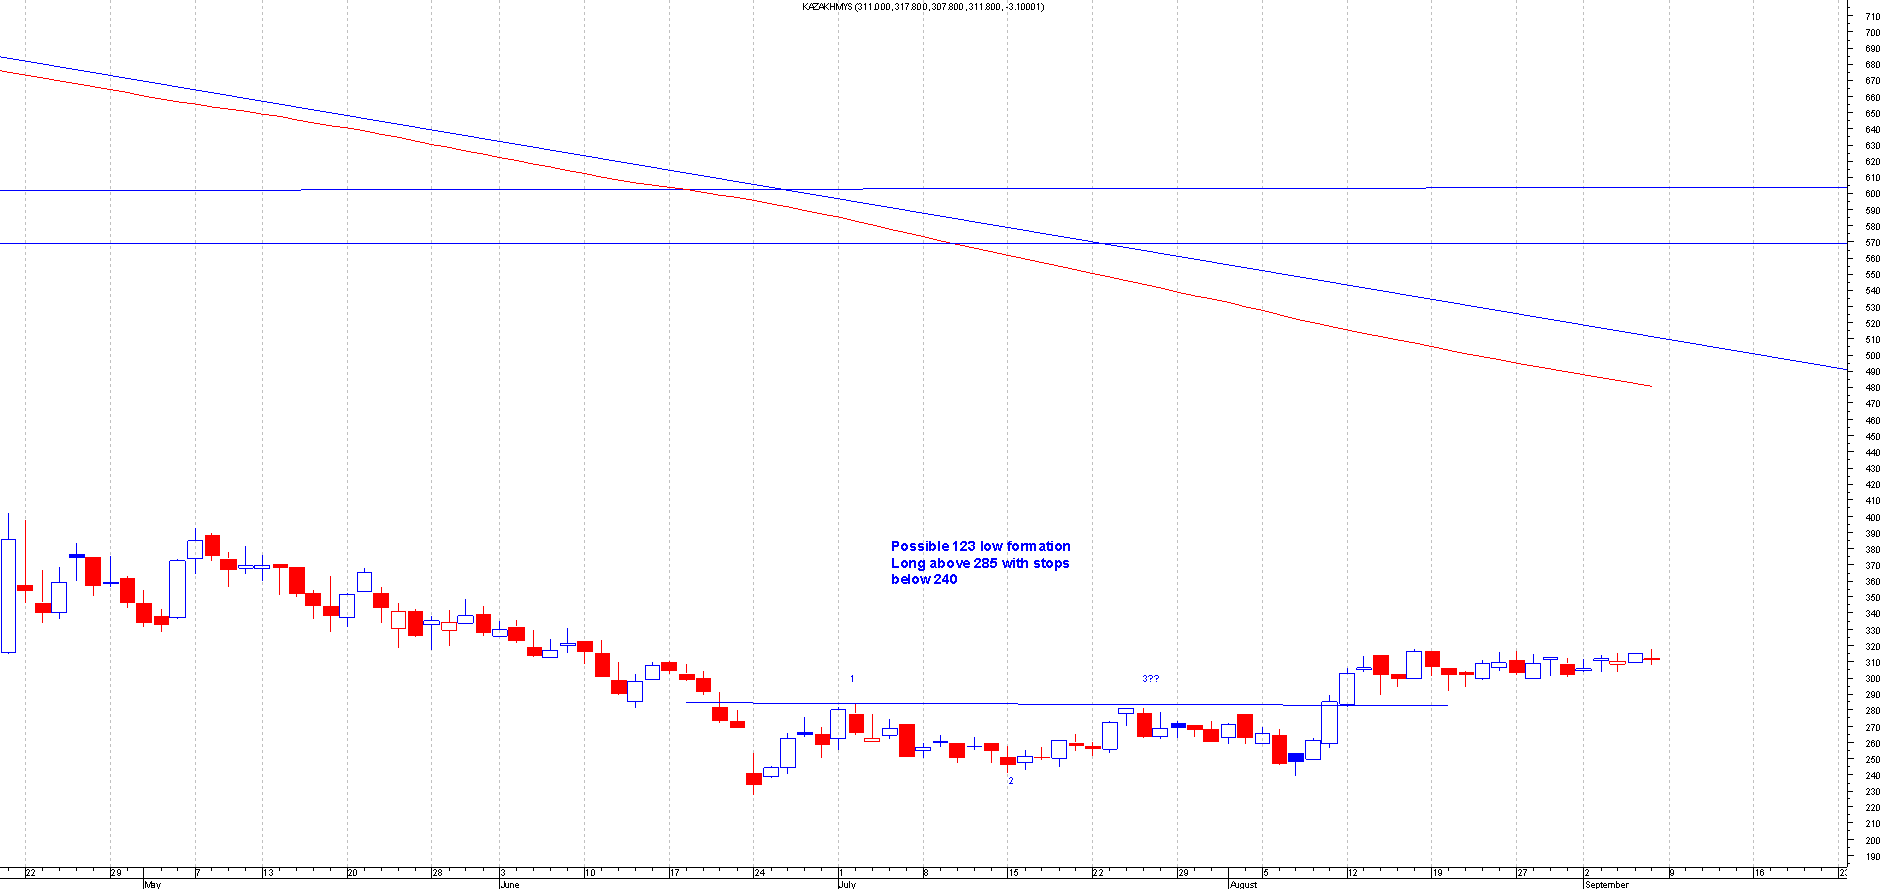
KAZ.L
This is the Chart of Kazakhmys when I first mentioned this:
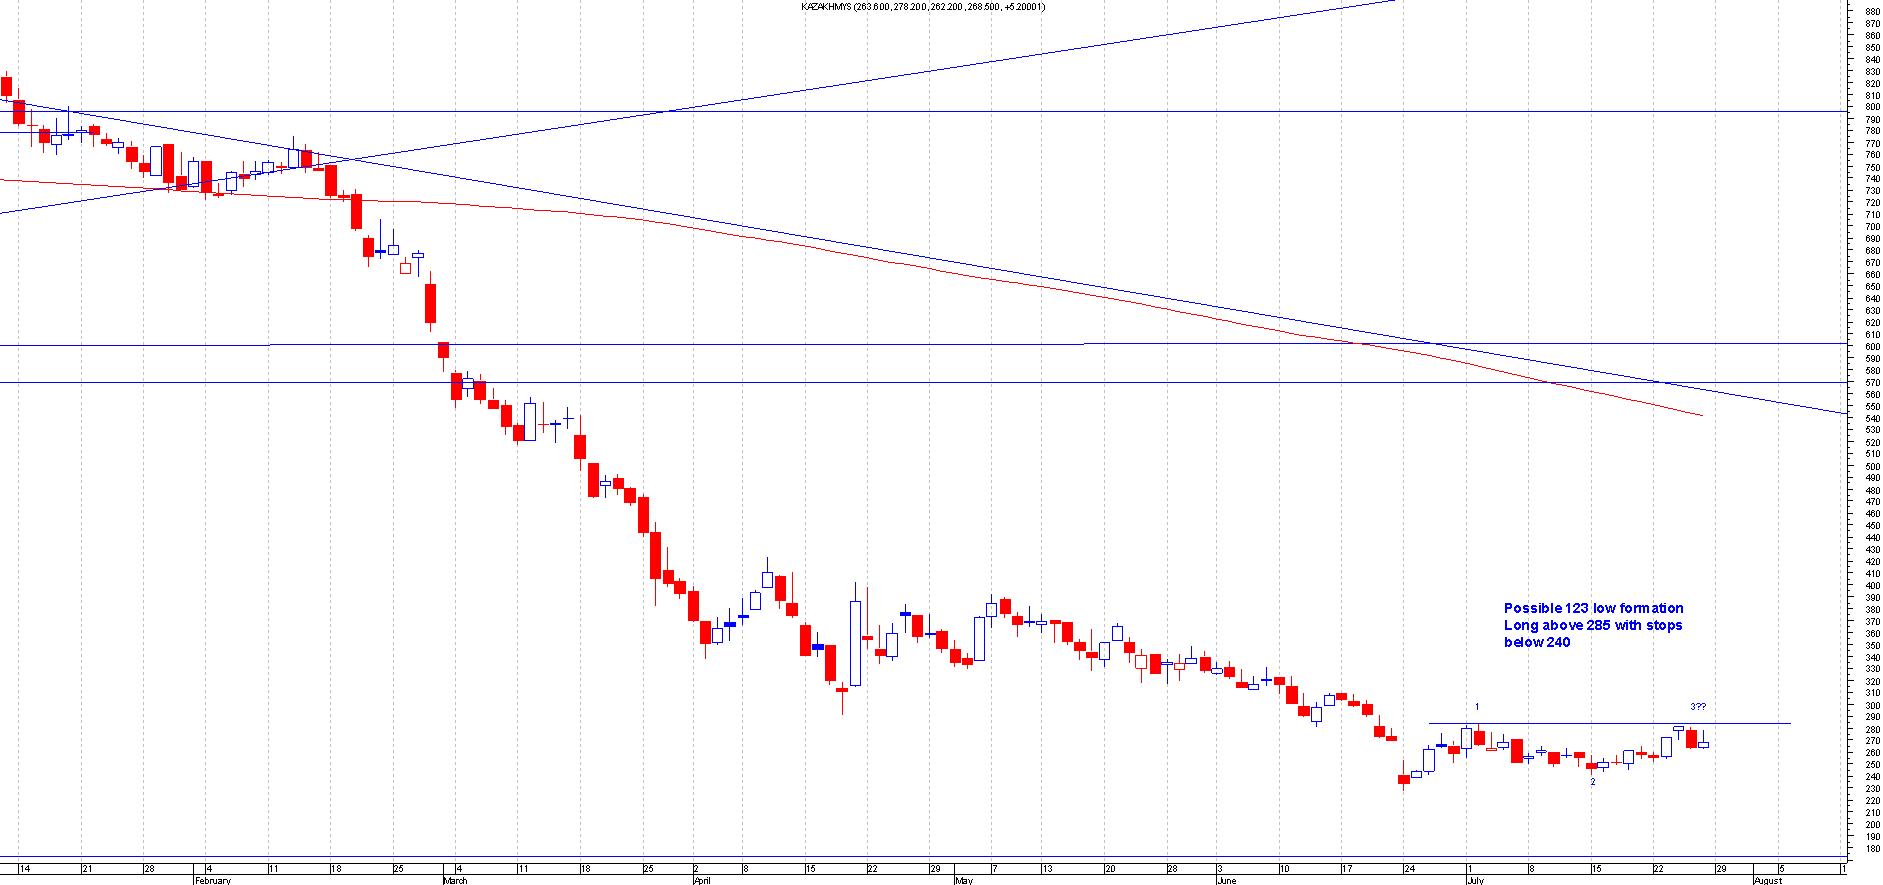
After : This broke out of the 123 low nicely and then has been going sideways since.This has moved 35+ points since the breakout.
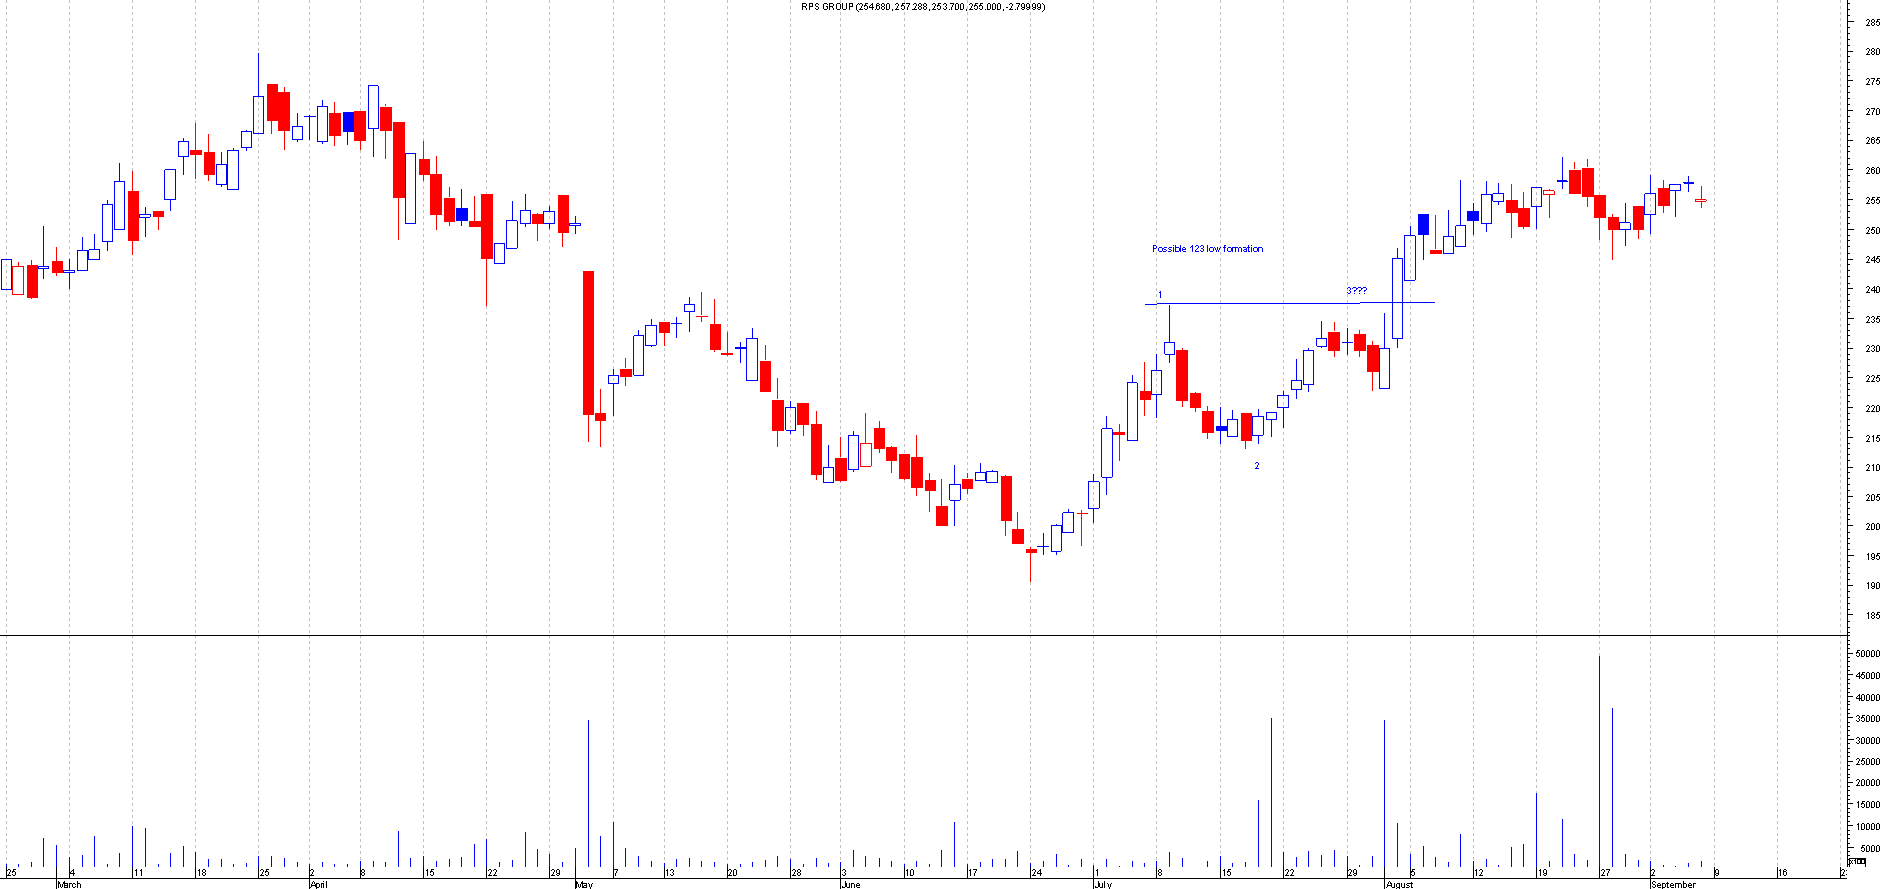
RPS.L
This is the Chart of RPS Group when I first mentioned this:
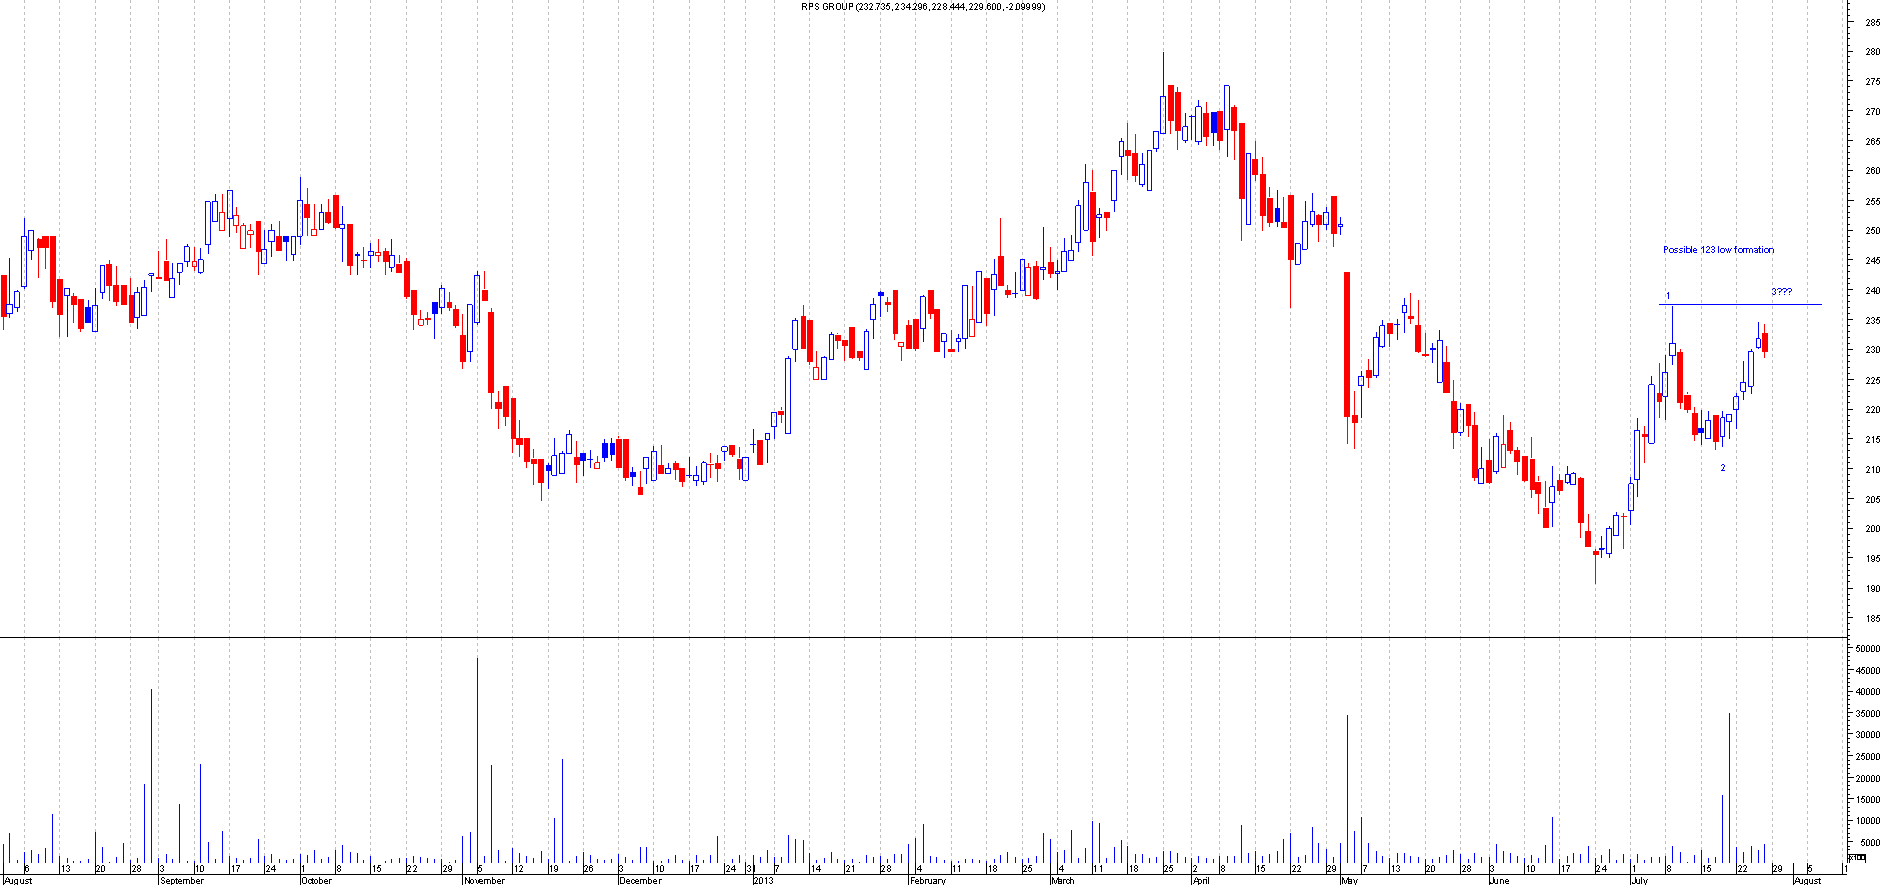
After : This broke out nicely from the 123 low breakout even thou the range was high. This has moved 25+ points from the breakout point.
This is the end of part 2 of this long blog. Keep an eye out for the final Part 3 coming soon.