Articles
A bar chart plots the opening price and closing price and intraday peaks and troughs. All this from a simple vertical line termed a bar.
The day's high and low is plotted using the height of the bar, the price the market opened is drawn across the left of the bar with a horizontal dash, the price that the market closed is drawn with a horizontal dash drawn across the right of the bar.
Bar Chart
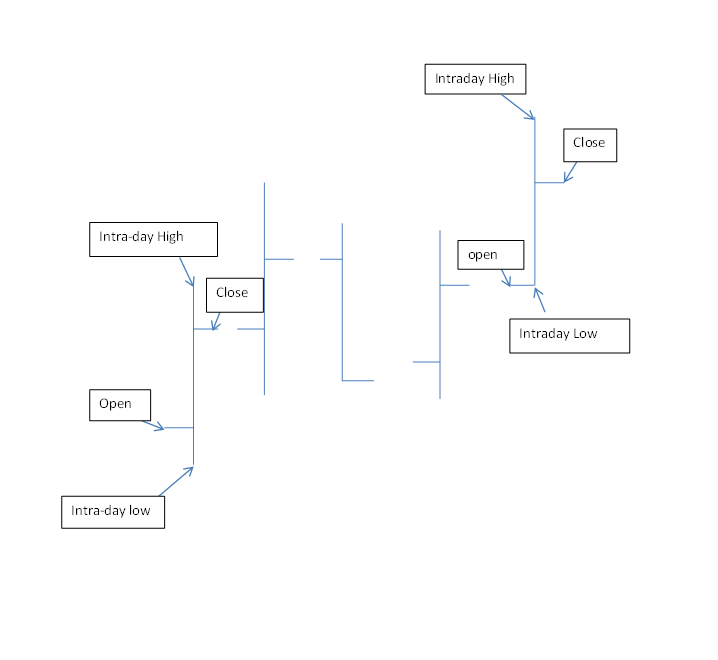 All time frames can be plotted this way and basically the bar holds the movement of the whole day visually.
Advantages
• You can see the whole picture on a bar chart. It has all the data for the days move in a visual format.
• Easy to spot extremes and important levels.
• Western technical can be applied. i.e. Gaps, islands, inside bars, etc, etc.
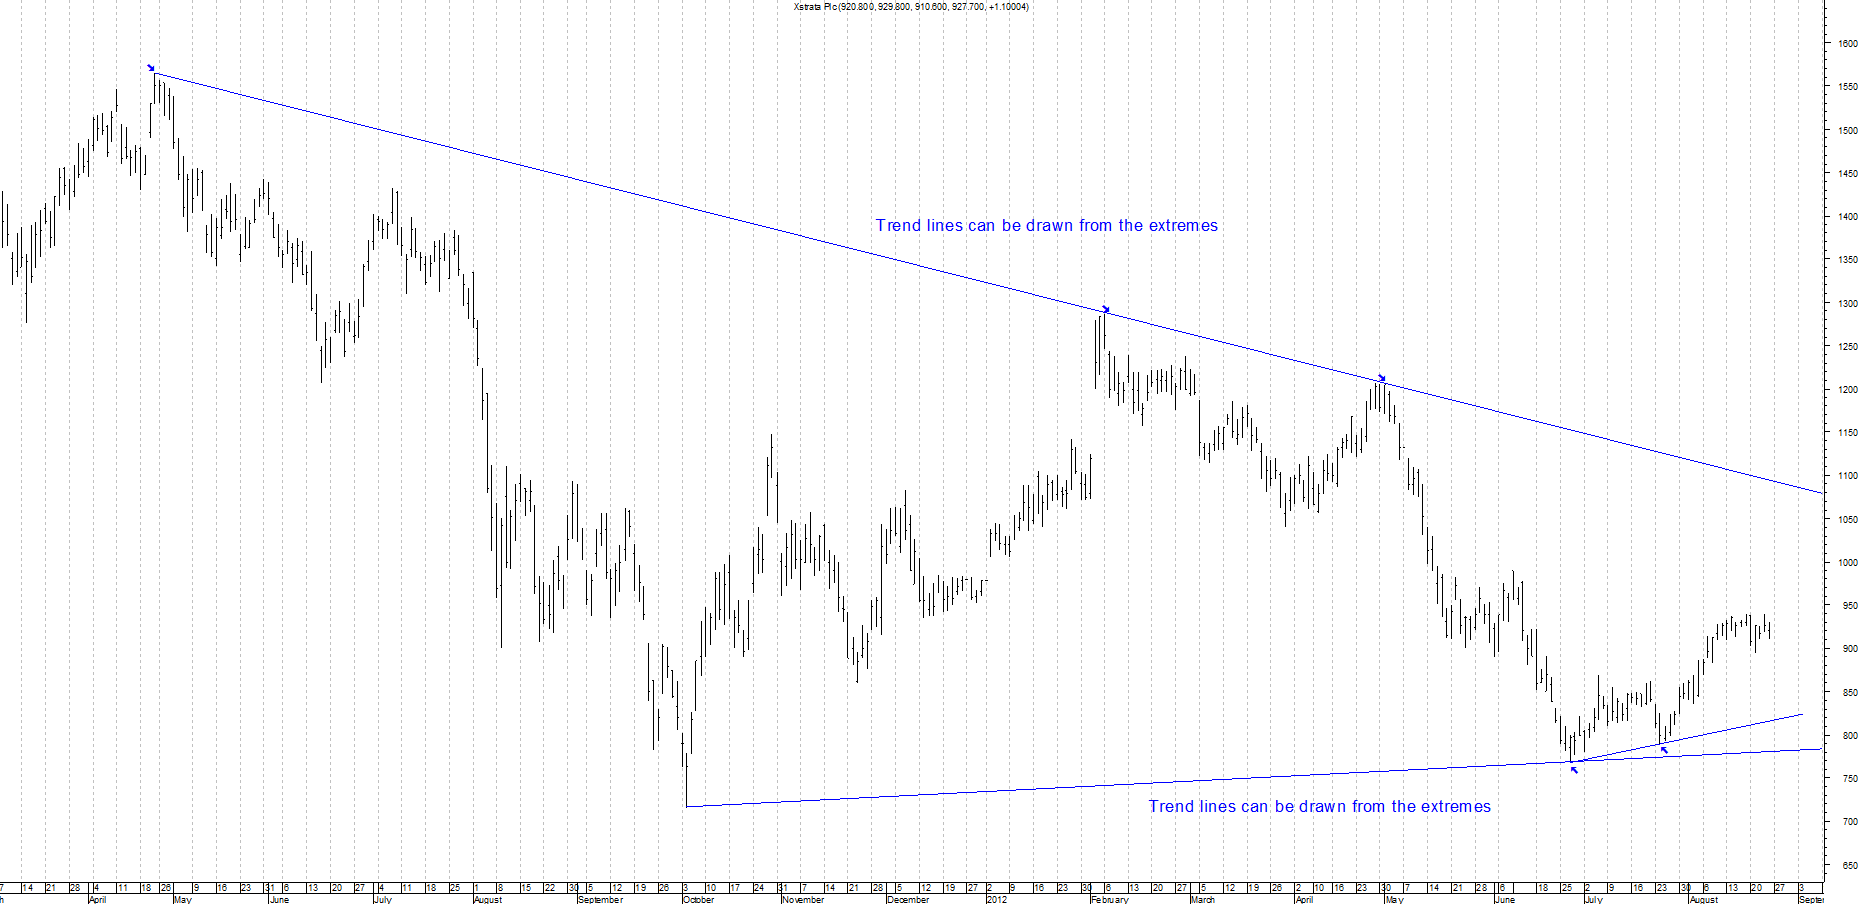
• Drawing trend lines can be accurate, as you will use the extremes of the day by joining them together (from key bottoms).
• Easier to apply stop losses, as you would use the bottom of the bar as a guide, so will place the stops below the extremes.
Disadvantages
• It's not easy for beginners to get to grip with bar charts as there is too much information available.
• Will take some time to gain experience using them.
Chart is provided by MetaStock and is an example of a bar chart