Here we have a sequence of charts showing a theoretical 5 "perfect" Elliott Waves up.
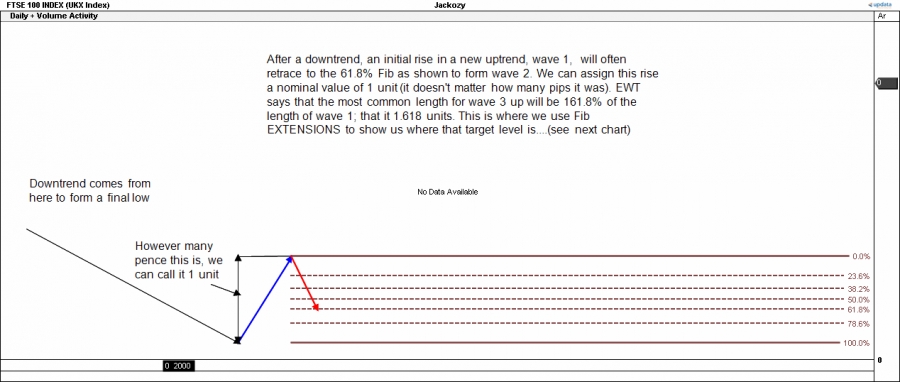
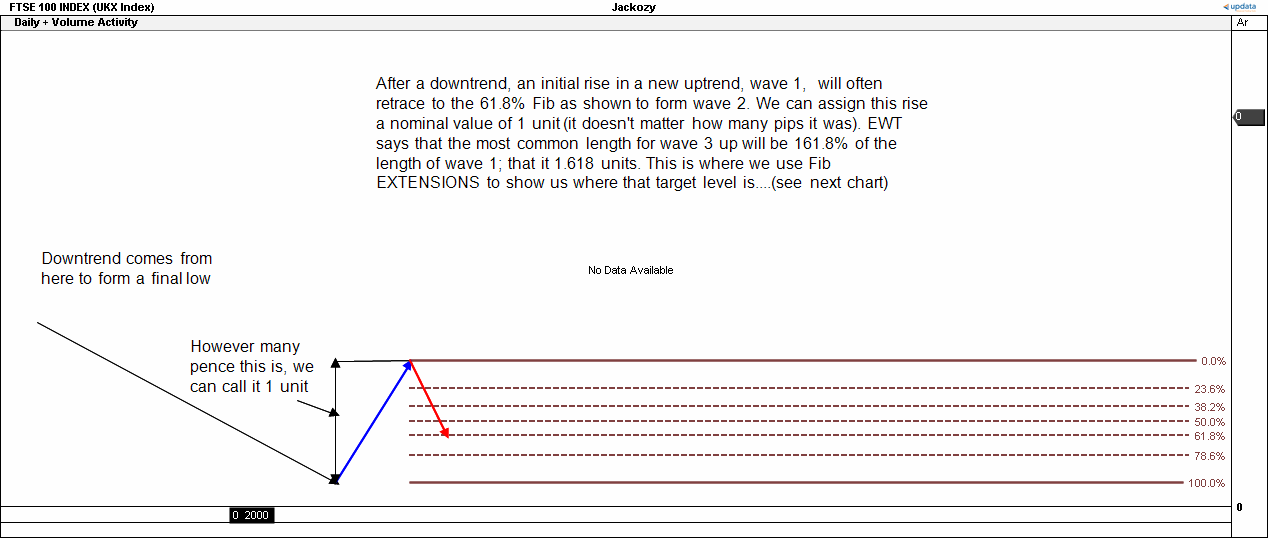
We start by assuming the share has been in a downward trend, forms a final low and then begins a new trend up with wave 1:
dl.dropbox.com/u/20815047/EWTwaves1%2C2.gif
This wave 1 up ought to also consist of a sequence of 5 smaller degree waves up but we'll leave that for now. The main point here is that the initial wave 1 up will often be followed by quite a severe retracement, usually to the 61.8% Fib level. This is thought to be due to the collective psyche still being unsure about the new trend causing many to take profits early having been trapped in the previous downtrend.
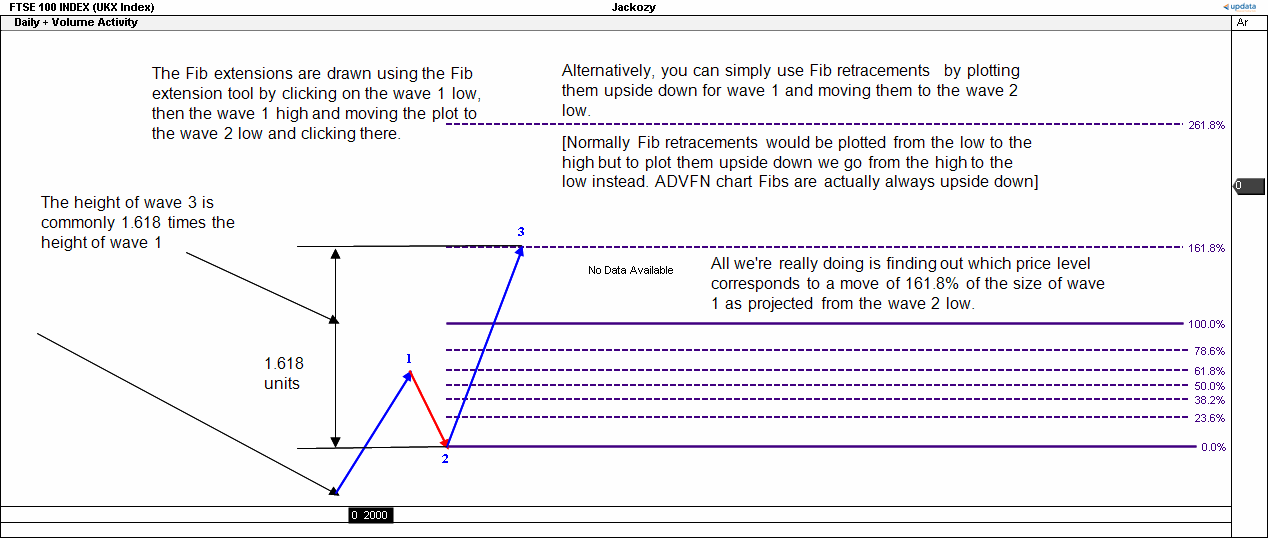
Following this retracement, price begin to look quite cheap again near to the previous downtrend low and traders buy this level since it represents good value compared to all of the previous price action since the start of the downtrend. We begin wave 3 up:
dl.dropbox.com/u/20815047/EWTwave3.gif
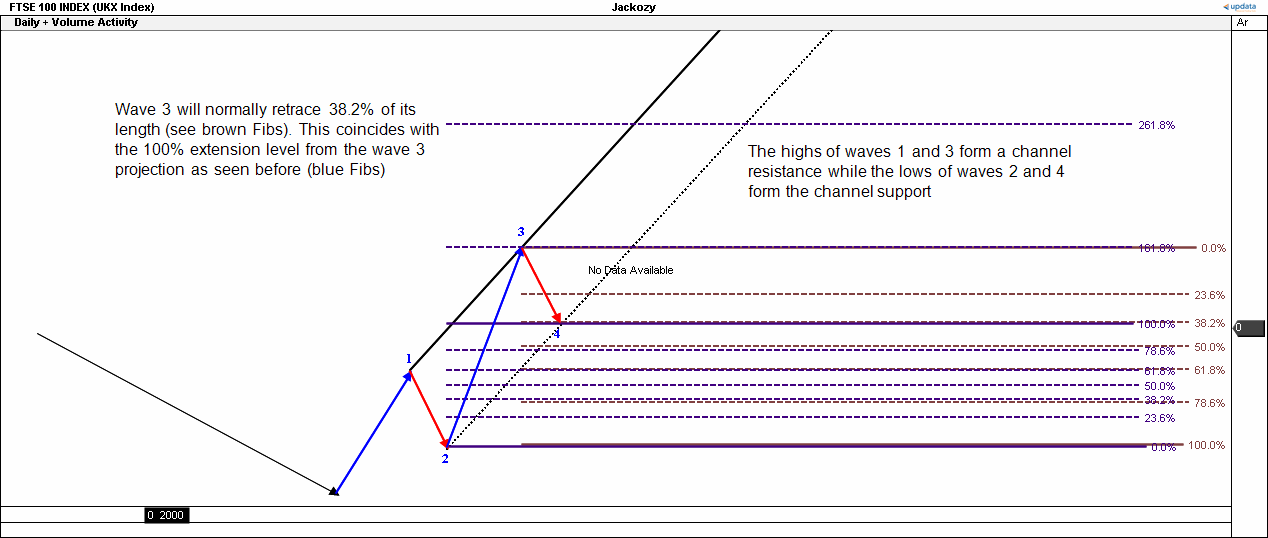
We can apply the whole sequence we're looking at here to view subwaves of this wave 3 and we'd find that the top of wave 1 of 3 should be at the same level as the resistance formed by the original wave 1. This is to be expected. It's only when prices break through above that level (a 123-low) that real confidence returns and prices get pushed rapidly higher. This is why wave 3 is often the longest and strongest since it is on this wave 1 breakout that we can be fairly sure that a new uptrend is in play. Naturally, this leads to profit taking and this often occurs at the 161.8% Fib extension of wave 1 projected from the wave 2 low as shown and forms wave 4:
dl.dropbox.com/u/20815047/EWTwave4.gif
This wave 4 usually has a bullish form to it since confidence remains high, hence it commonly retraces only 38.2% back to the level of the 100% Fib extension in the wave 3 projections. We can also often see a channel form between waves 1 and 3 at the top and waves 2 and 4 at the bottom. A final phase of buying forms wave 5, often equal to wave 1 in length, before some more serious profit-taking takes place. At this stage, prices could be around 261.8% of their starting level at the end of the previous downtrend so it's not surprising that there is much profit-taking:
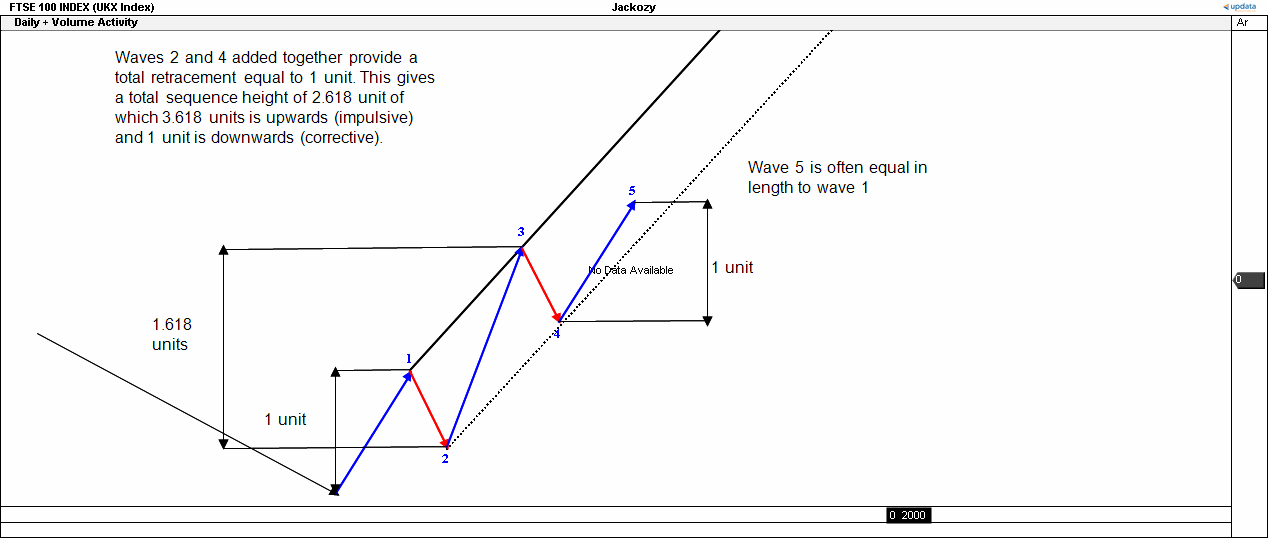
dl.dropbox.com/u/20815047/EWTwave5.gif
The whole 5 wave sequence in this "perfect" scenario forms a larger degree wave 1 up and the process repeats on a larger scale. In total, if wave 1 contains, say, 100 pips, the sequence has 361.8 pips of upward movement and 100 pips of downward movement to form a total of 261.8 pips gain. Perfect trading of this, taking both long and short positions, would result in gain of 461.8 pips, substantially more than by simply buying the low point of wave 1 and holding to wave 5 high, though obviously in practice this is almost impossible to do.