This is an update to the Interesting Chart section on www.chartsview.co.uk, this section is updated every week and provides shares that have great potential for the coming weeks. In this blog I will be looking at how well these tips have done by showing you the before and after picture.
This blog is not updated every week as some times the shares may breakout the following week and therefore it's pointless to just show 1 or 2 breakouts every week. These past 2 weeks have been a bit slow as only seven shares have broken out, there has been better success with the currency and index trades mentioned in the forums and a few shares that were not part of the interesting chart section.
Currency or index trades are not included in the interesting chart section as they change daily and need closer attention. The interesting chart section is only focused on the FTSE 350 currently as they are more stable than say the AIM shares. With technicals you should be looking at shares with plenty of liquidity and AIM shares don't have that, hense why the interesting chart section is mainly focused on the FTSE 350. However, we may add a few AIM shares in the interesting chart section but this would be done seperately under its own heading and at a later date.
Anyway I'm diverting as usual so here's how well the tips have done for the past 2 weeks.
22nd April 2013
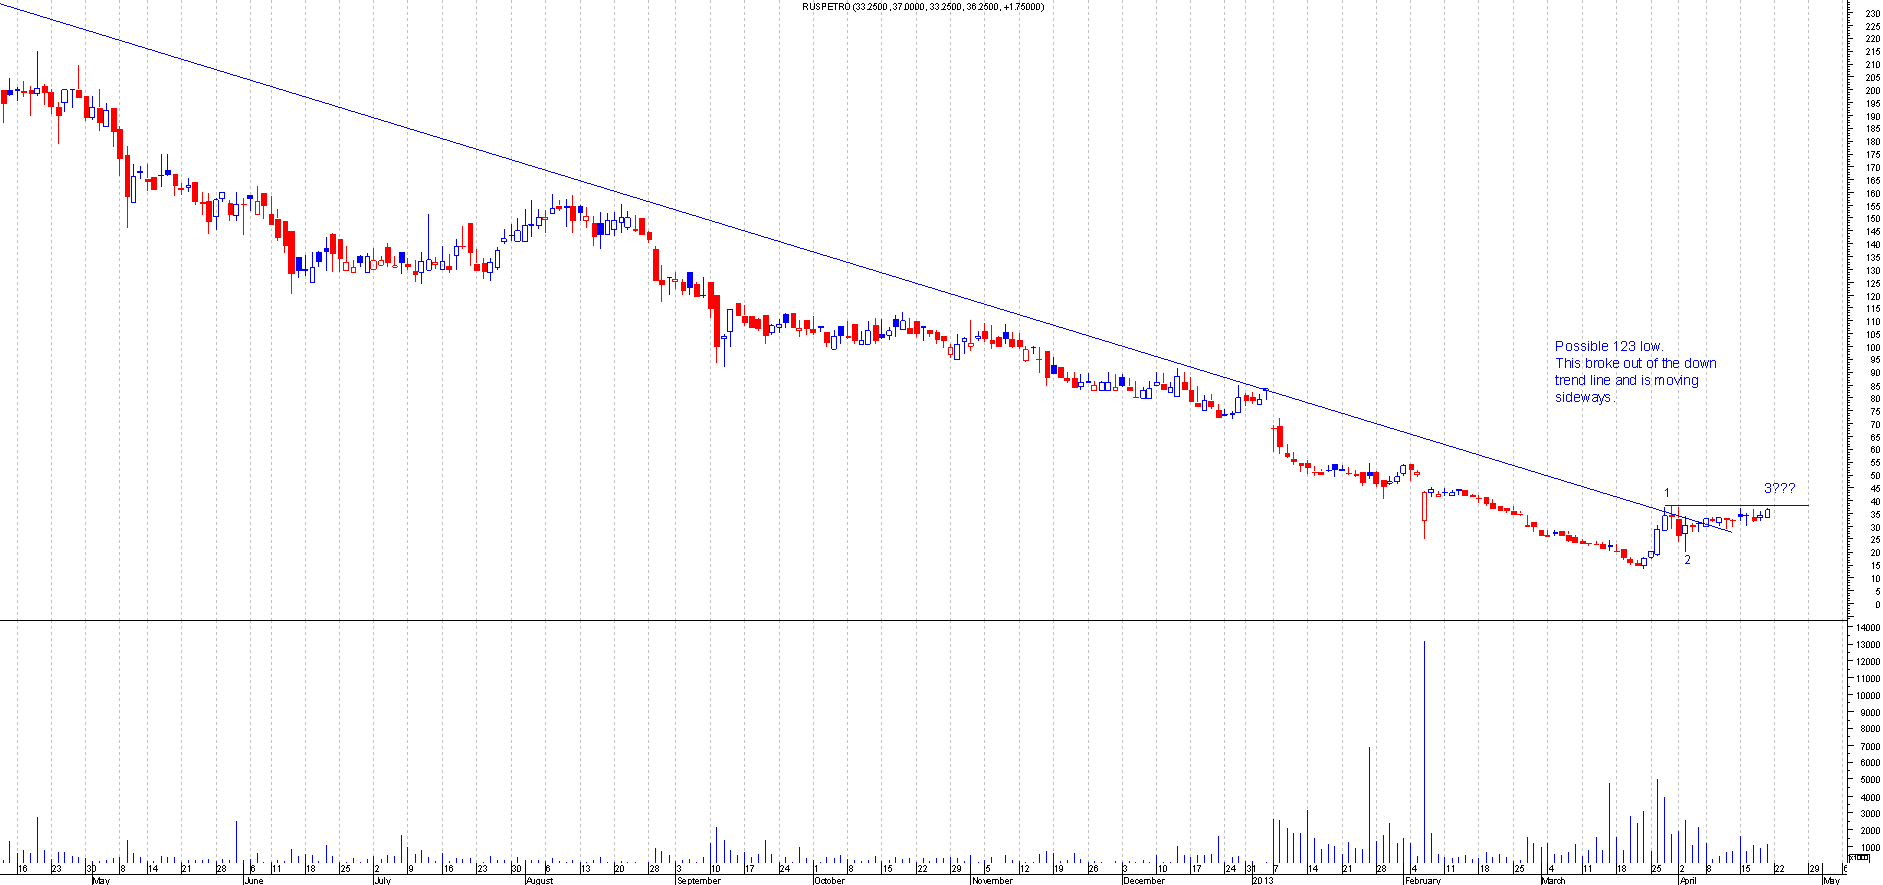
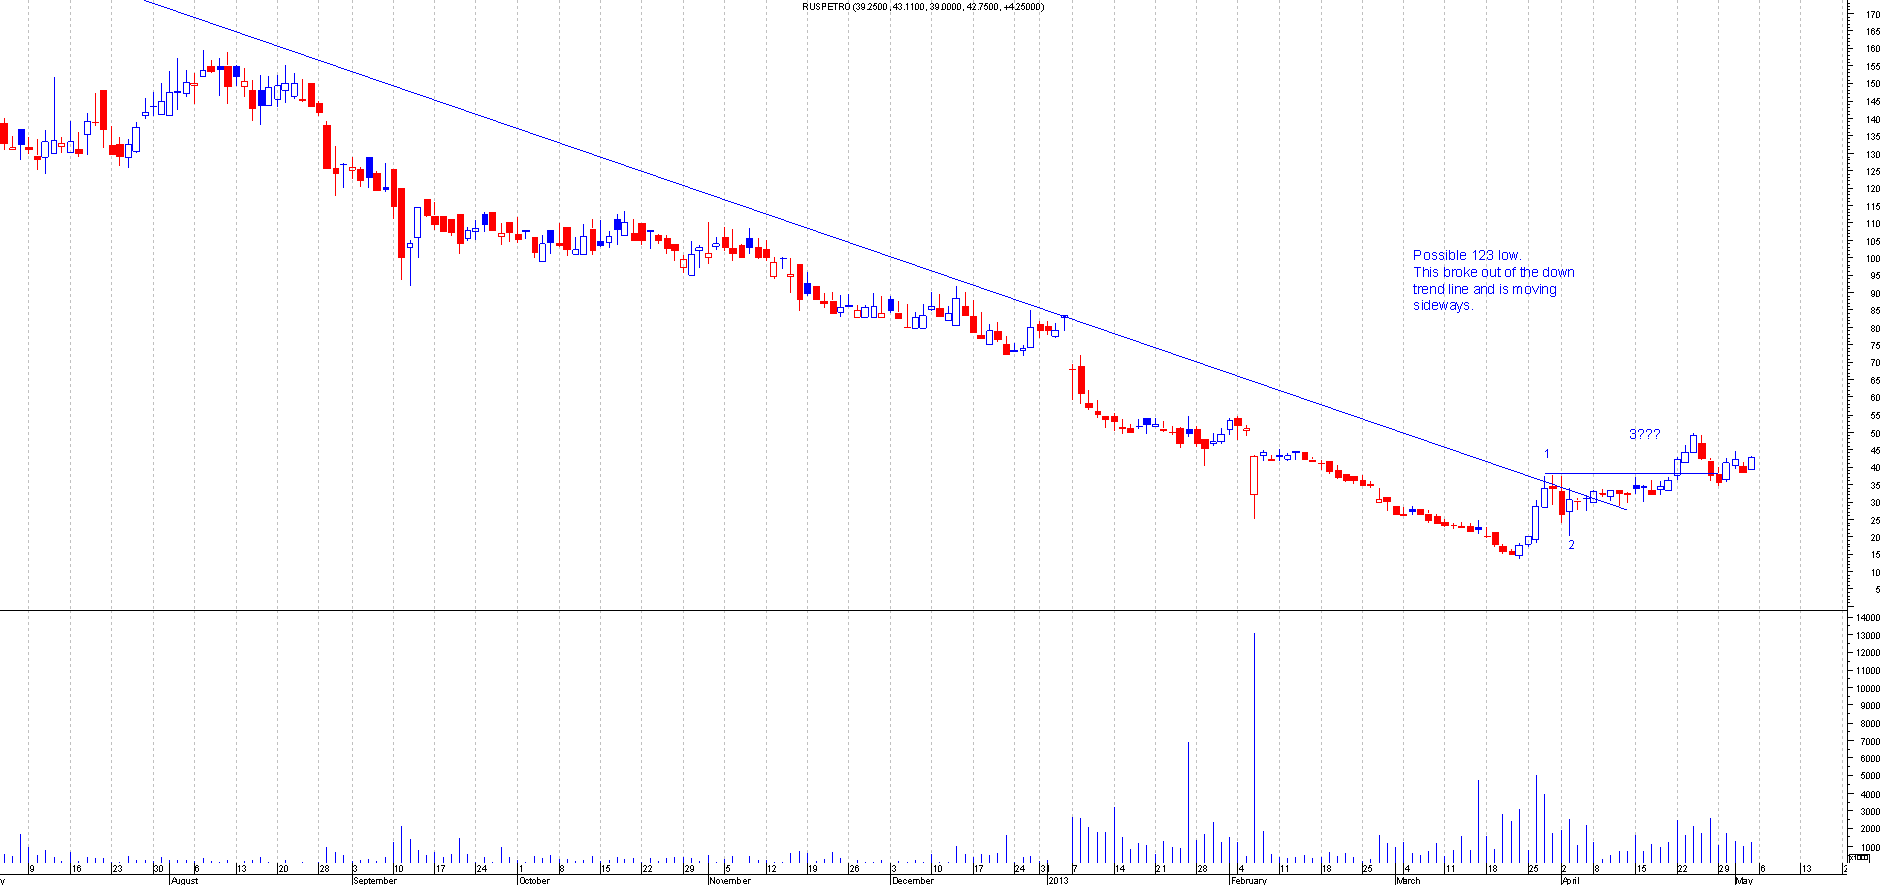
RPO.L
BEFORE: This is the Chart of Ruspetro when I first mentioned this:
AFTER: This broke out fast and moved away nicely from the 123 low breakout. This has since come back down and tested the breakout point, so should have made a nice profit on the initial entry:
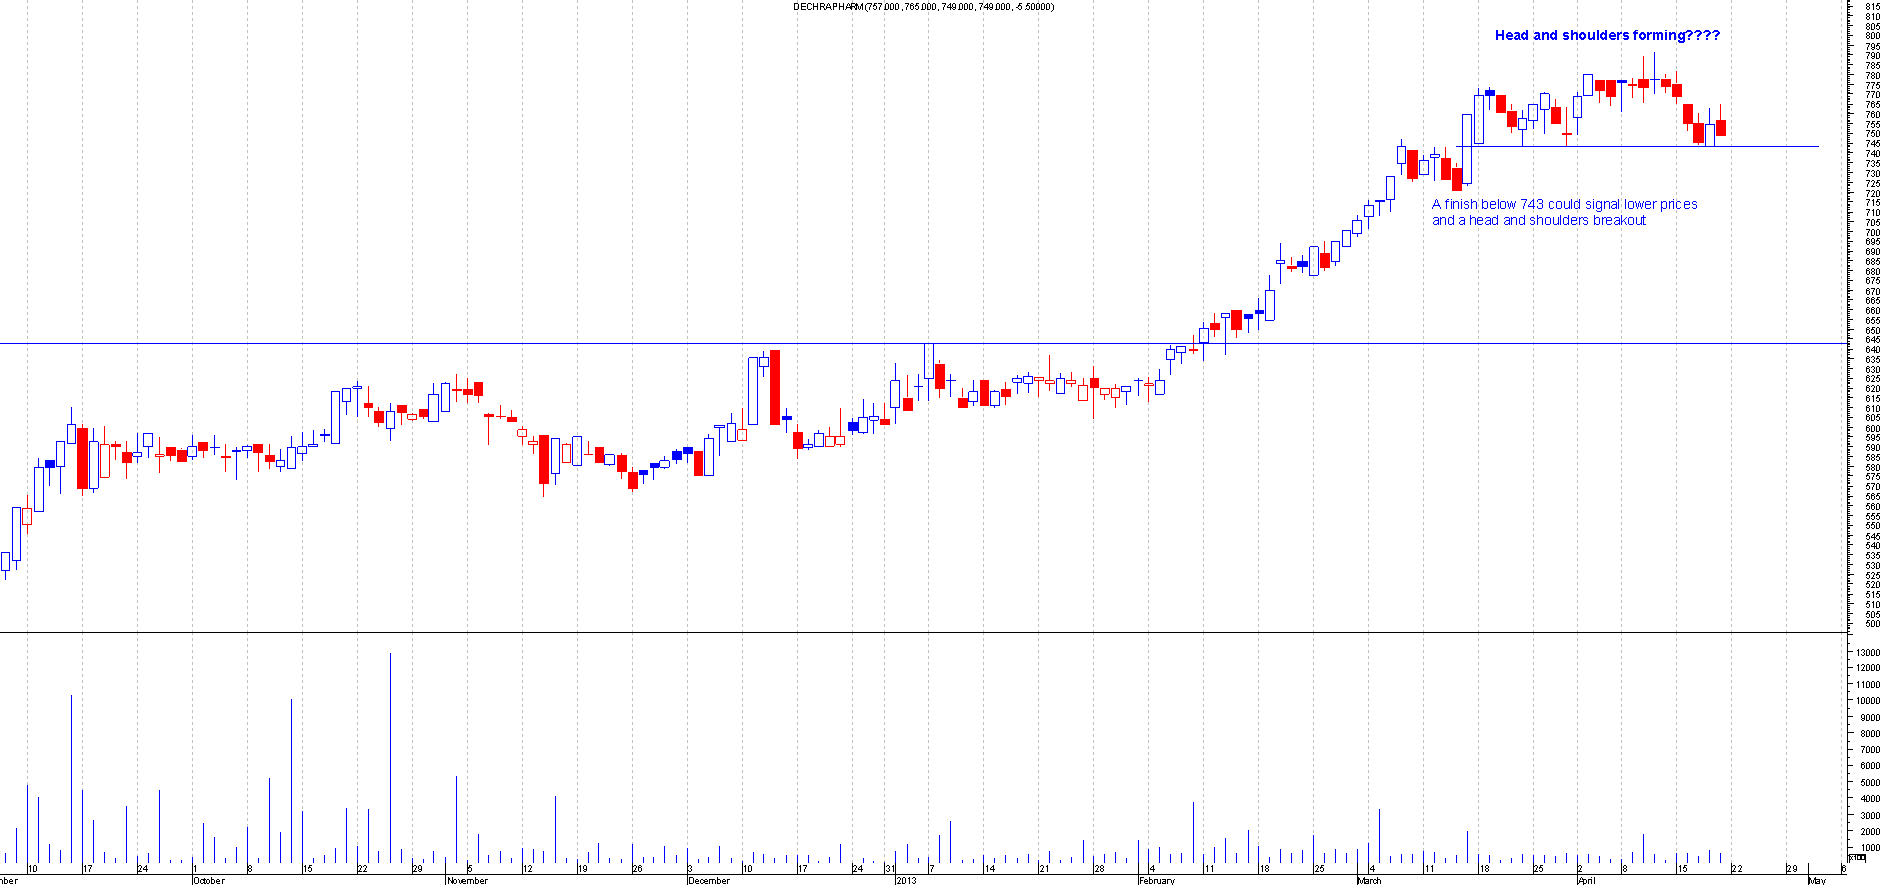
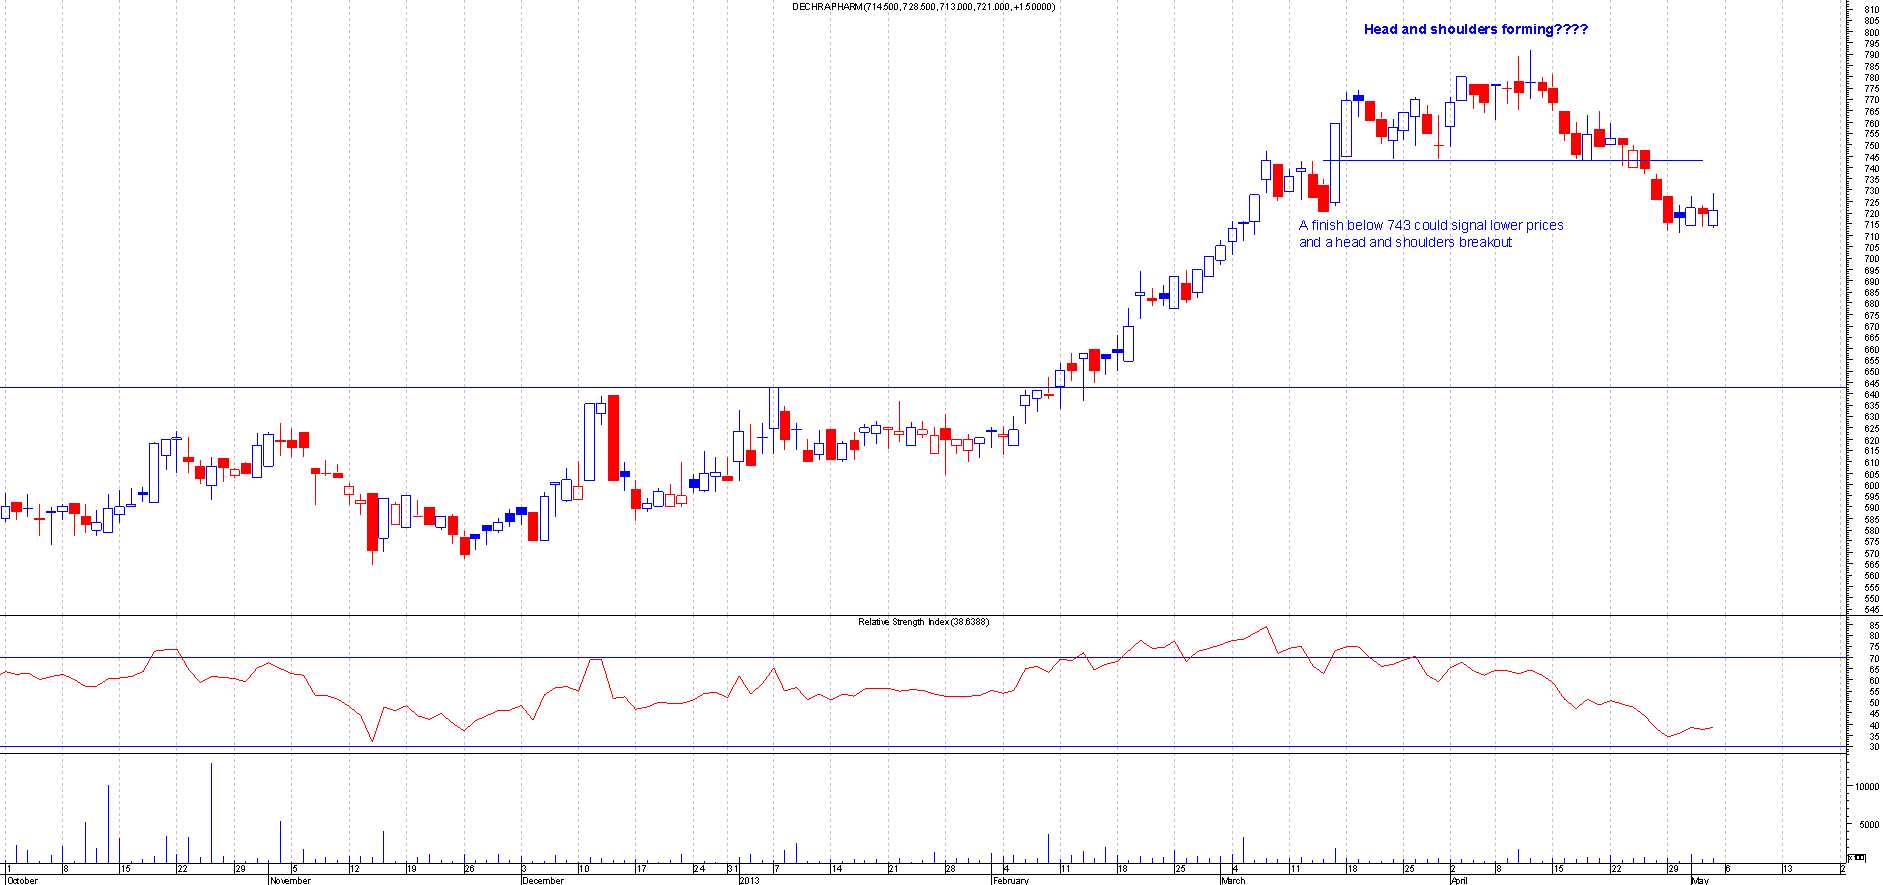
DECP.L
BEFORE: This is the chart of Dechra Pharm when I mentioned this:
AFTER: This broke out of the head and shoulder pattern and moved away nicely. This may come back and test the breakout point so be aware, this should be a free trade now as it did move 30+ points from the breakout:
AFRE.L
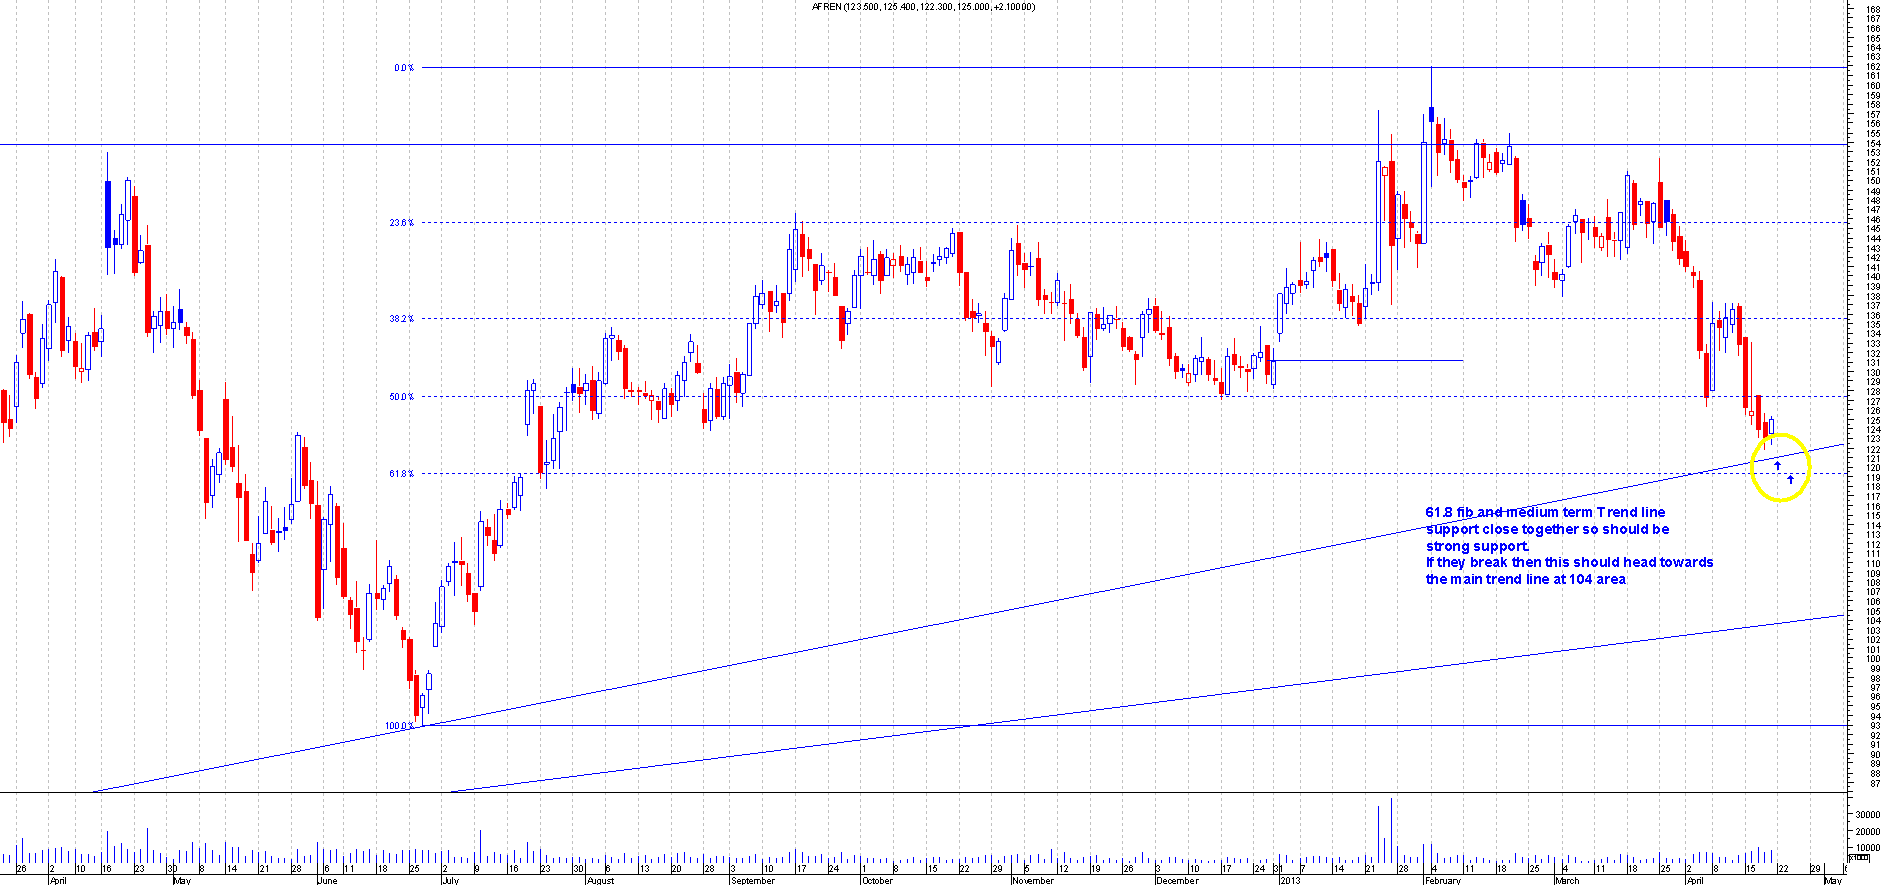
BEFORE: This is the chart of Afren when I first mentioned this:
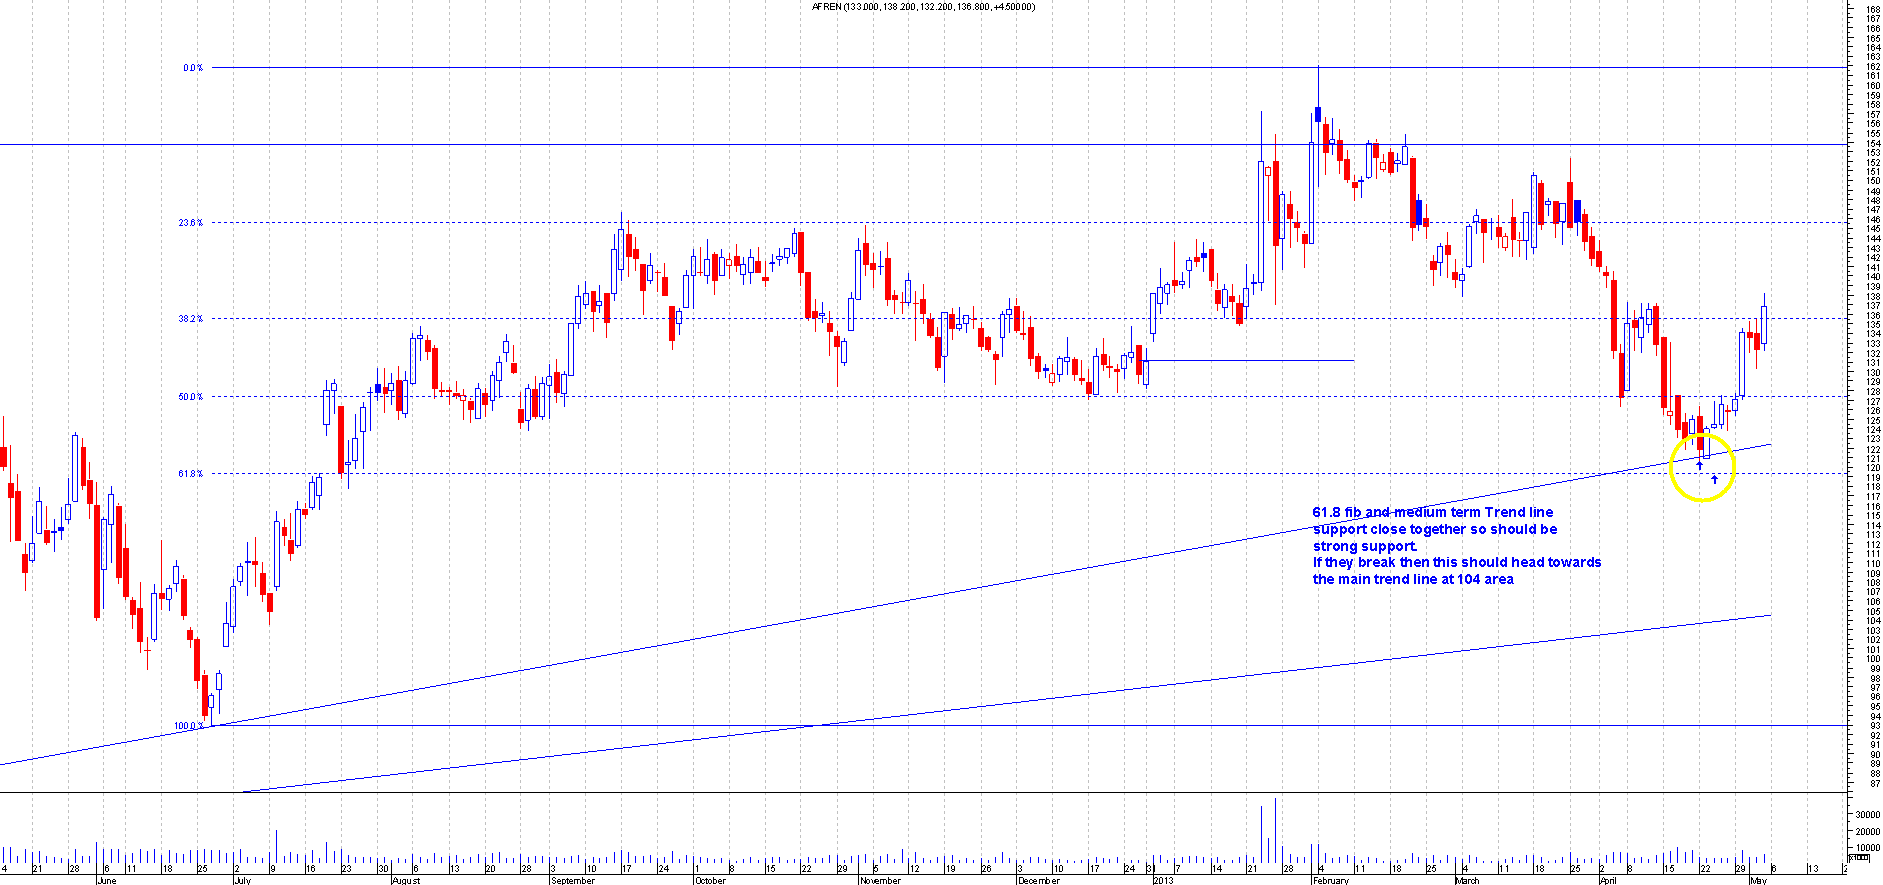
AFTER: This bounced of perfectly from the trend line and the 61.8 fib level. That was 2 levels of support close together so added to the strength of support there, this has moved away nicely from that area and now should be a free trade:
29th April 2013
BG.L
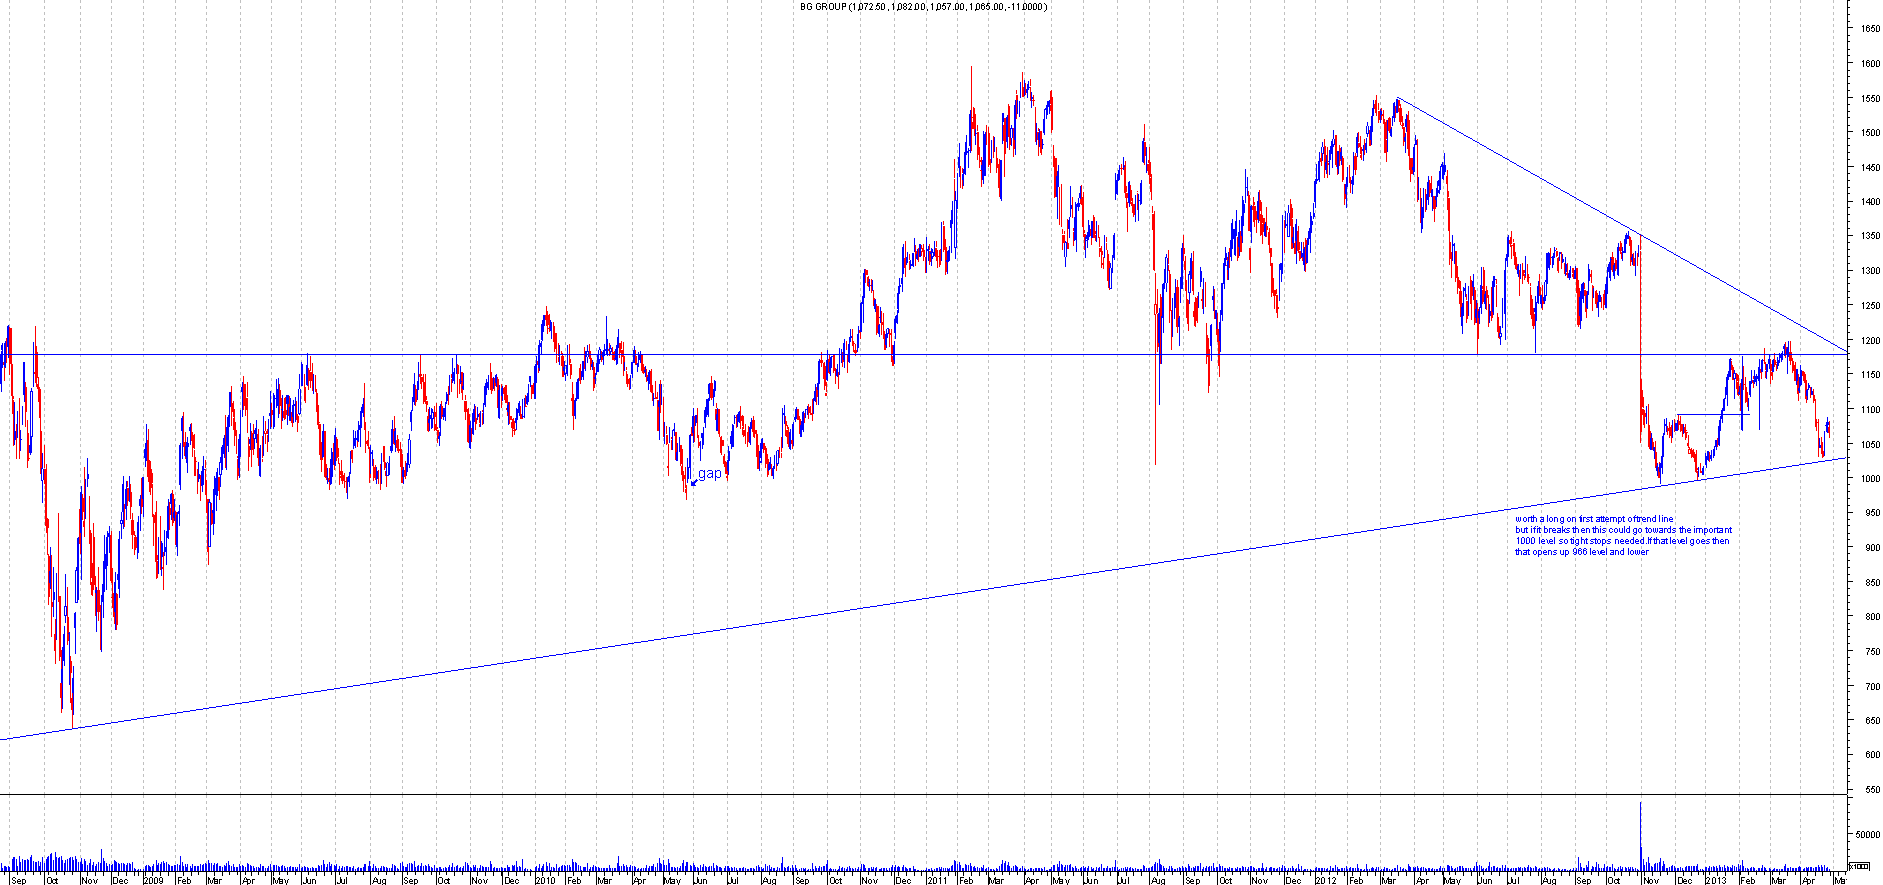
BEFORE: This is the chart of BG Group when I mentioned this, I updated fellow traders on the discussion board on the potential 123 low formation:
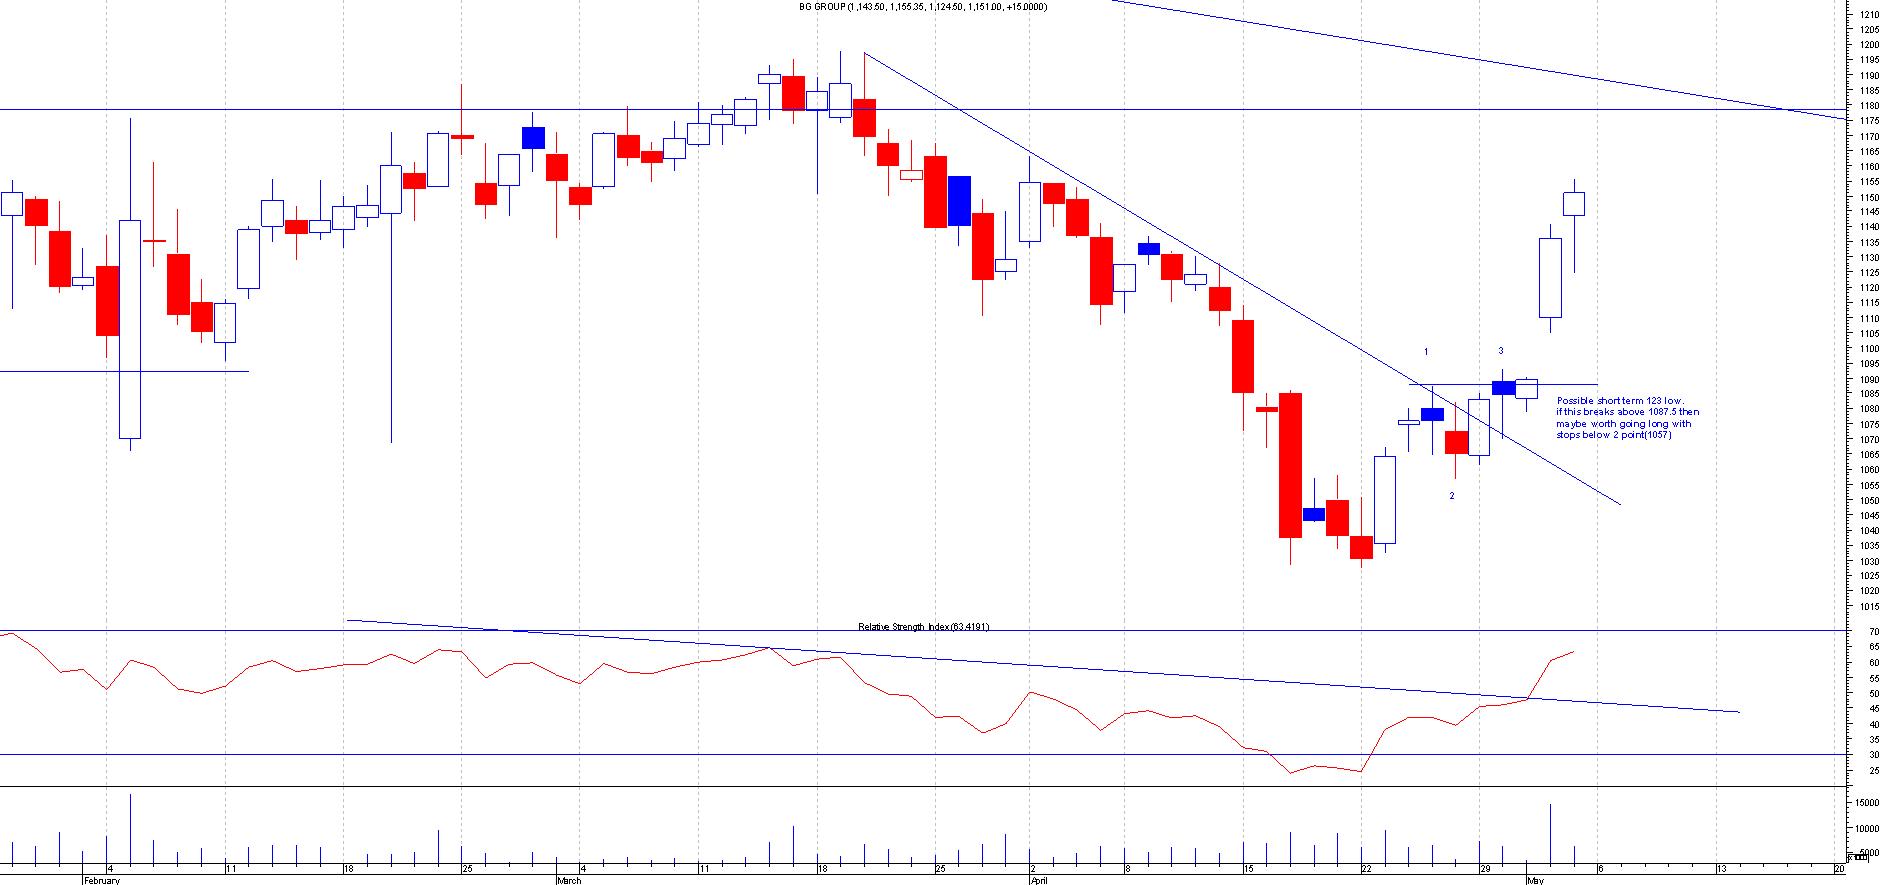
AFTER: This was mentioned on the forums when the 123 low formation appeared so that fellow traders could get a chance to enter early:
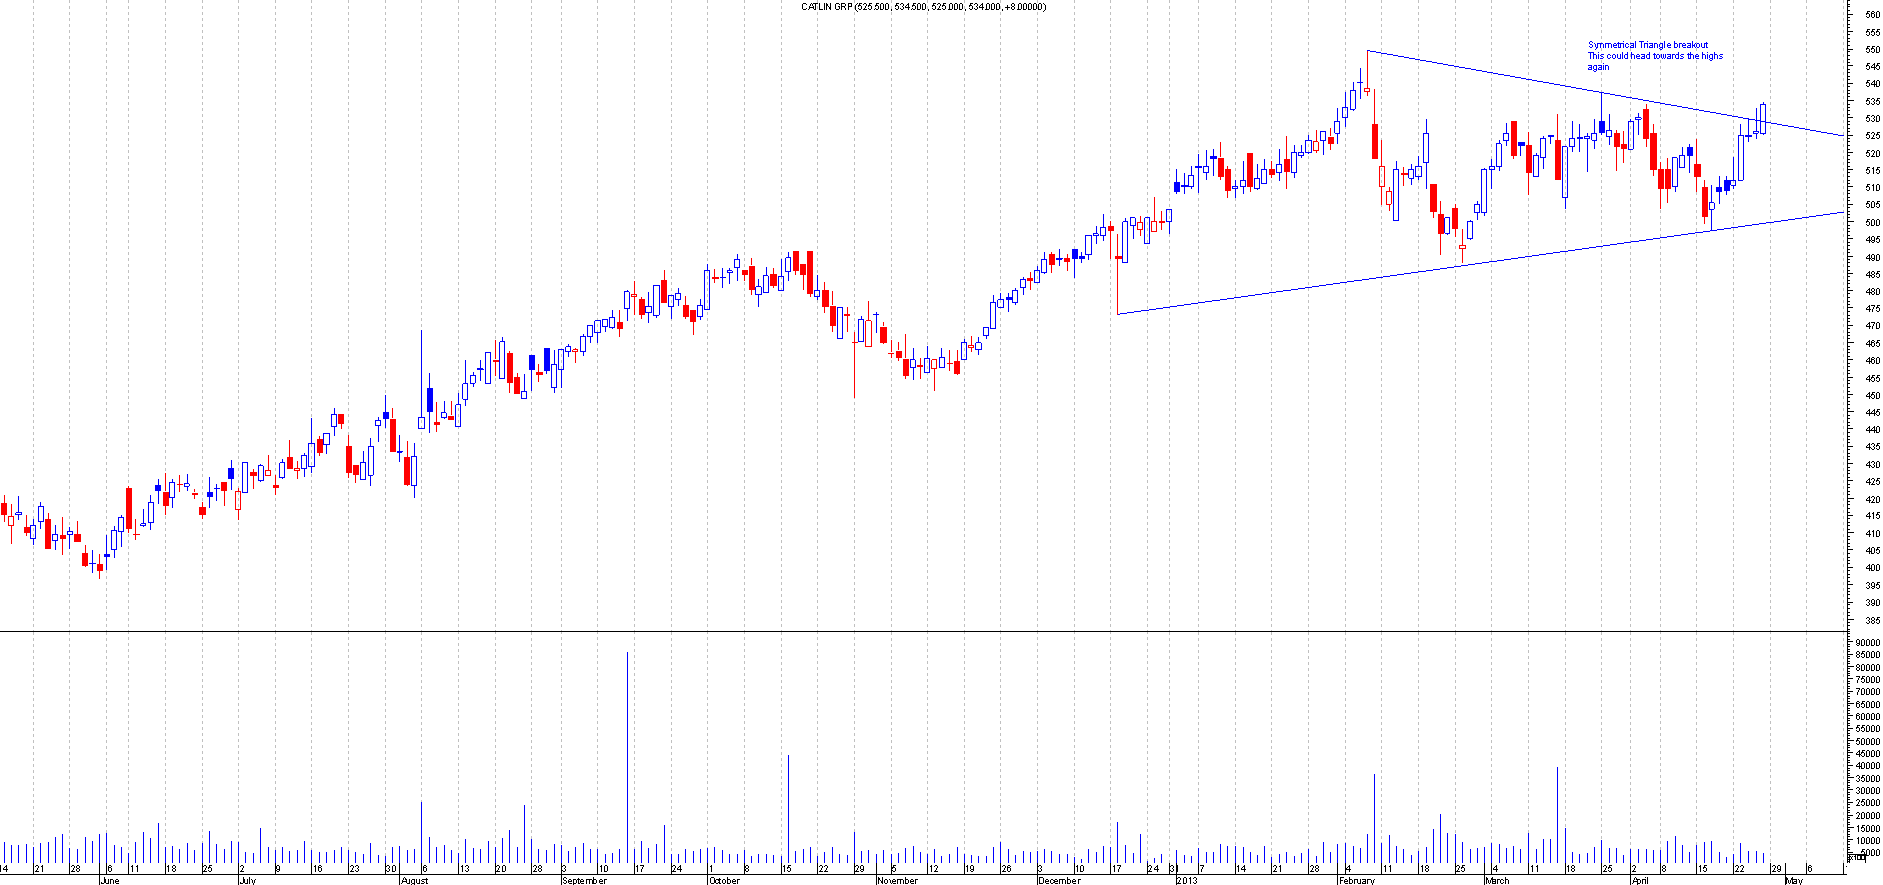
CGL.L
BEFORE: This is the chart of Catlin Group when I first mentioned this:
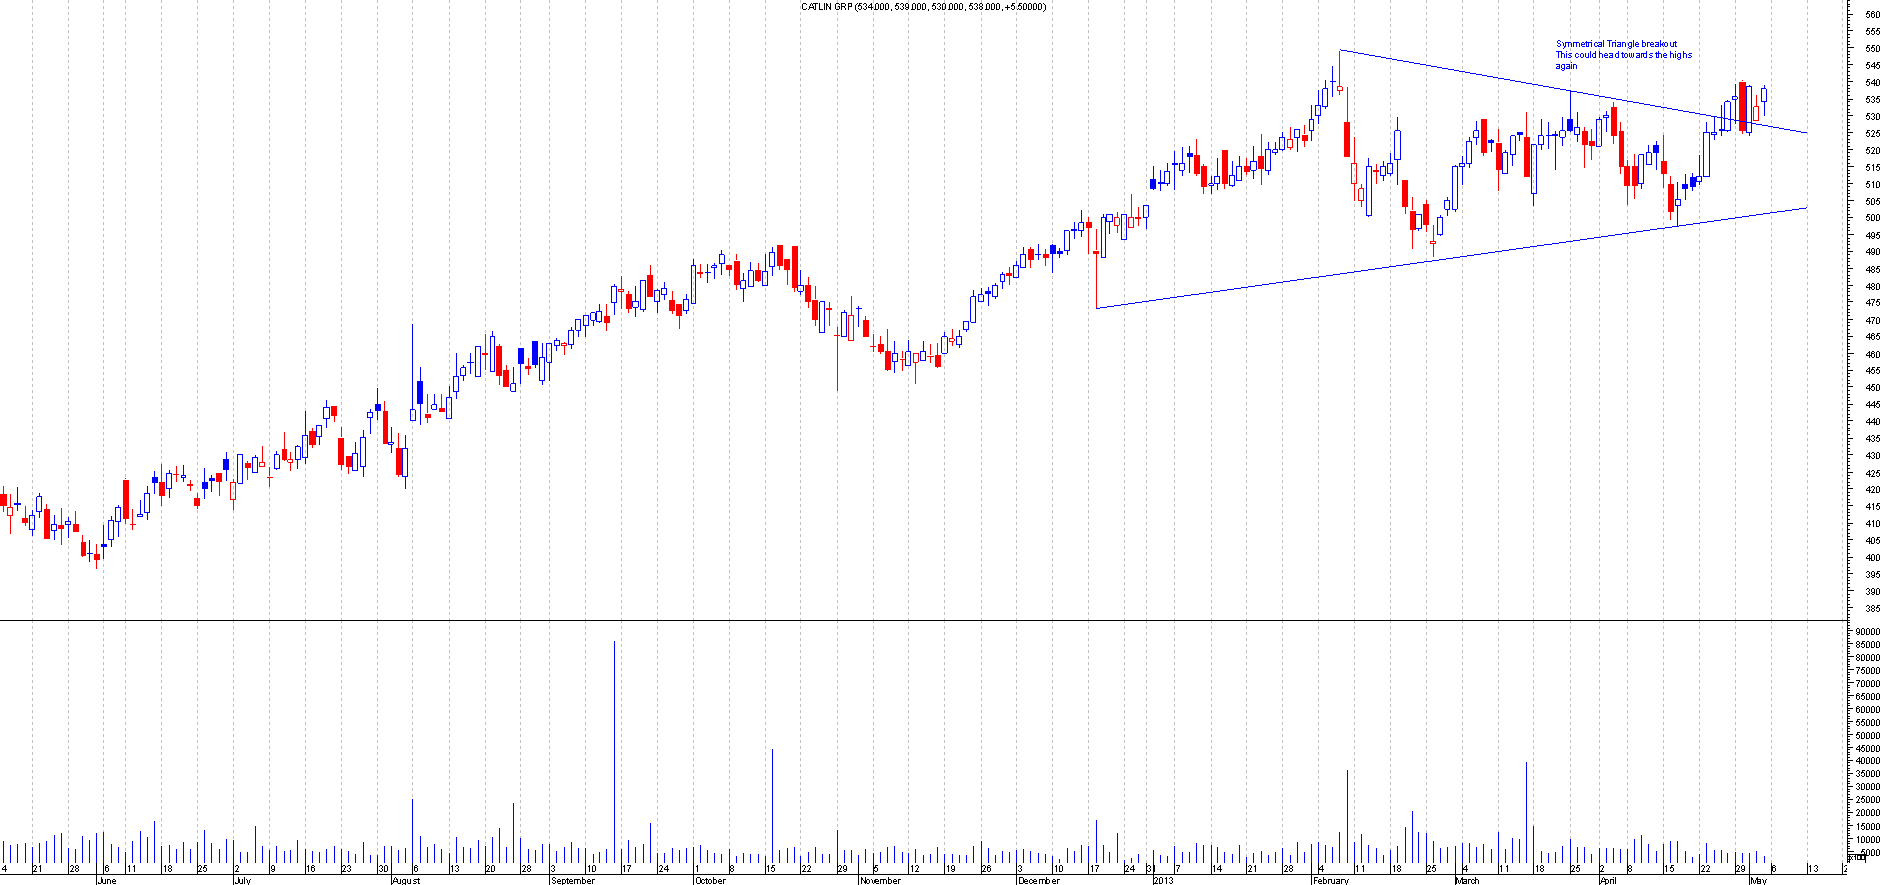
AFTER: This had a symmetrical triangle formation. This broke out of the triangle and had moved higher but has since come back down and tested the breakout point. It has moved away again since:
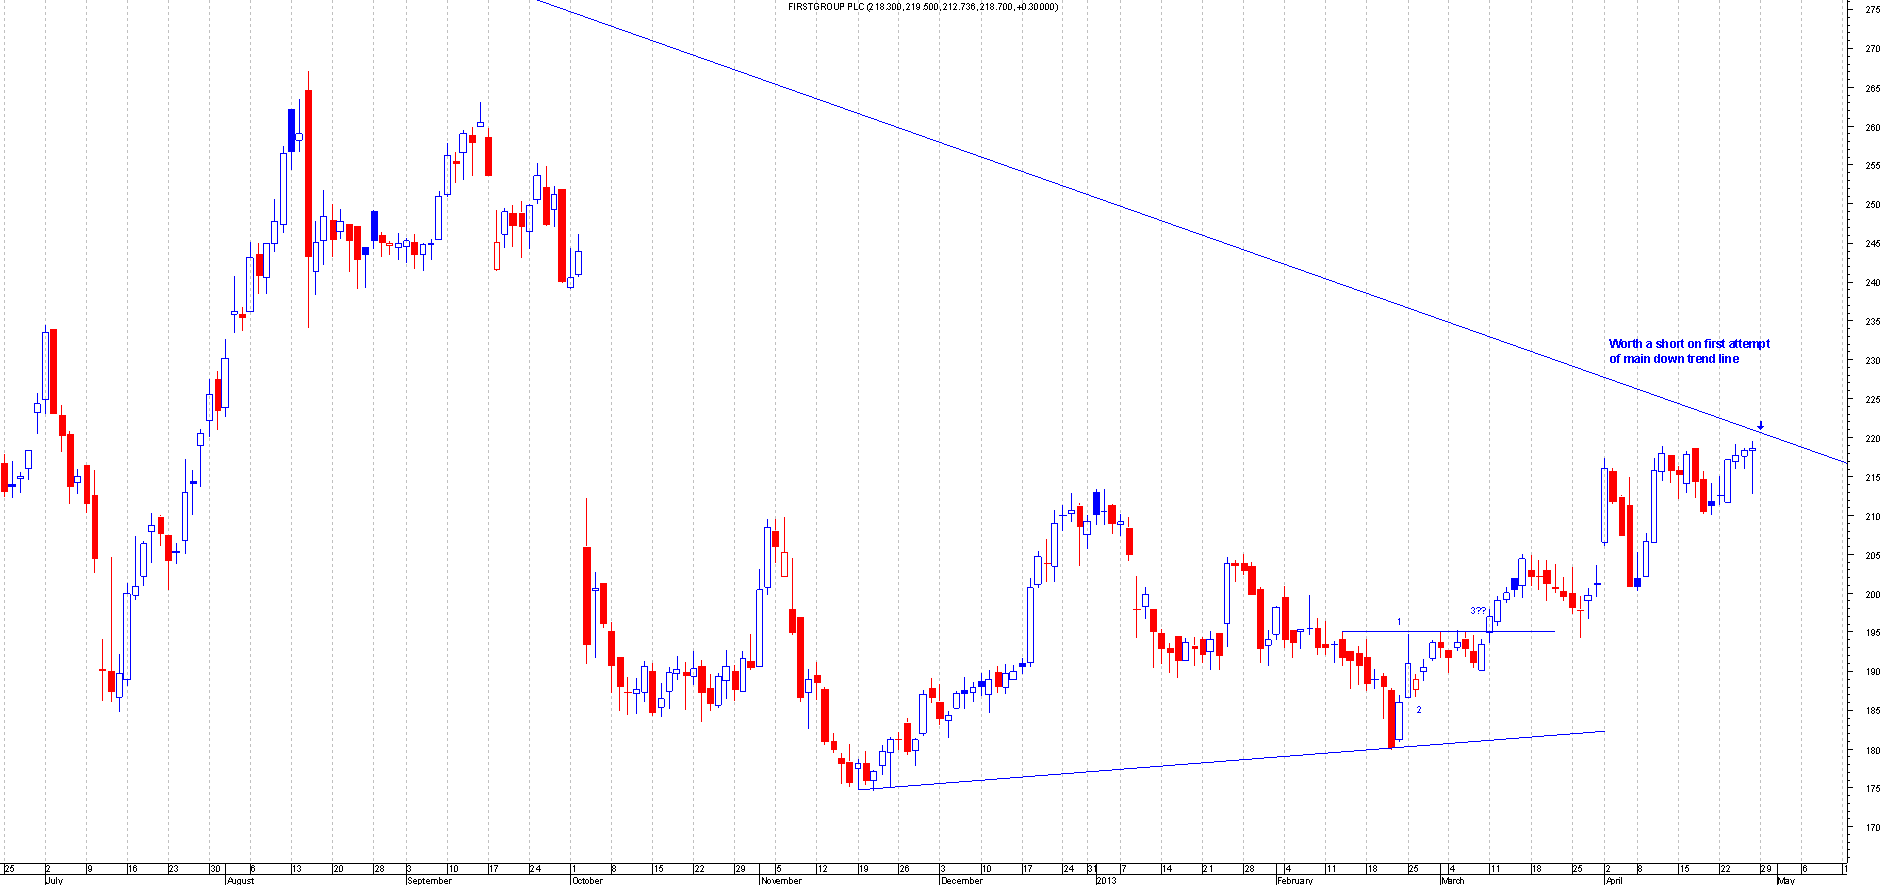
FGP.L
BEFORE: This is the chart of FirstGroup PLC when I mentioned this:
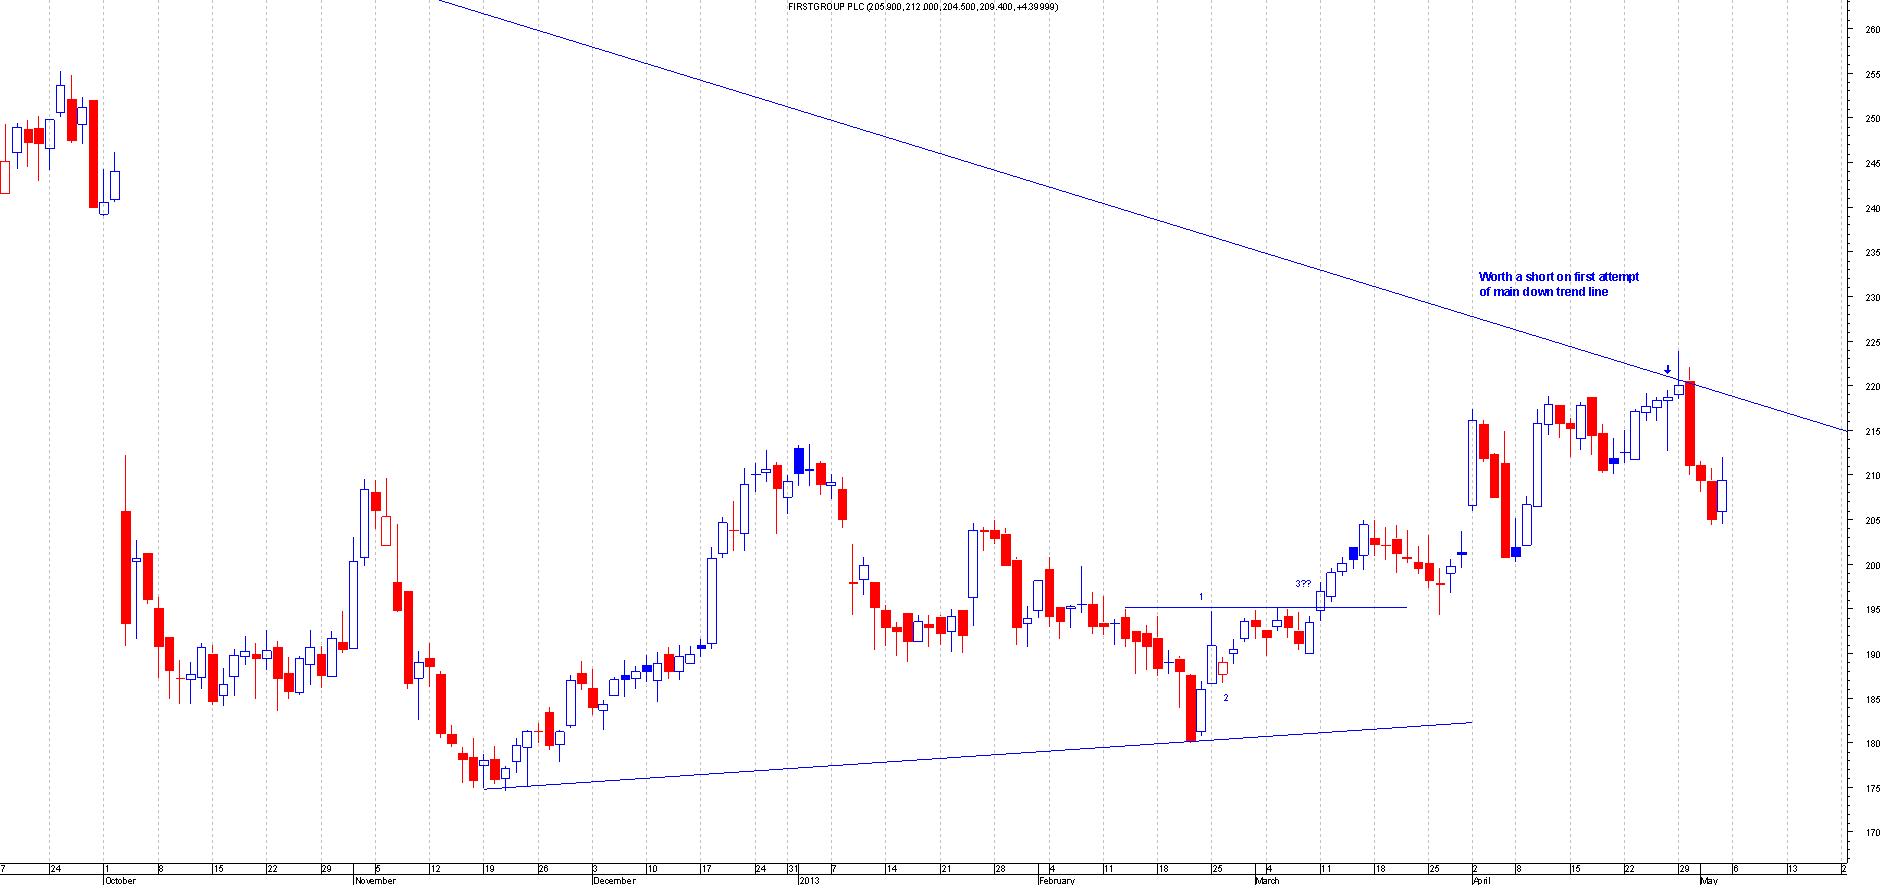
AFTER: This tested the main down trend line perfectly and reversed. This shows the power of a down trend line in action. This should be a free trade now as this moved nicely away from the trend line. I have been trading this share regularly and have posted comments on the discussion board with regards to this. This has been fairly easy to read technically.
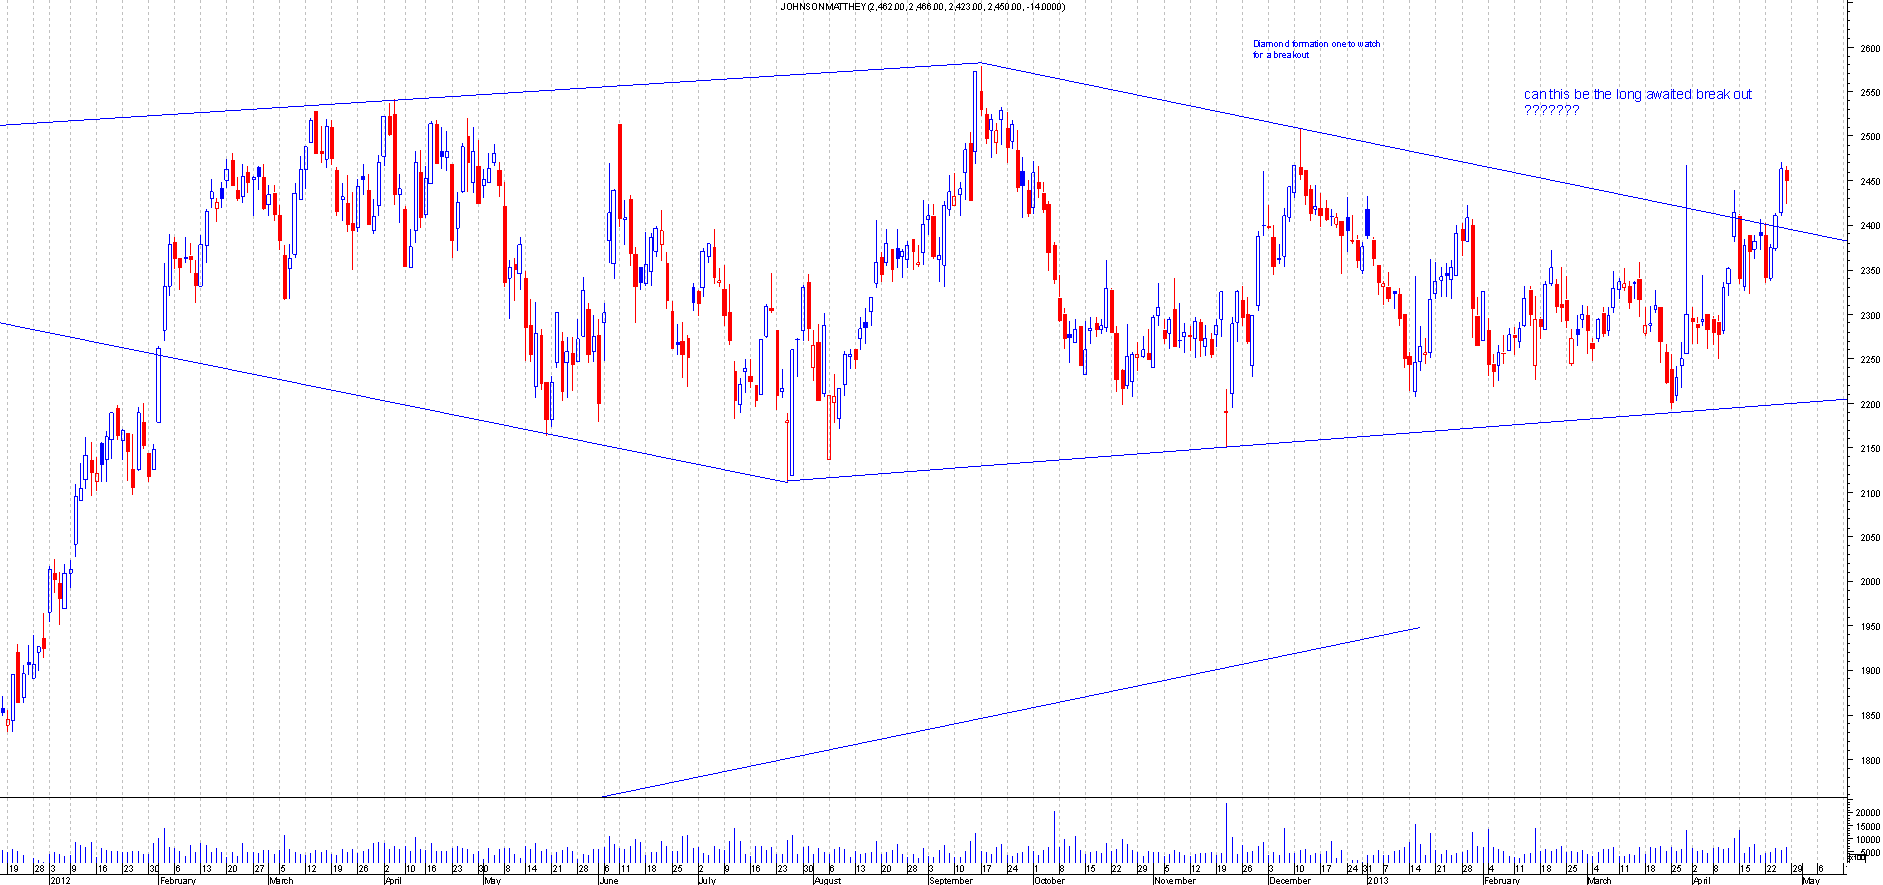
JMAT.L
BEFORE: This is the chart of Johnson matthey when I mentioned this:
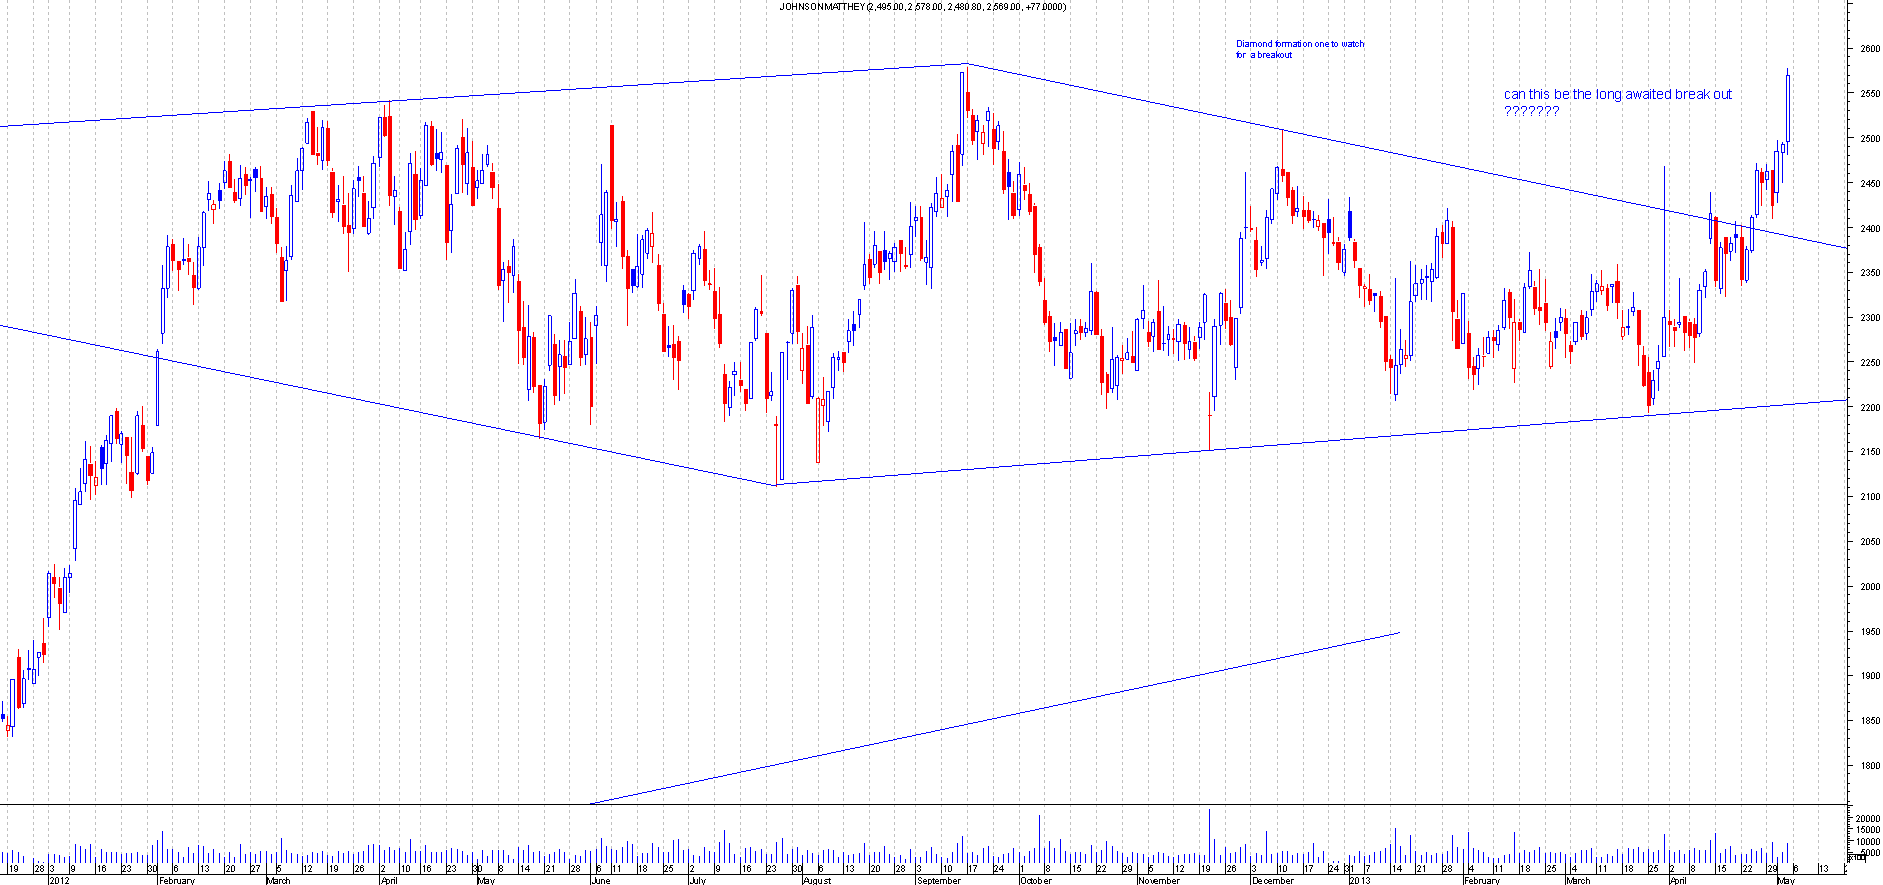
AFTER: This Broke out of the Diamond formation and has since moved rapidly away. This is a very rare pattern in technical analysis, its been mentioned a few times on the discussion board with regards to the diamond formation and it's been on my radar for a long time. This trade required a lot of patience as it took a long while to build out the diamond formation, however it proved very profitable in that regards. This should be a free trade now:
As can be seen from the charts aboave it's well worth following the interesting chart section on ChartsView. The best way to use the Interesting Chart section is to save all the companies into a charting software so that you can monitor it regularly. I use MetaStock Pro charting software powered by Thomson Reuters, which is a professional full-featured real-time trading package. If you would like to use it too then please take up our great offer: MetaStock Pro FREE for 2 months through ChartsView.
Get it Now: MetaStock Software Free for 60 days
It's worth the trial, you get to use professional software for free and there is no obligation to buy and it's the best way to monitor the shares.
I update the interesting chart section ever week for the coming week ahead. These are the charts that I feel would have a great chance of a good trade based on a short term trading.This section is not for the long termers so bear that in mind.
Please feel free to join fellow traders on the discussion forums but please bear in mind that the forums are only for the serious traders and not really for kids hense the subscription fee. Its only £39.95 for the year but you get great tips and a great bunch of real active traders from around the world on there and much more. There is also a free 7 day trial to test out the great features on the site please check out the options and join a growing successful stock trading community: ChartsView Membership
Hope you have learned from this blog, Happy Trading!