This is an update to the Interesting Chart section on www.chartsview.co.uk, this section is updated every week and provides shares that have great potential for the coming weeks. In this blog I will be looking at how well these tips have done by showing you the before and after picture.
The interesting chart section needs to be looked at on a regular basis as some times the companies that have been put up only move or brake out a few weeks later. It can be hard to go through all the charts but for people that have MetaStock or any other professional charting package it would be easier to keep track, as you would just have to save them on to your charting package and view them daily.
Here goes....
18th March 2013
DOM.L
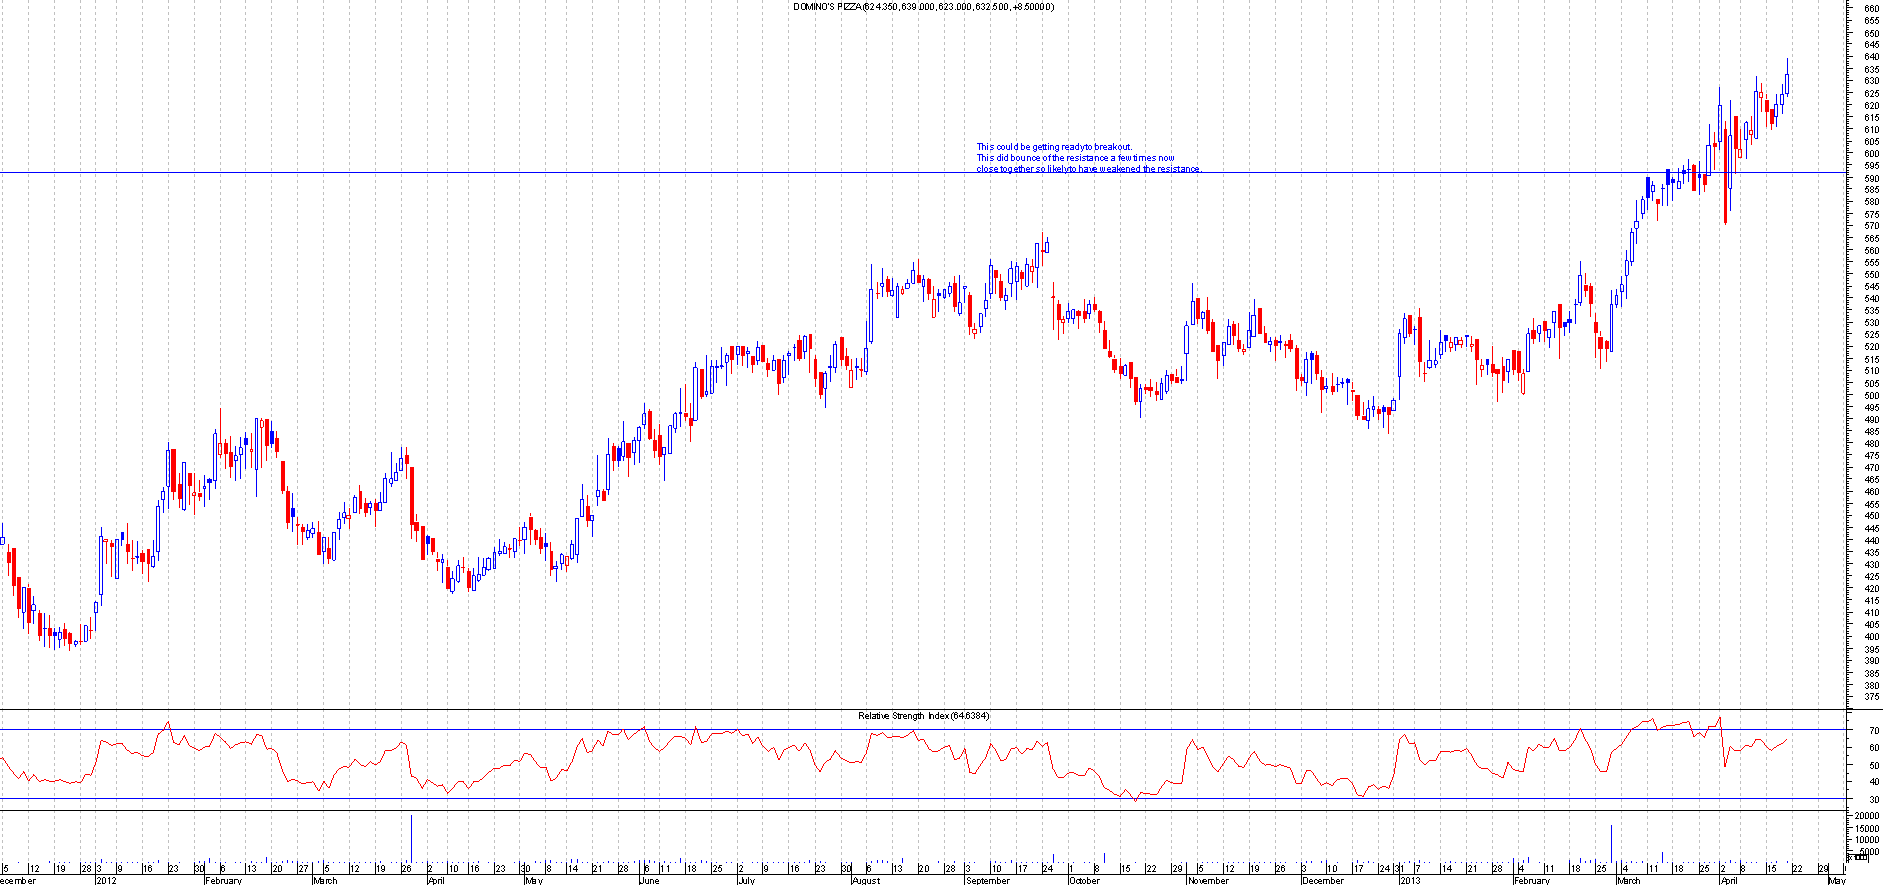
BEFORE This is the chart of Domino's when I mentioned this:
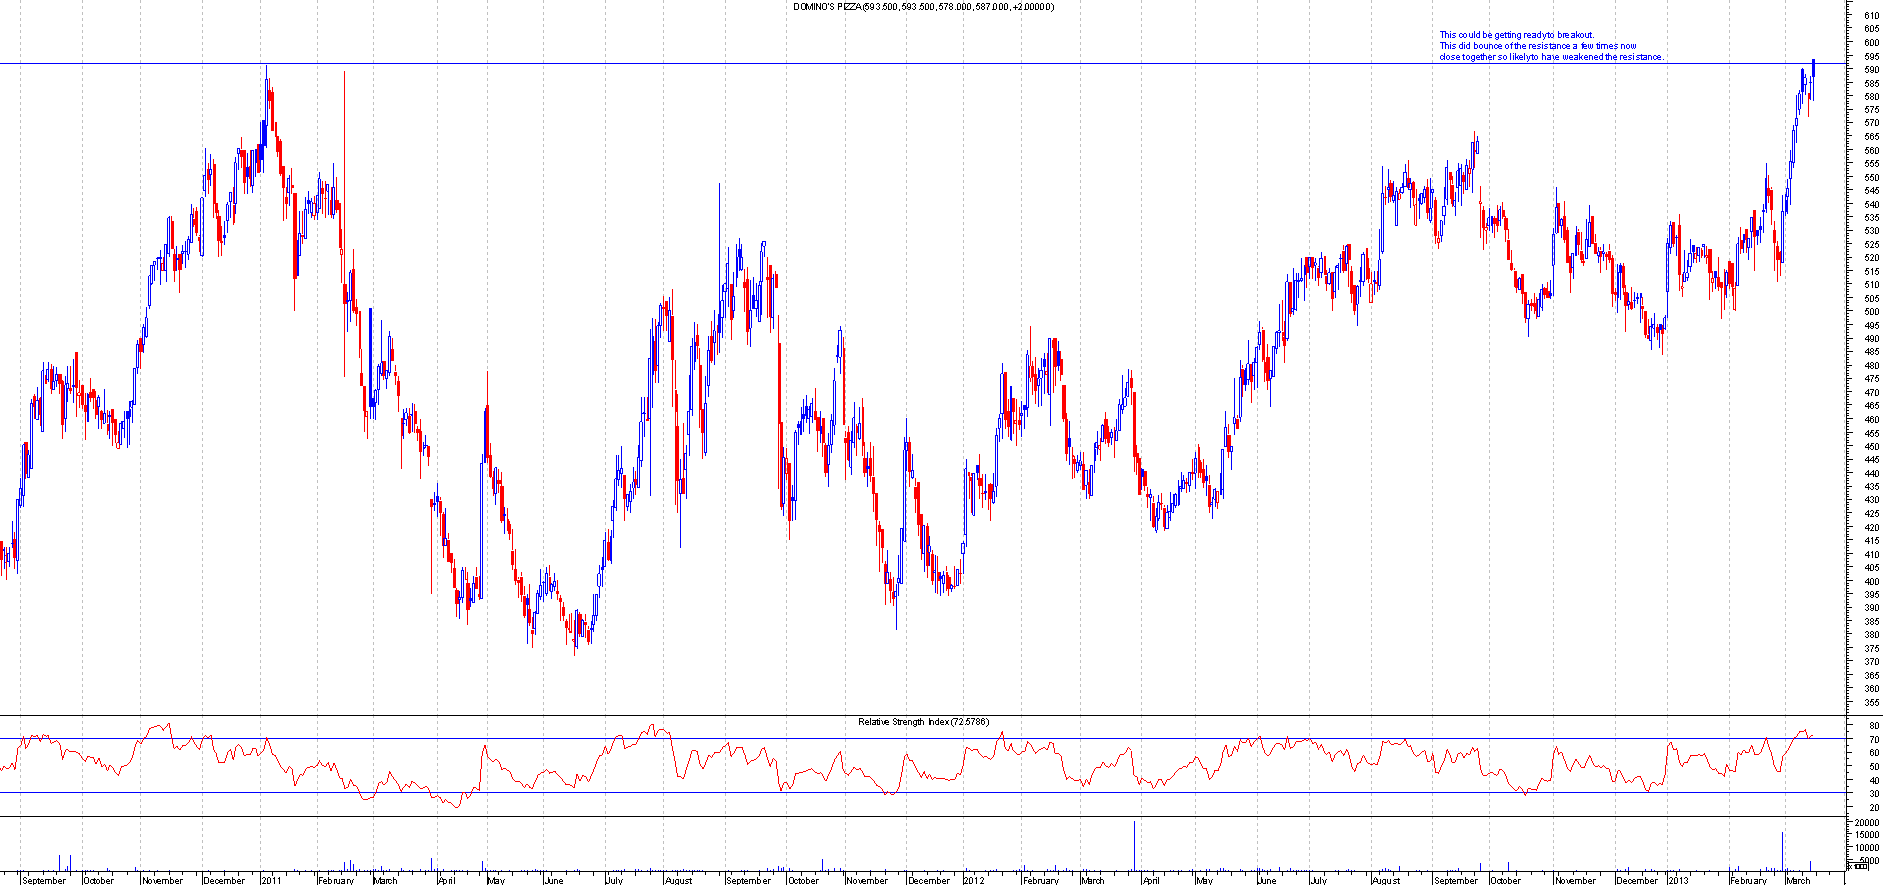
AFTER: This has moved 40 points higher from the breakout point, this is where it is currently:
SVT.L
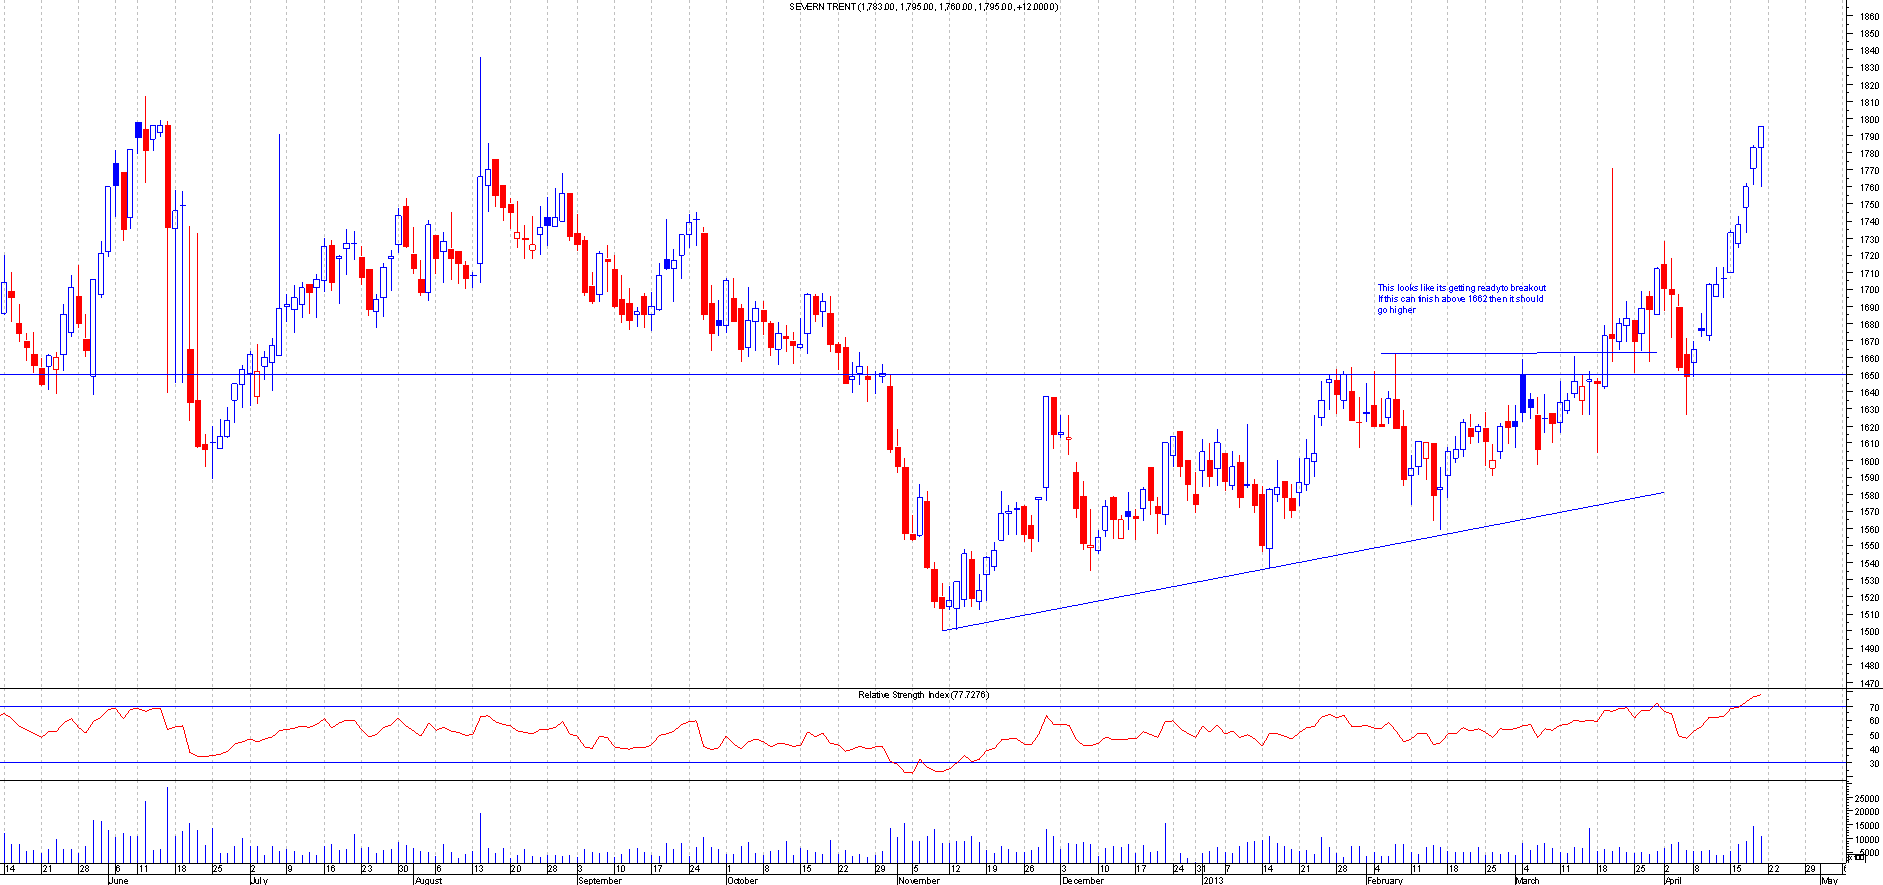
BEFORE: This is the chart of Severn Trent when I mentioned this:
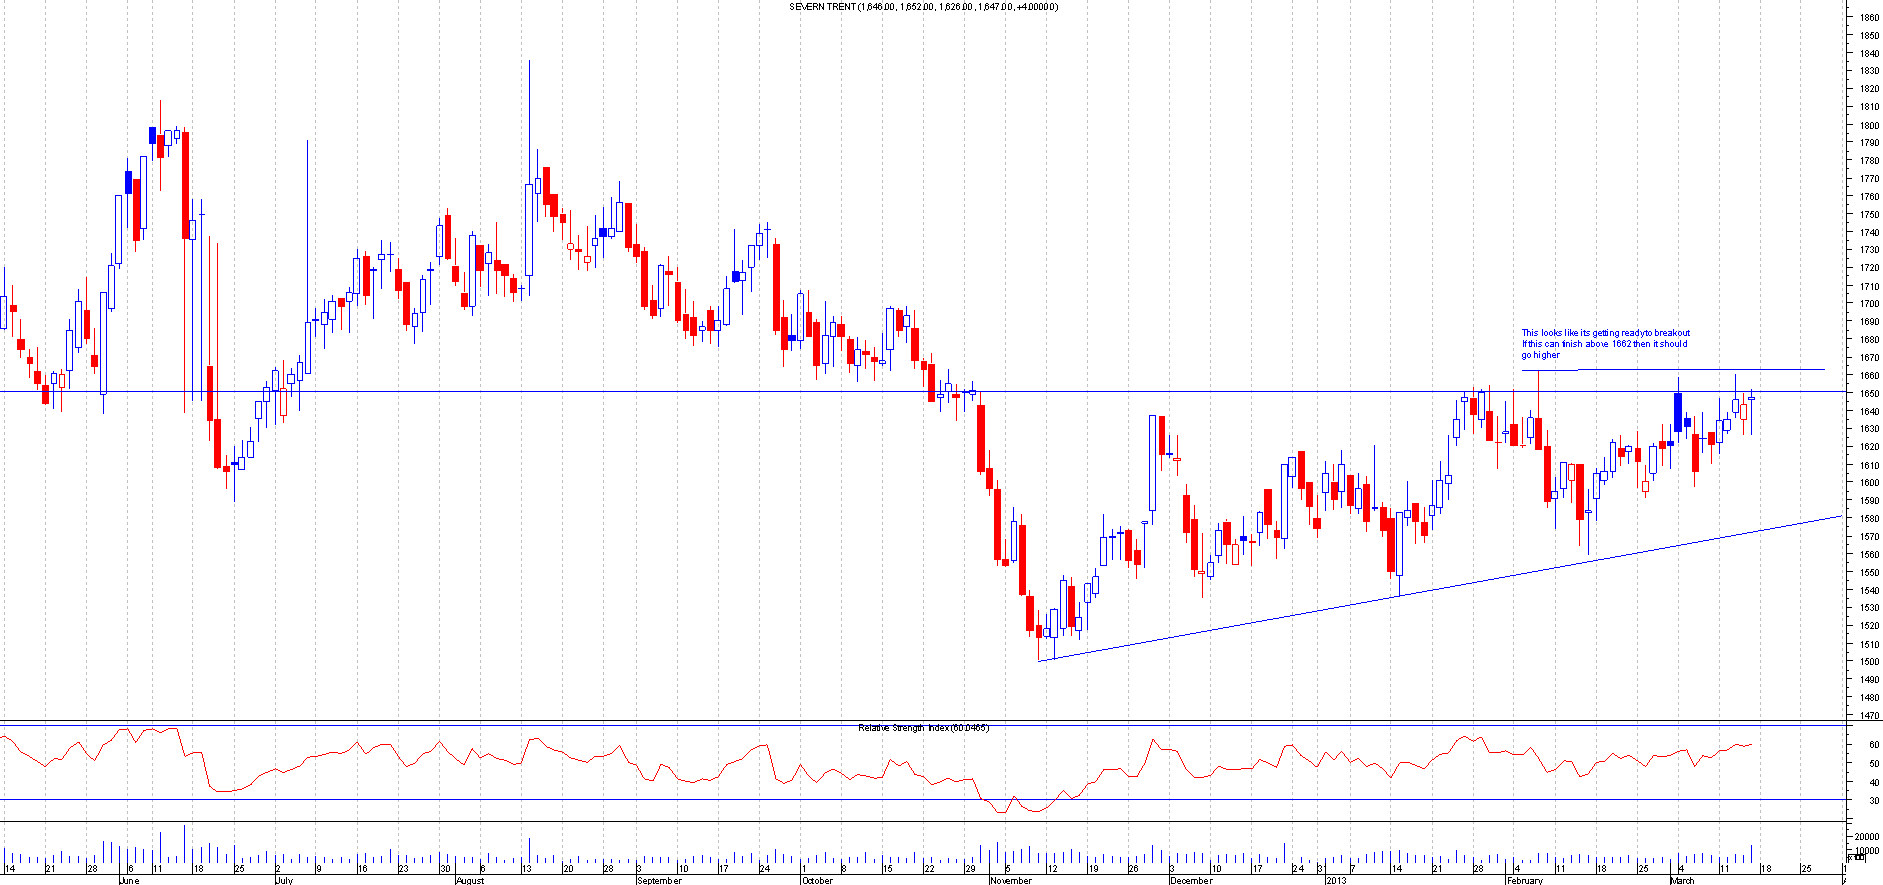
AFTER: This moved nearly 150 points away from the breakout point, this is where it is now:
SPX.L
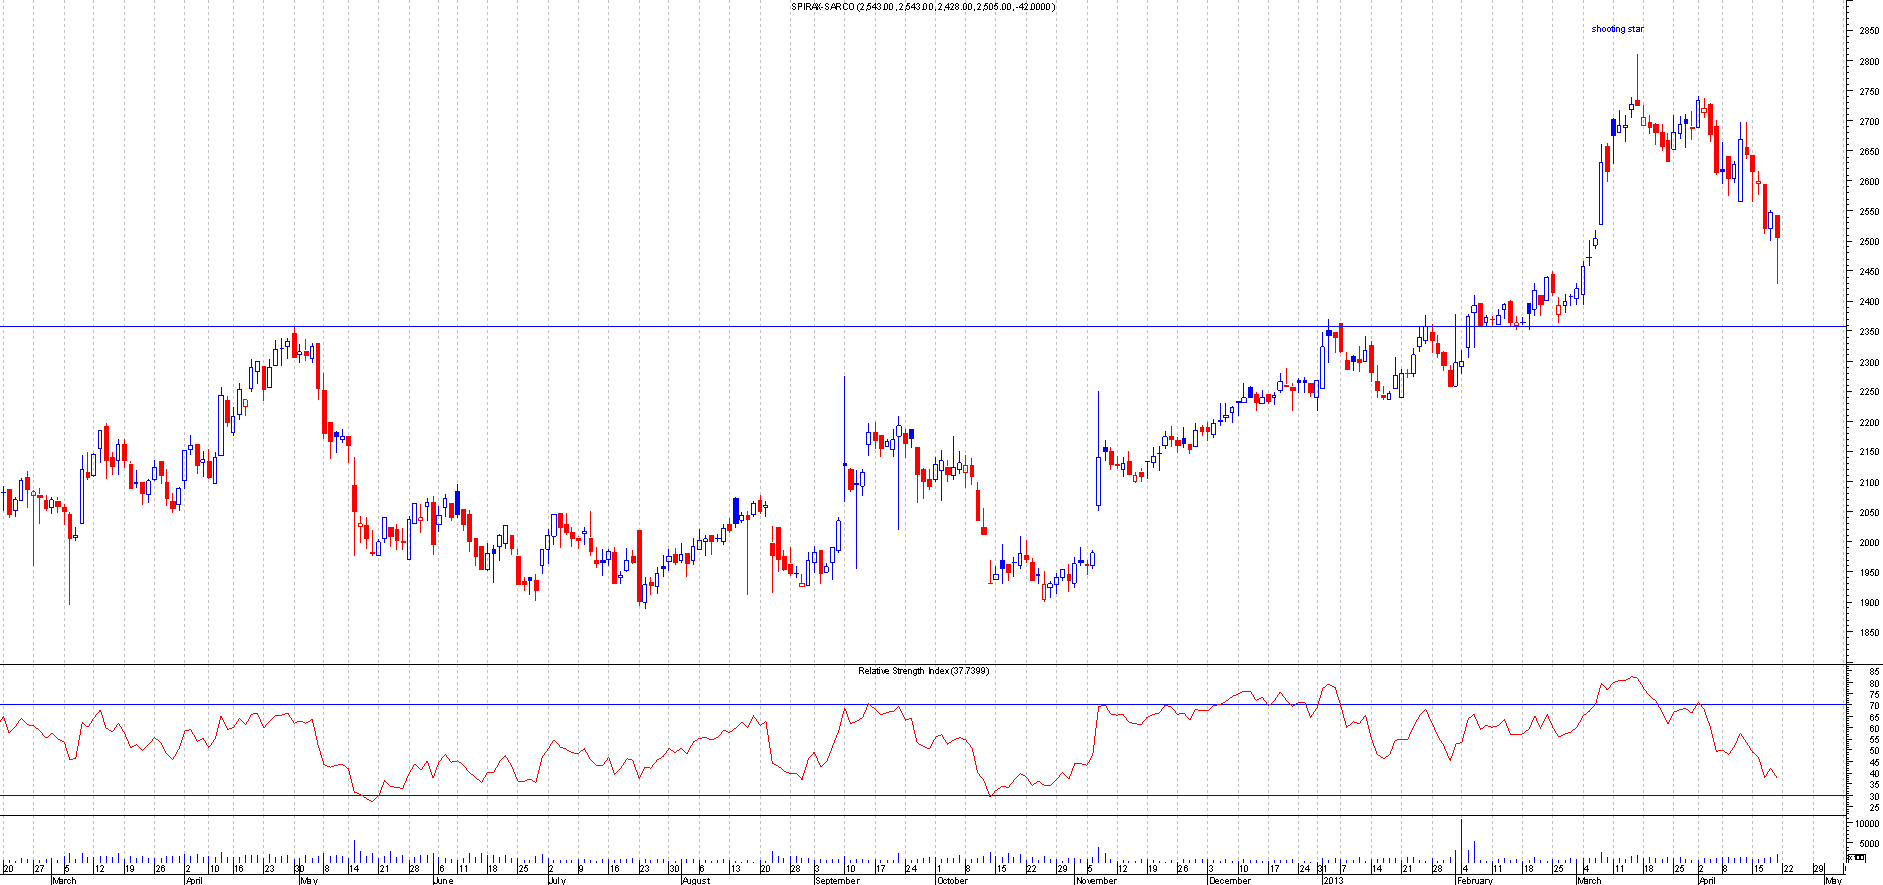
BEFORE: This is the chart of Spirax Sarco when I mentioned this:
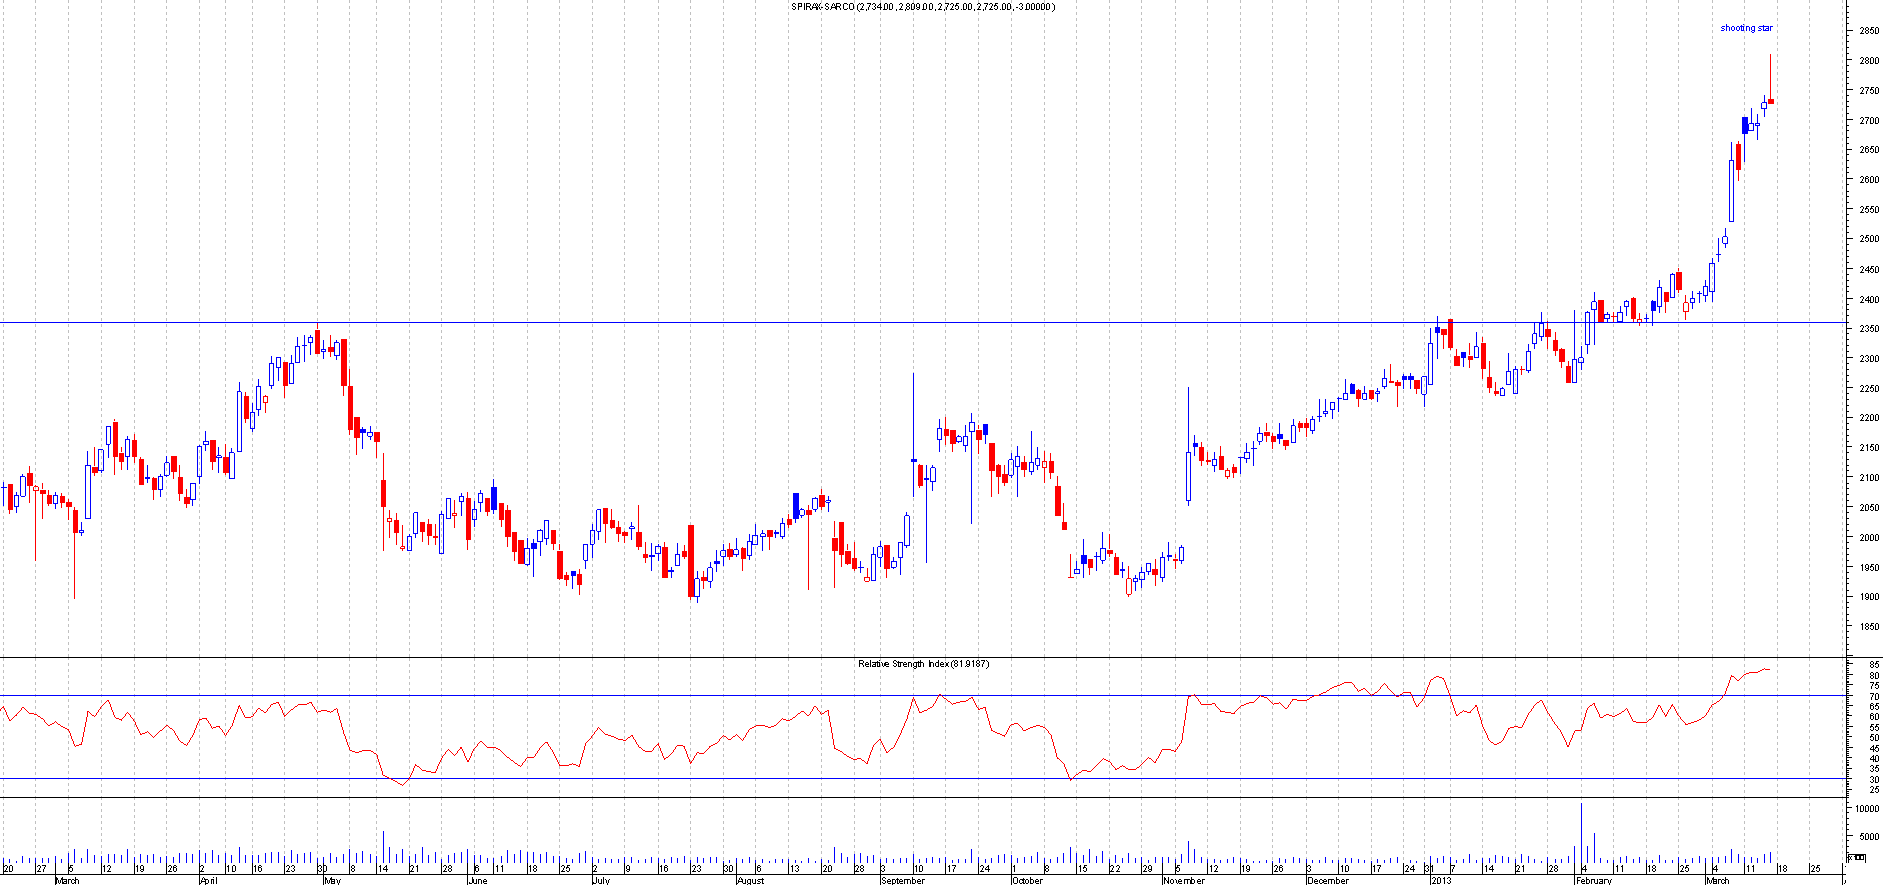
AFTER: This moved 300 points from the shooting star, this is where it is today:
25th March 2013
RRS.L
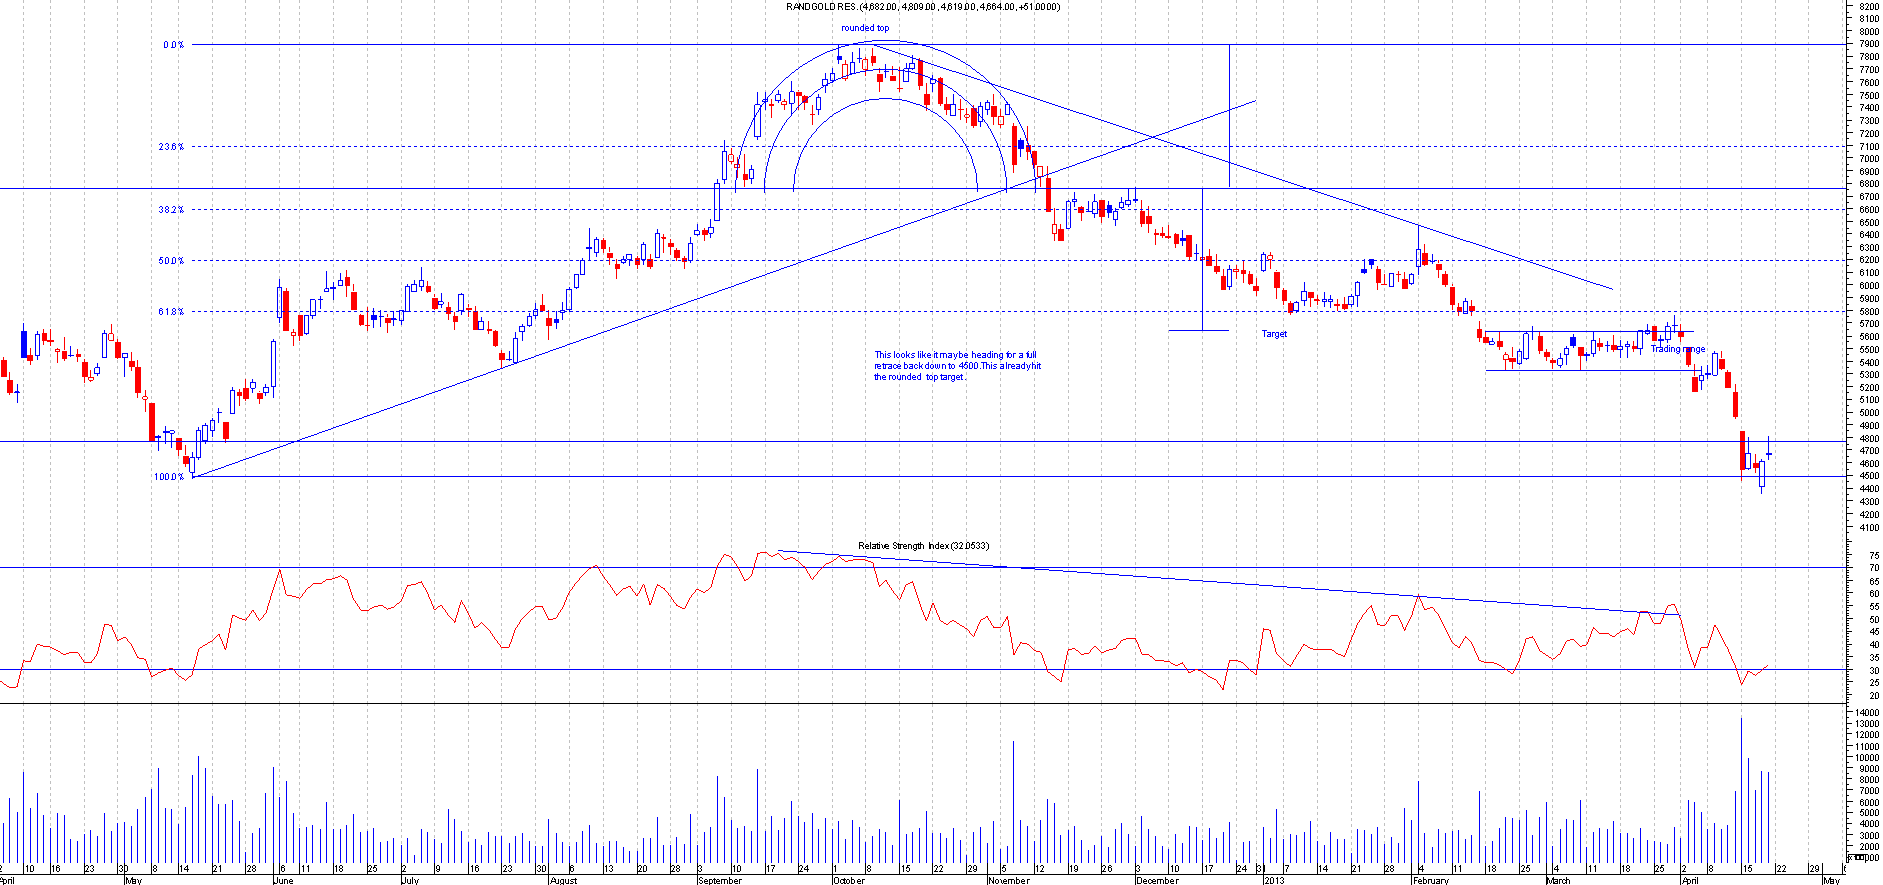
BEFORE: This is the chart of Randgold when I mentioned this:

AFTER: This had a false breakout to the upside but followed this with a proper breakout to the down side and has moved nearly 1000 points. Trading range target got hit pretty quickly. This share has a habit of moving fast, This was originally tipped for a short, back when this was in 6760 from a rounded top formation, This is where it is today:
SMDS.L
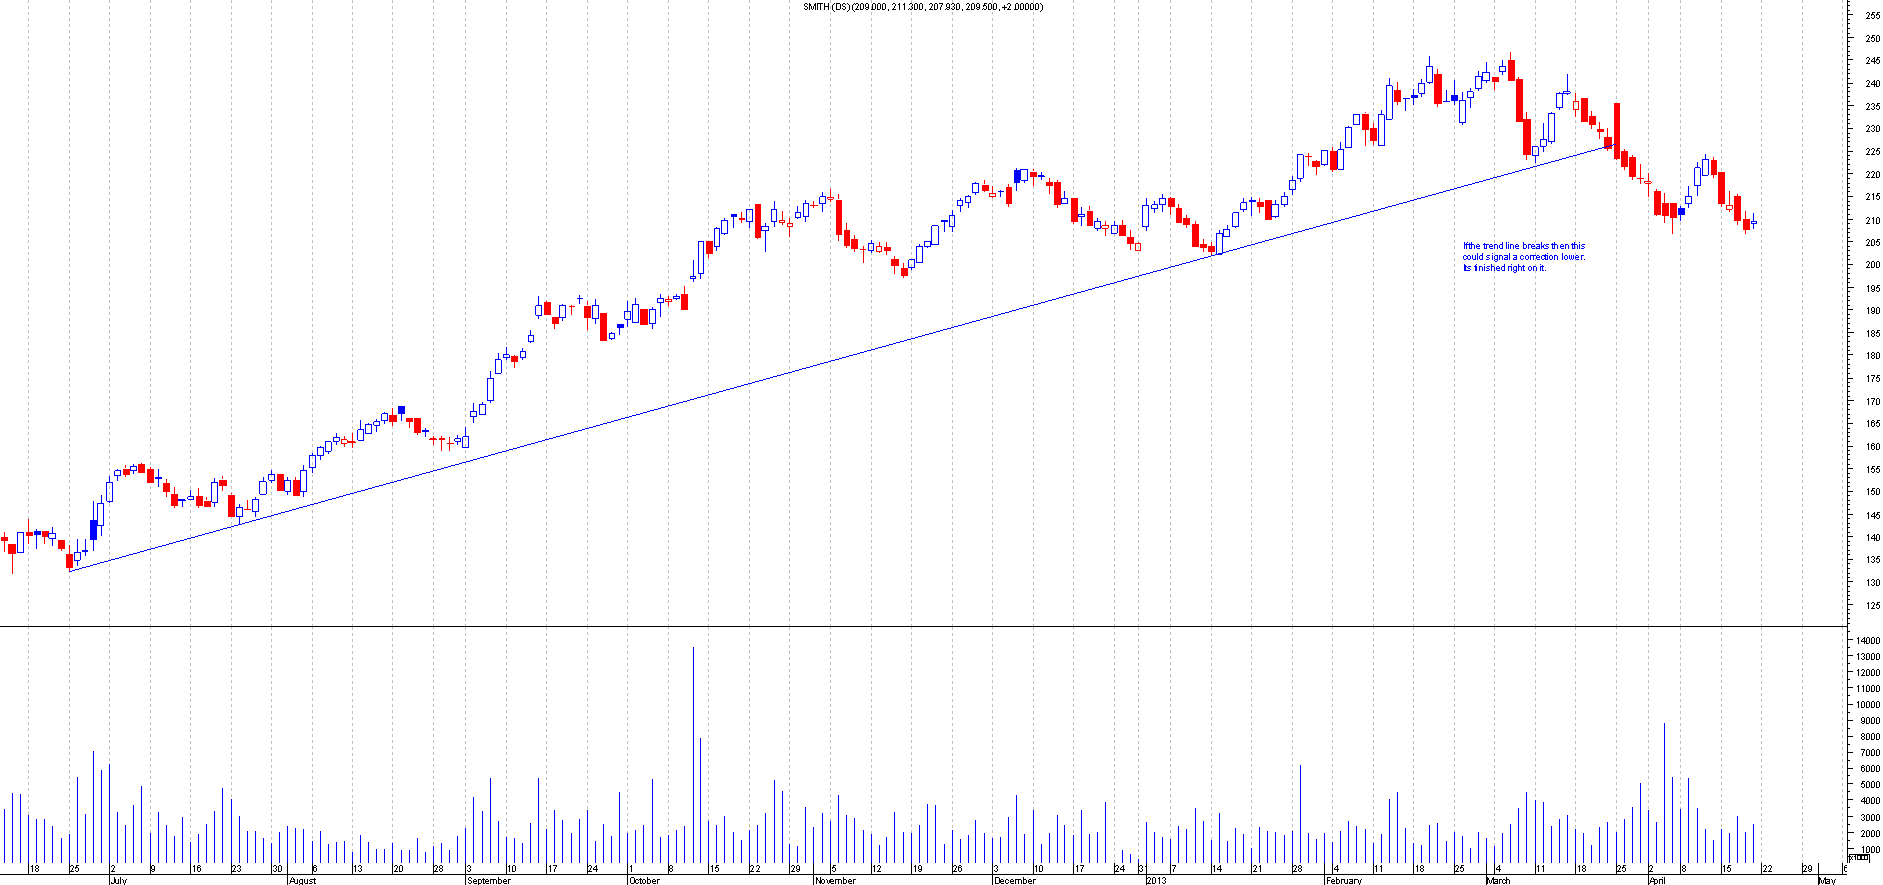
BEFORE: This is the chart of Smith when I mentioned this:
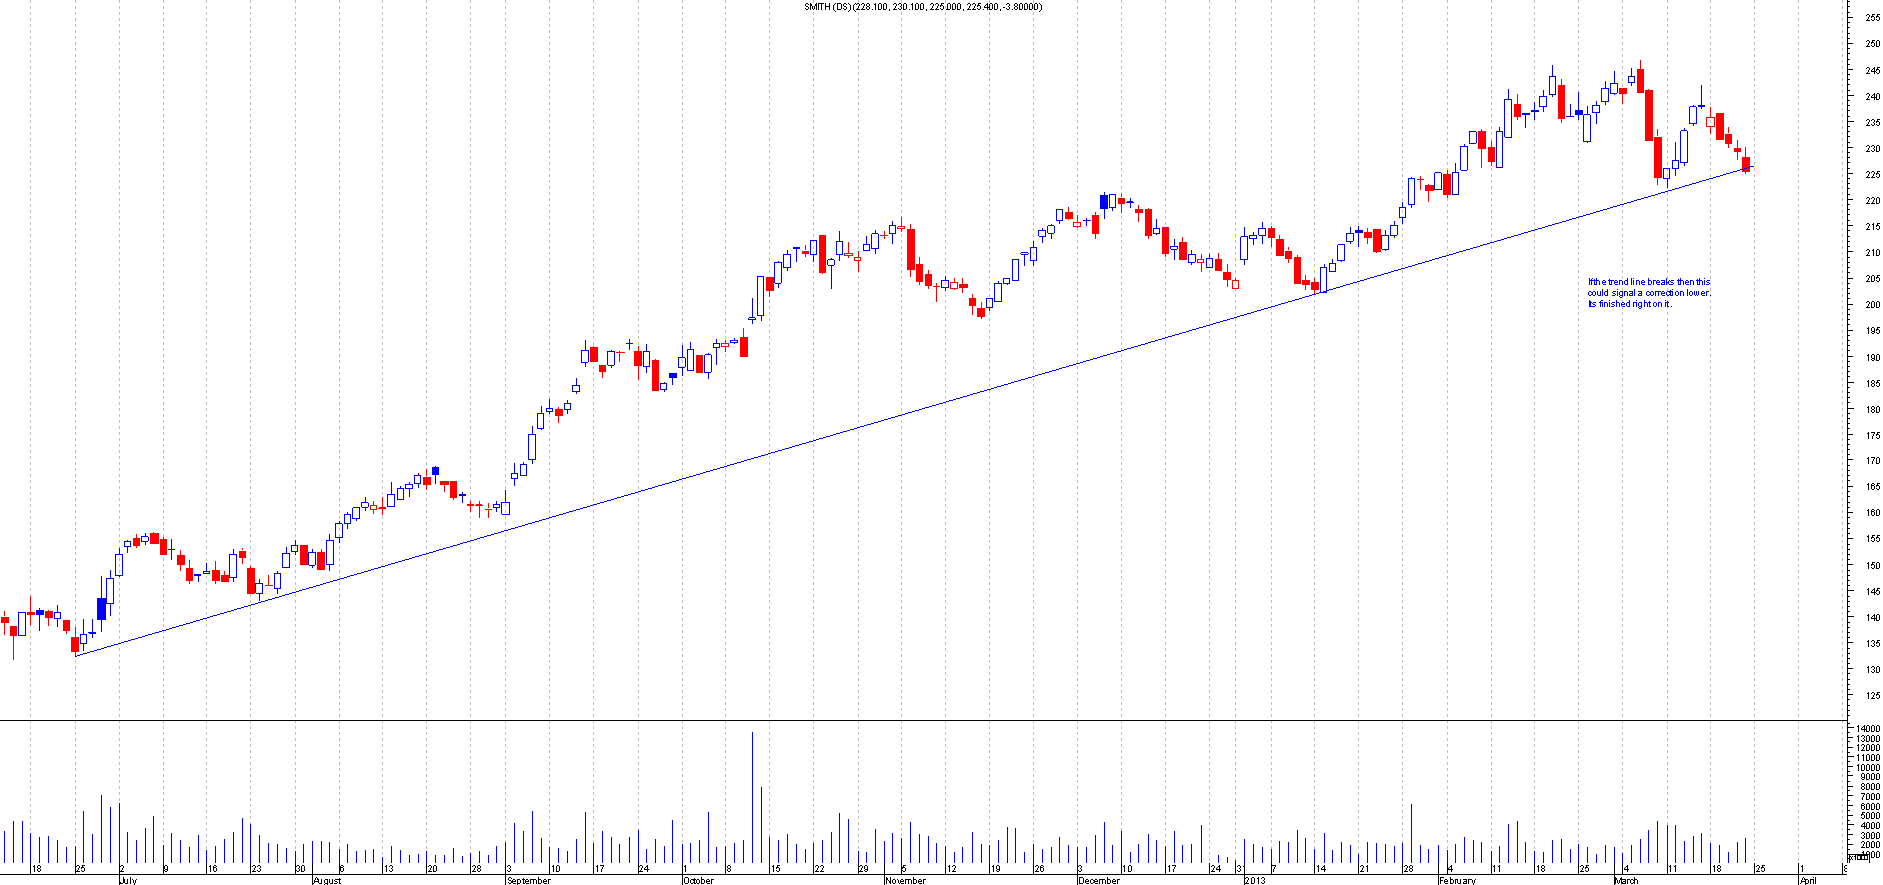
AFTER: This broke out nicely and is still creating lower highs, this is where it is today:
1st April 2013
BALF.L
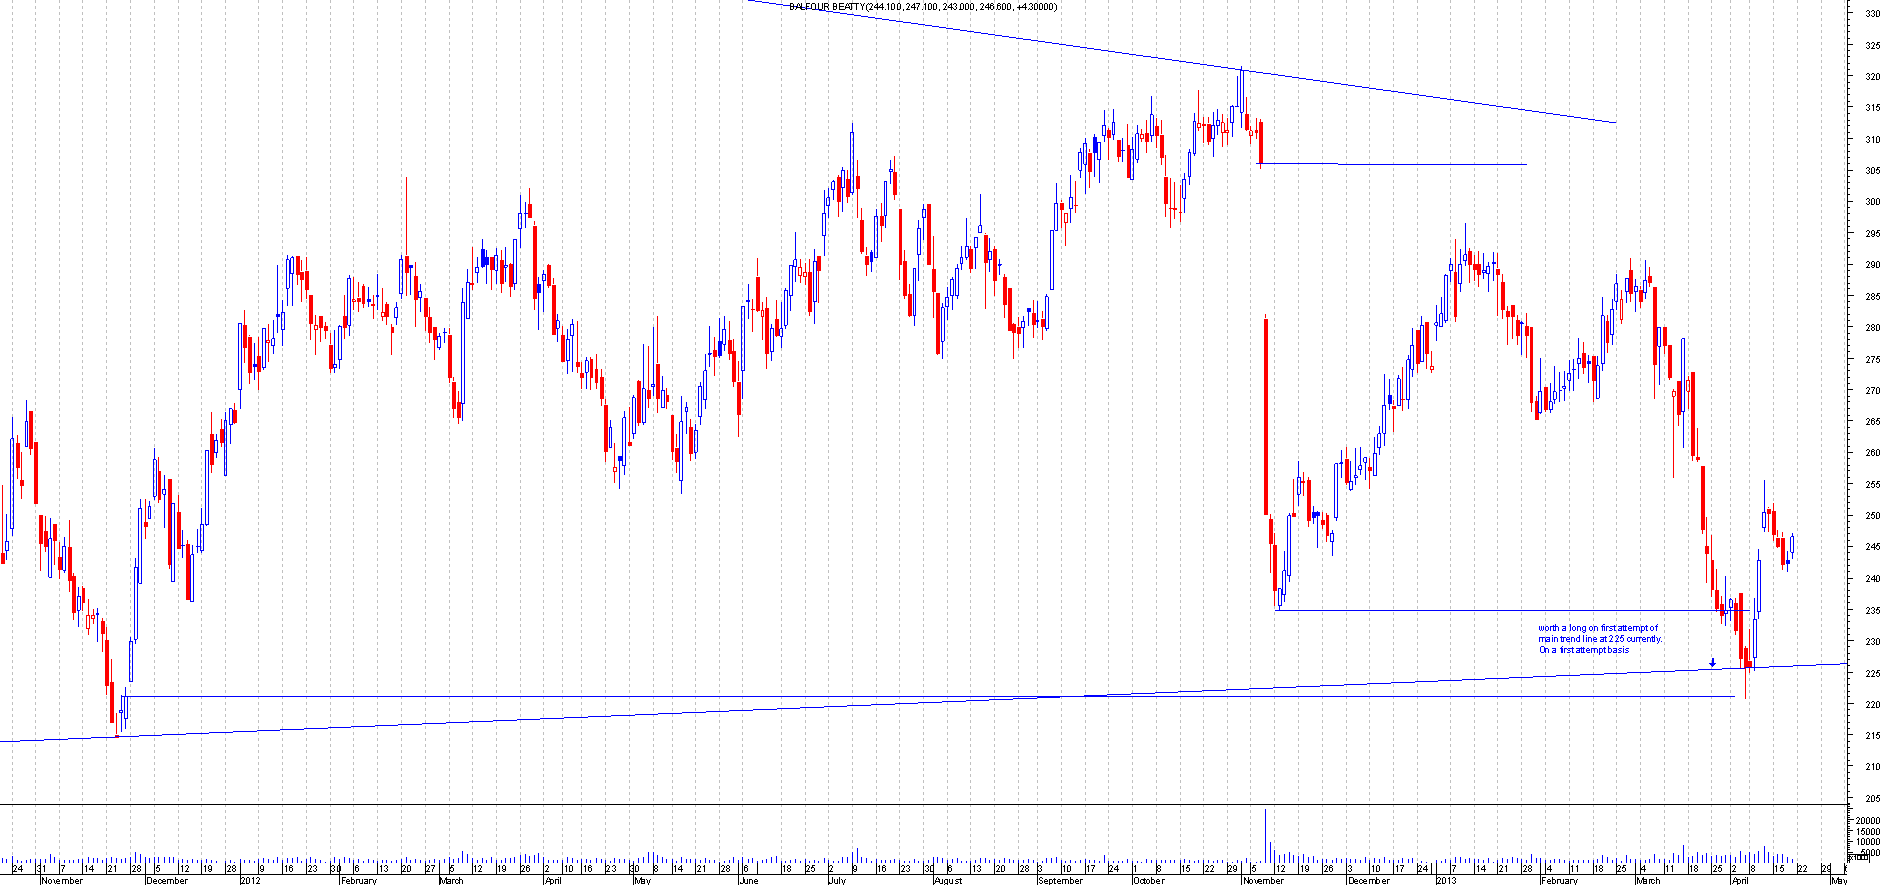
BEFORE: This is the chart of Balfour Beatty when I mentioned this:
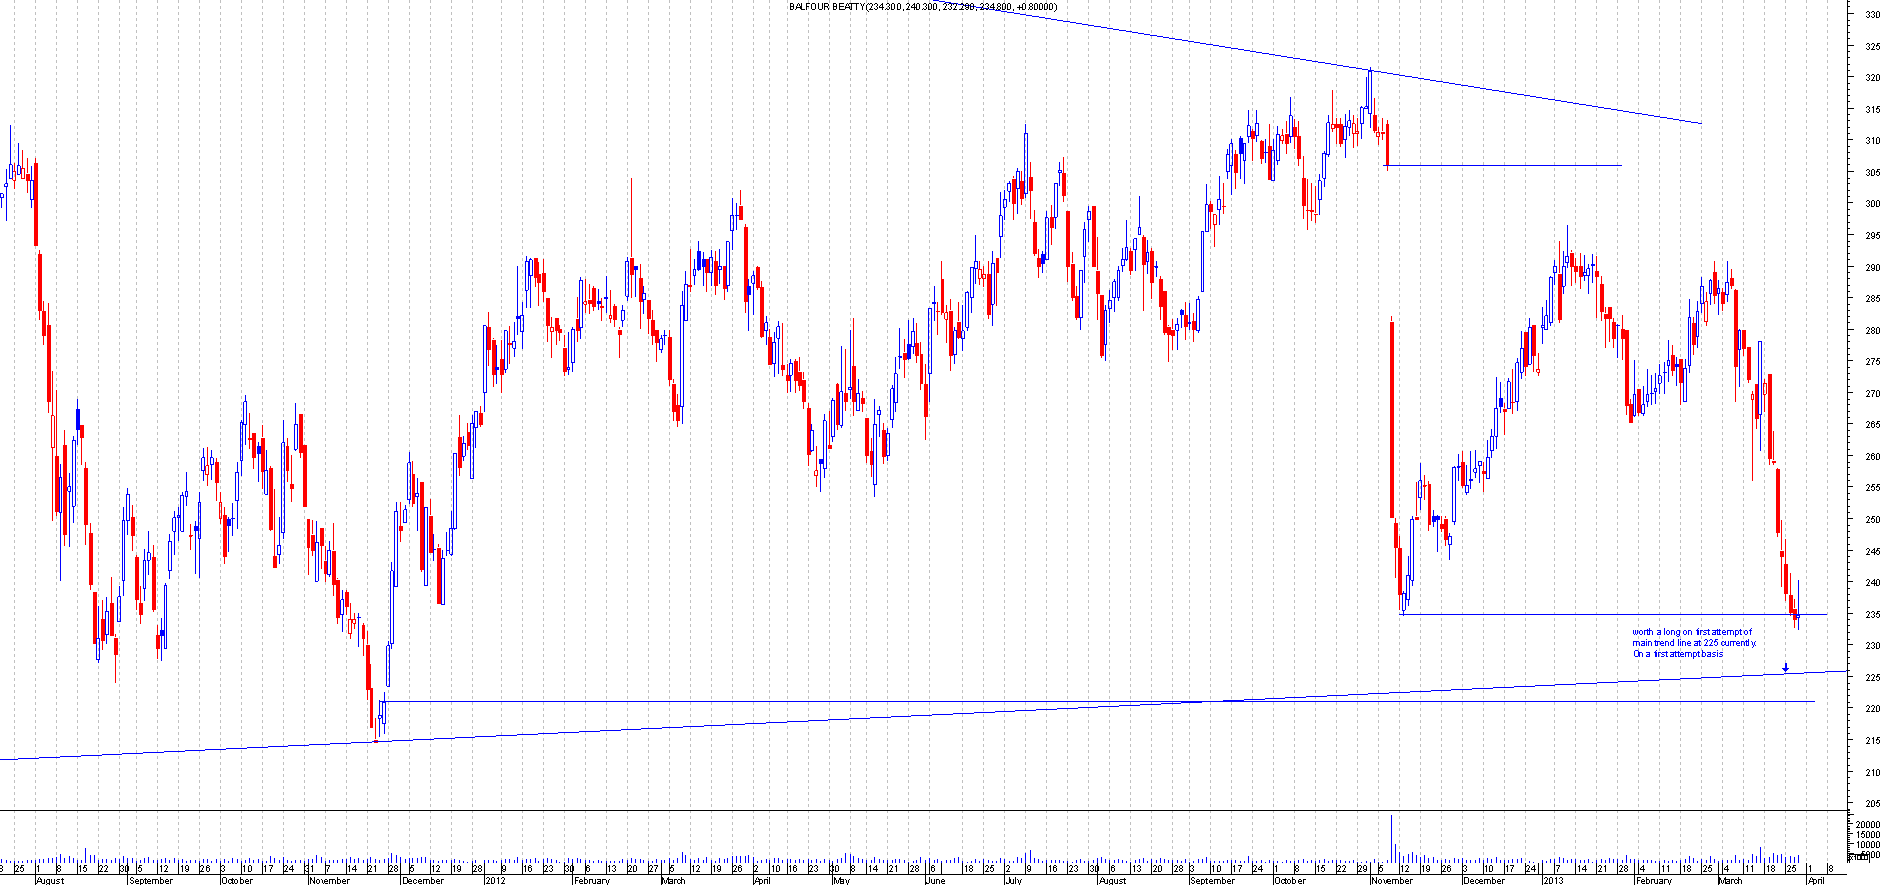
AFTER: This bounced almost perfectly form the trend line and had moved 30 points from there. This should be a free trade now, this is where it is today
AZEM.L
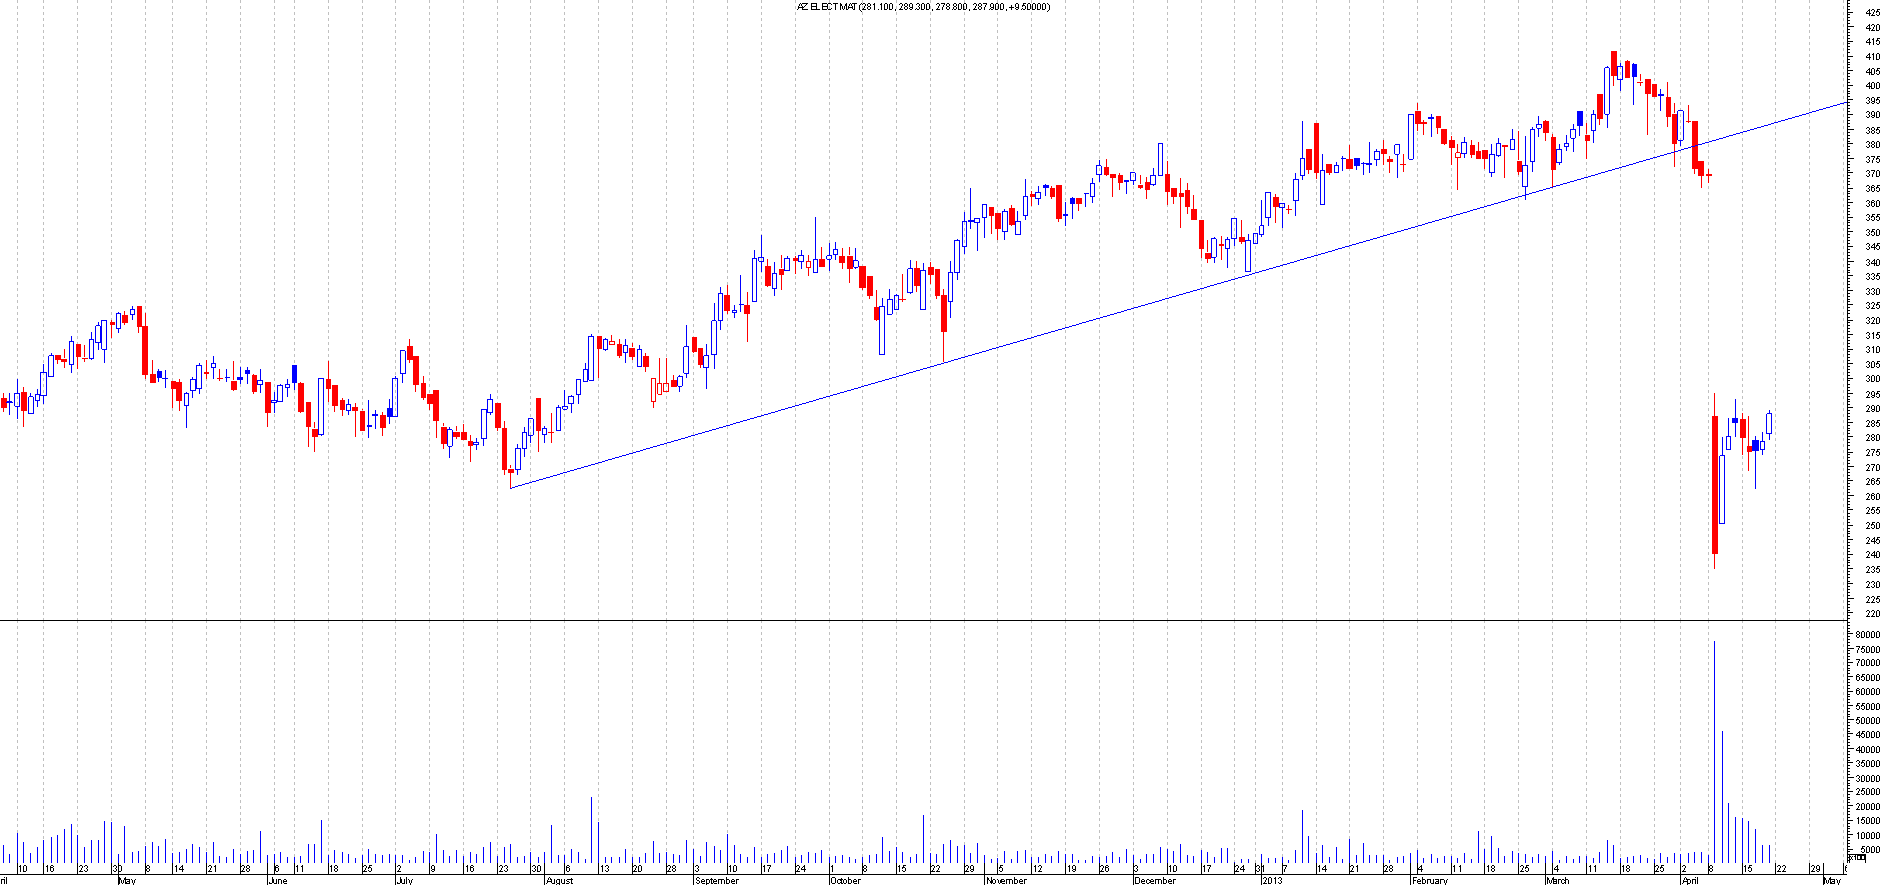
BEFORE: This is AZ Elect Mat when I mentioned this:
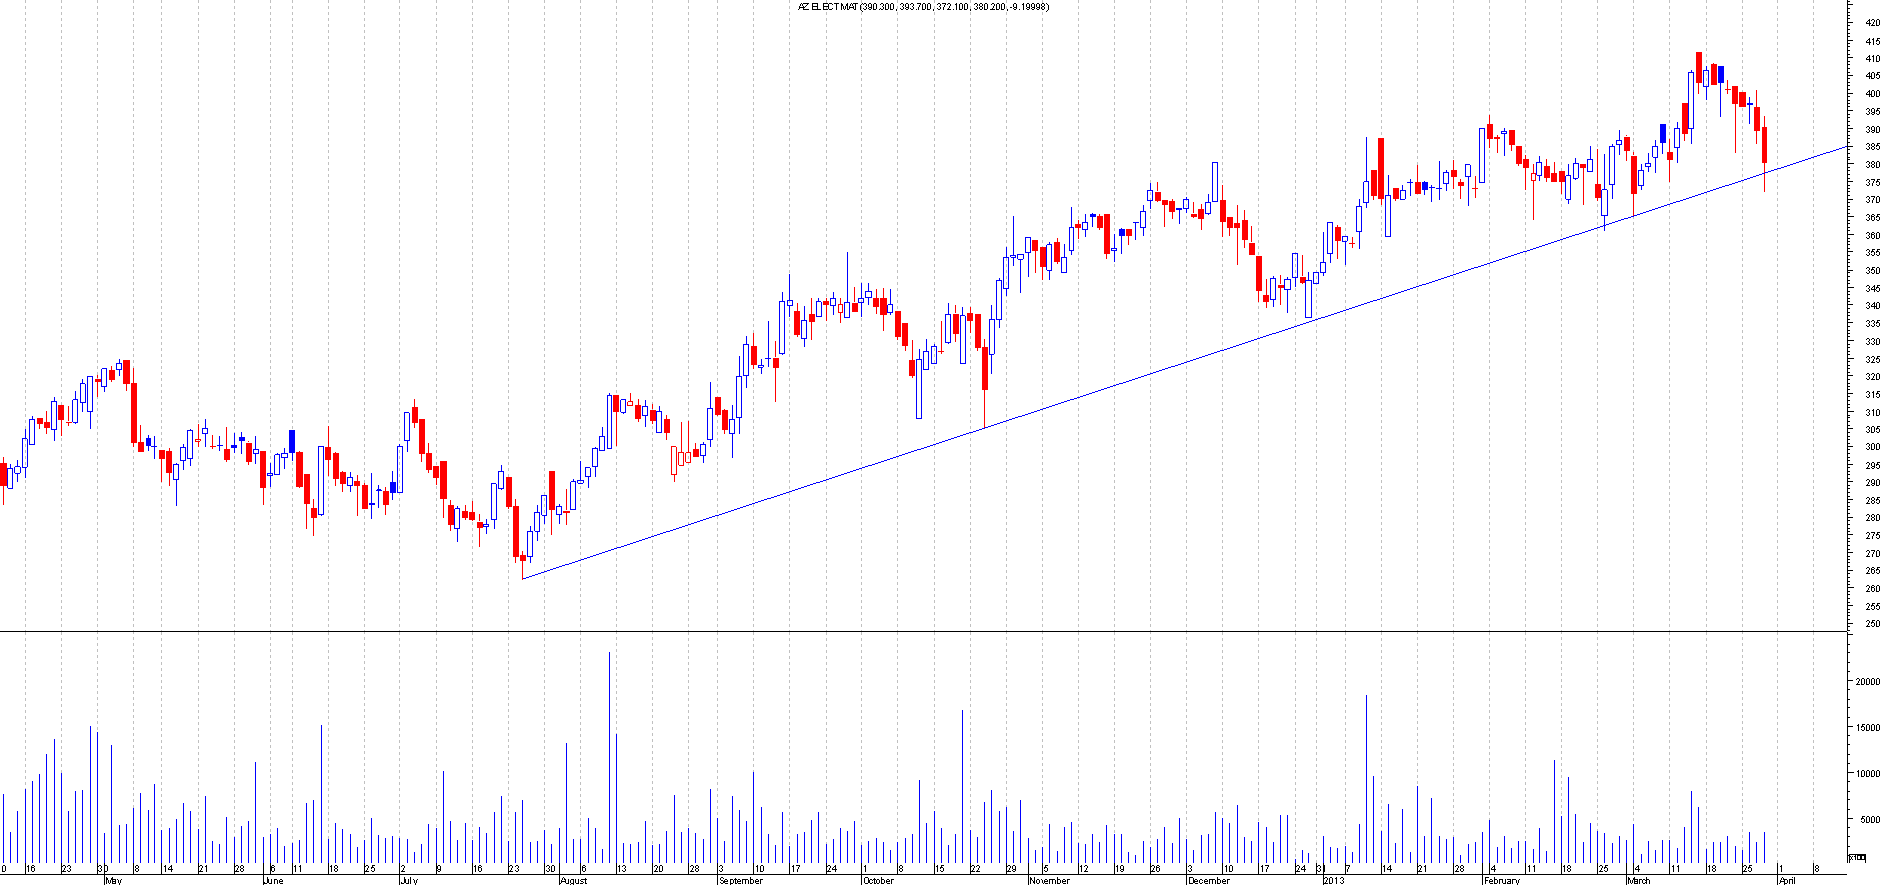
AFTER: This shows the power of the trend line. This broke out powerfully and moved more that 30% 140 points away from the trend line. This is now in a down trend clearly, this is where it is now
8th April 2013
DTY.L
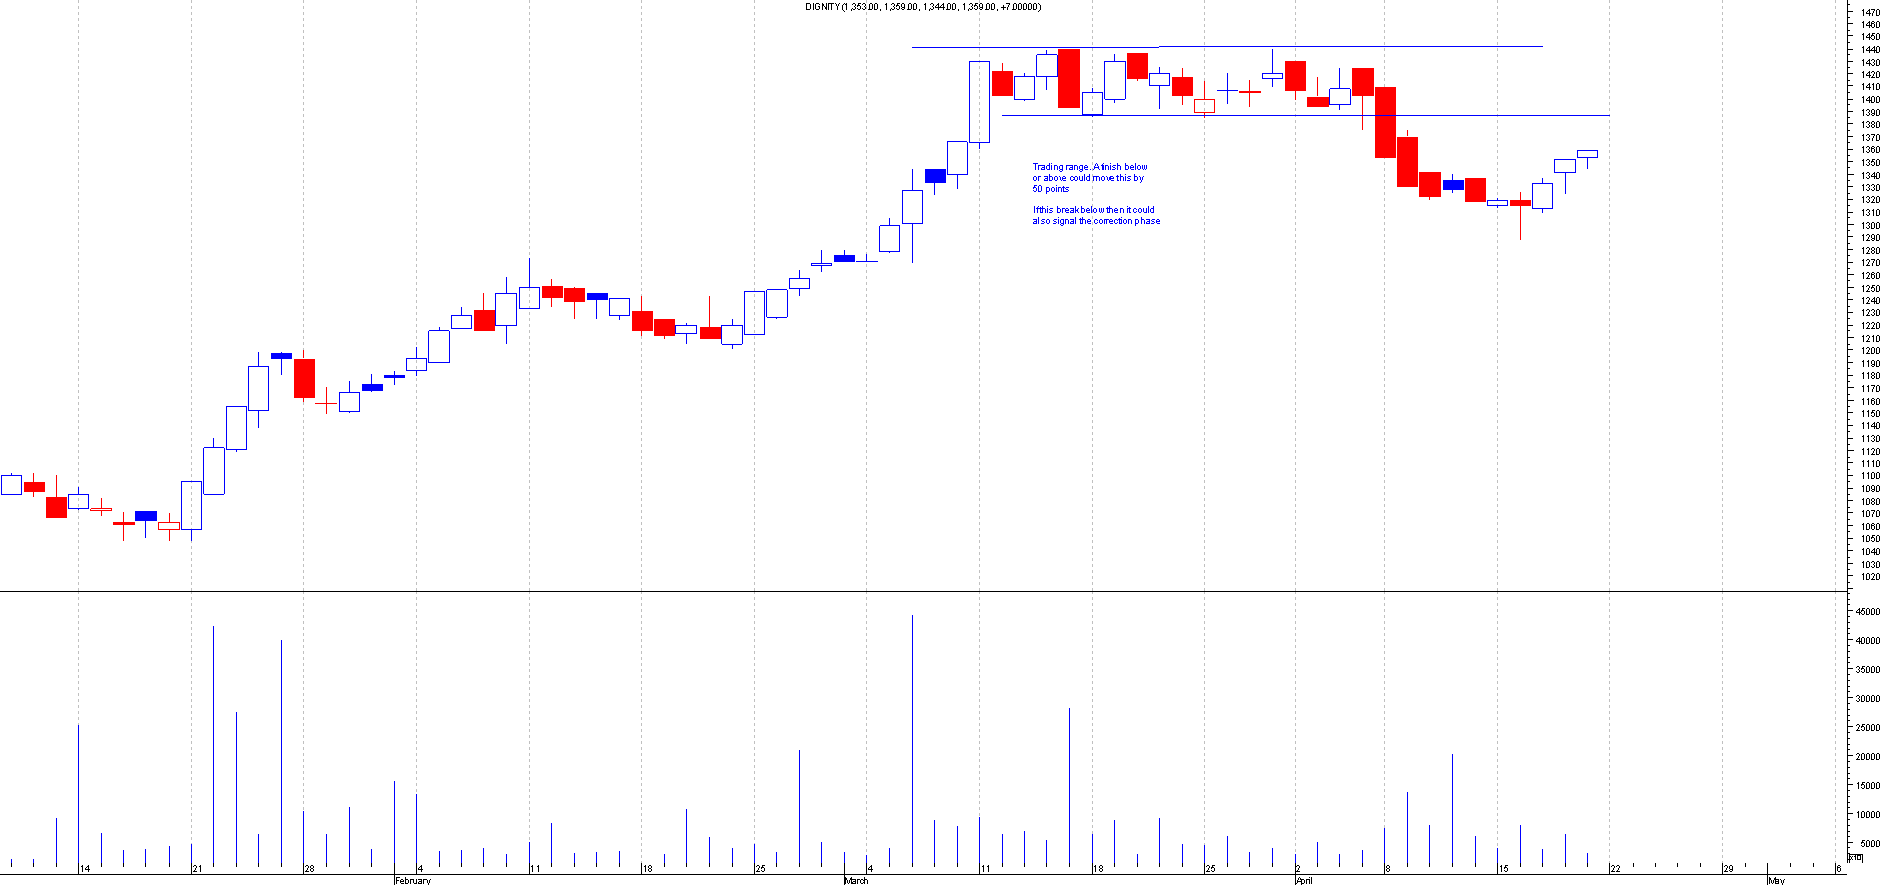
BEFORE: This is a chart of dignity when I first mentioned this:
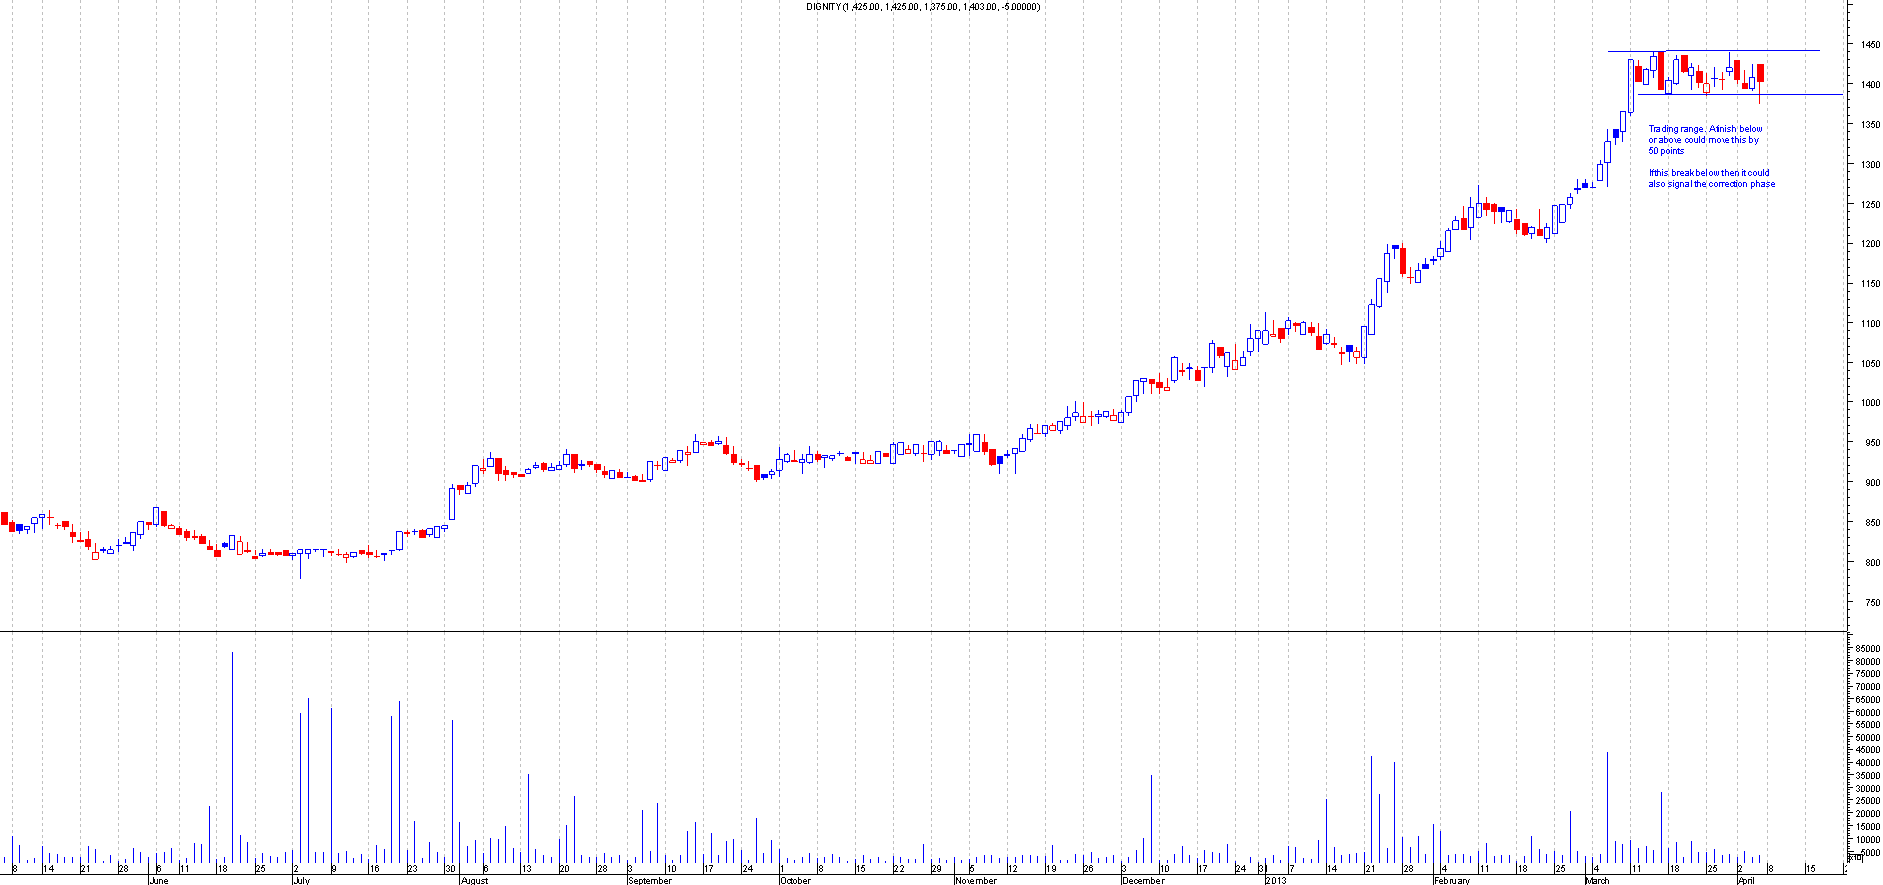
AFTER: This hit the trading range target perfectly. it should be a free trade if your still in this, this is where it is now:
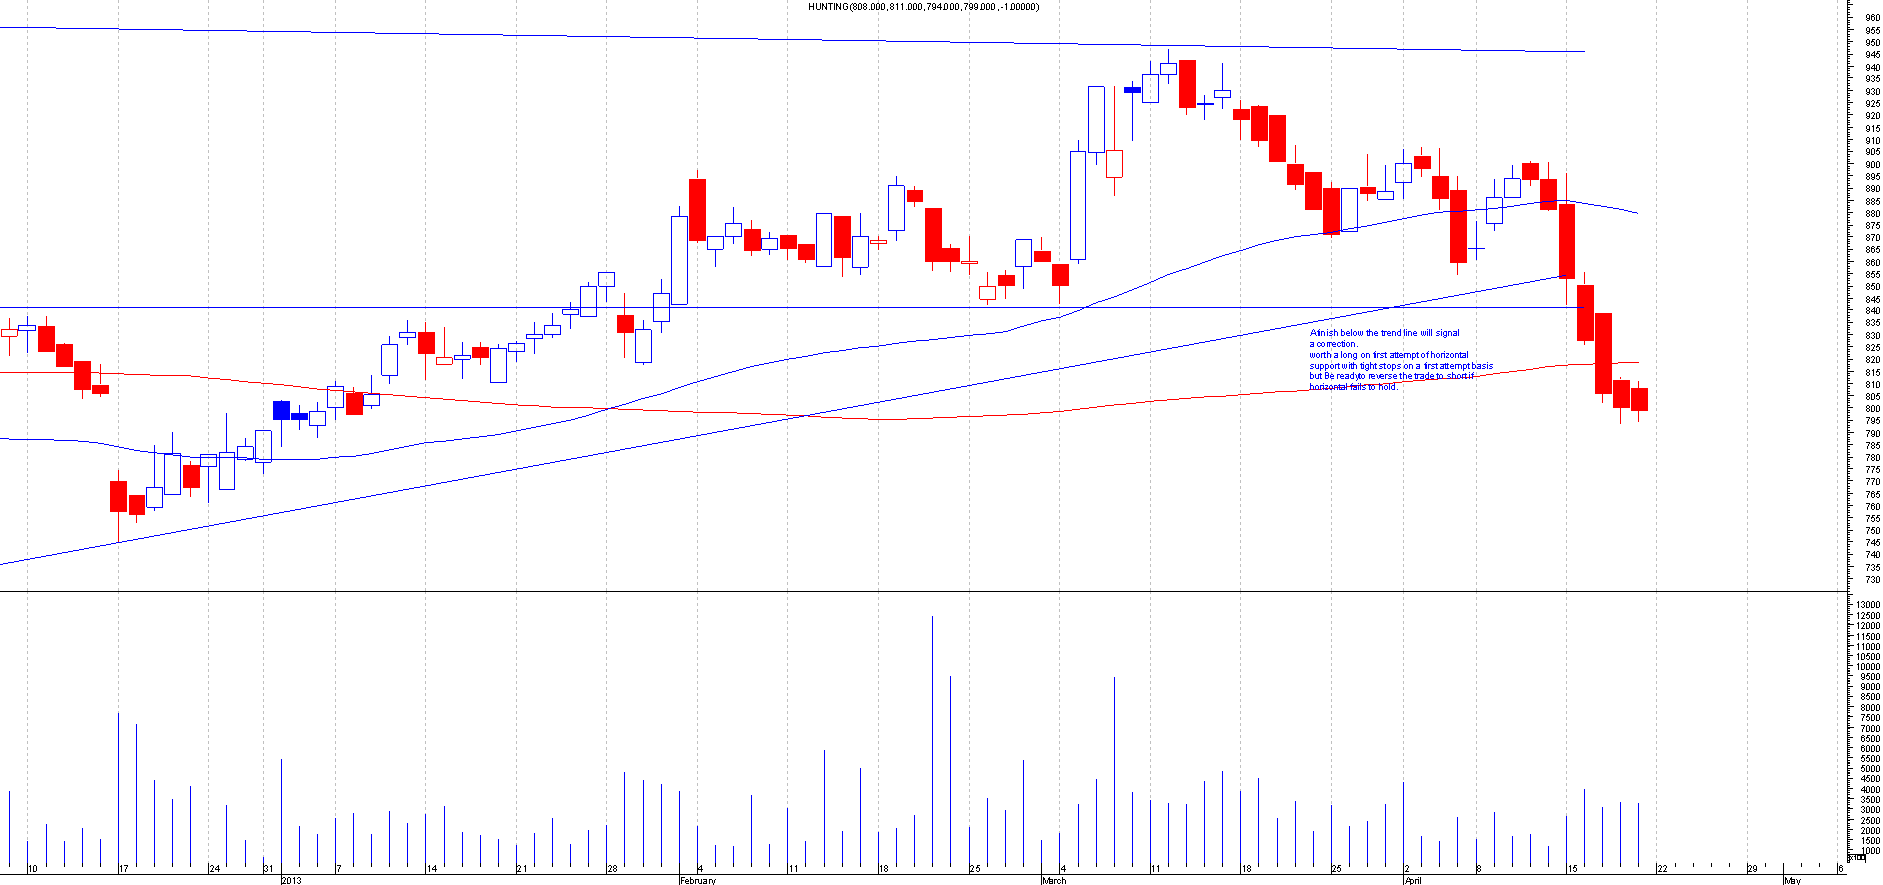
HTG.L
BEFORE: This is the chart of Hunting when I first mentioned this:
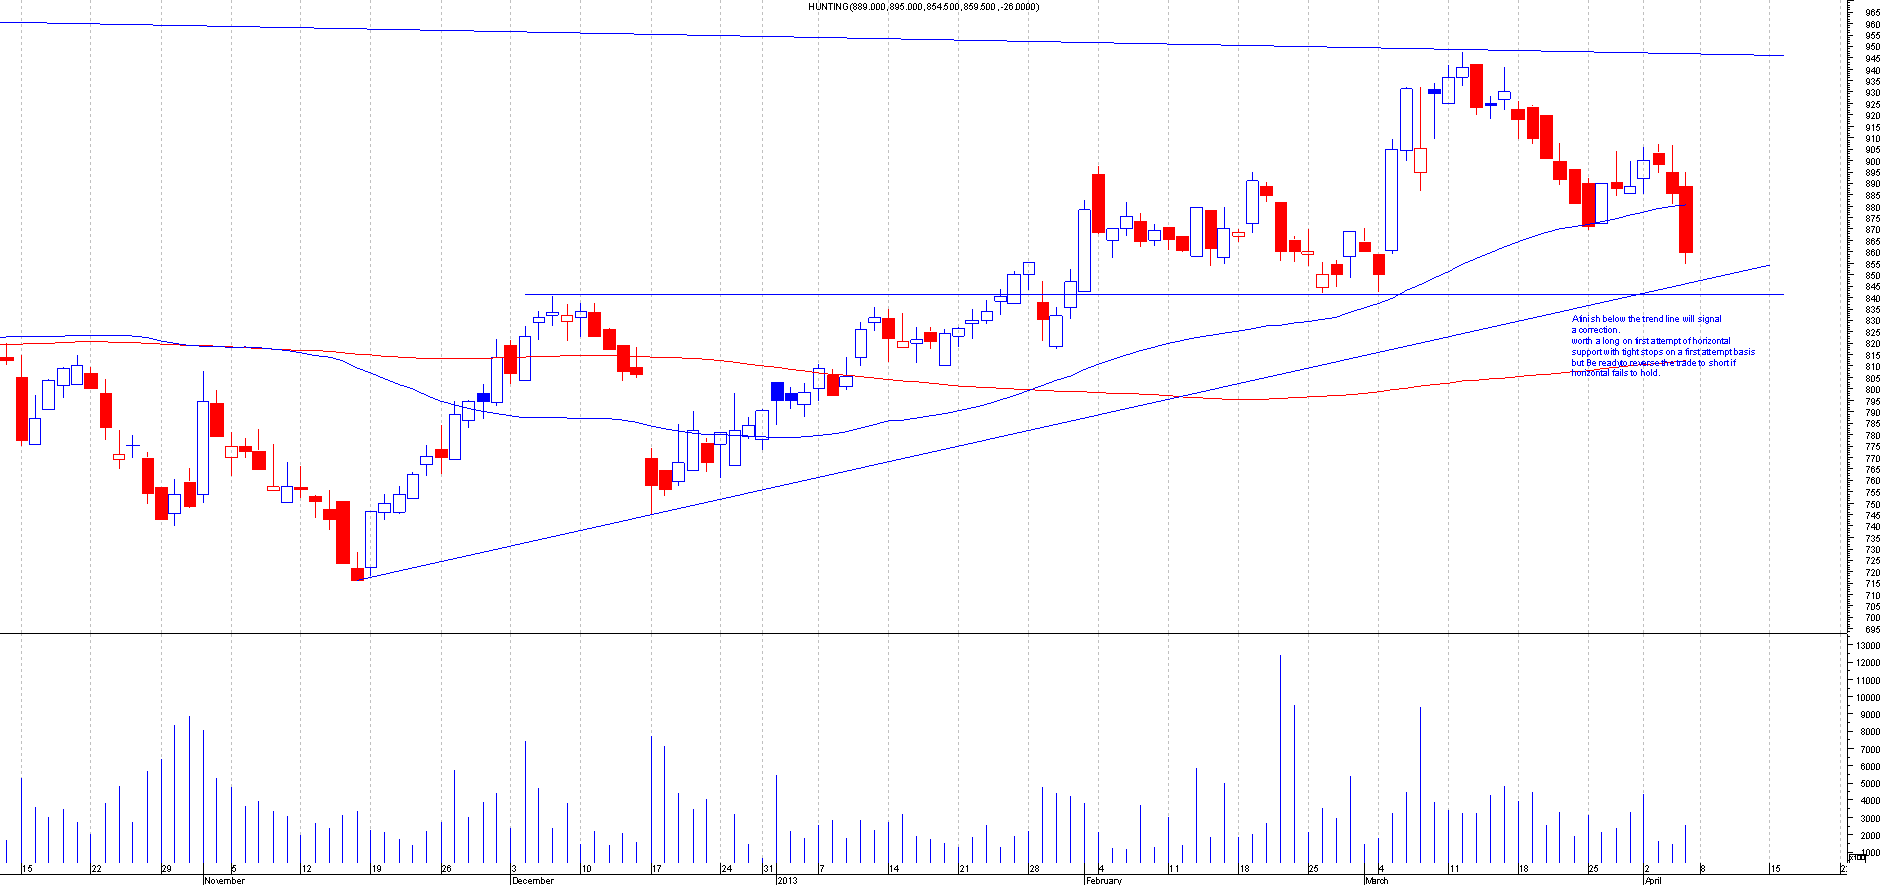
AFTER: This has moved nicely away from the trend line by 60 points so this should be a free trade now. This is correcting nicely, this is where it is now:
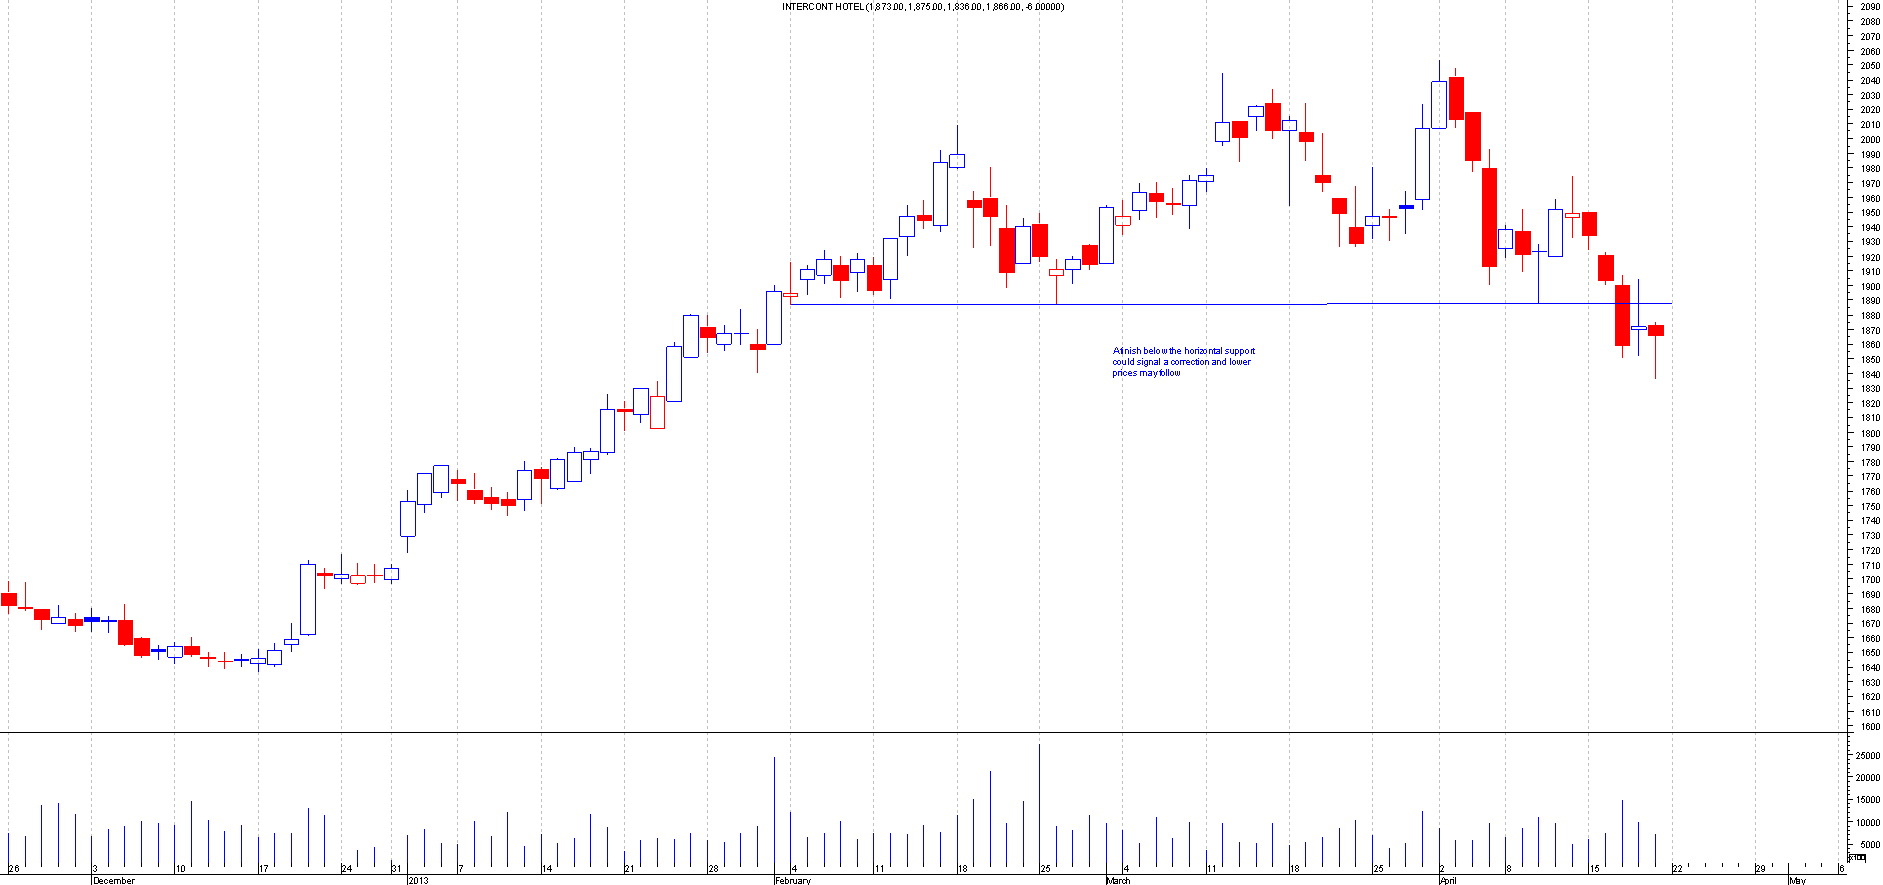
IHG.L
BEFORE: This is the chart of Intercont Hotel when I first mentioned this:
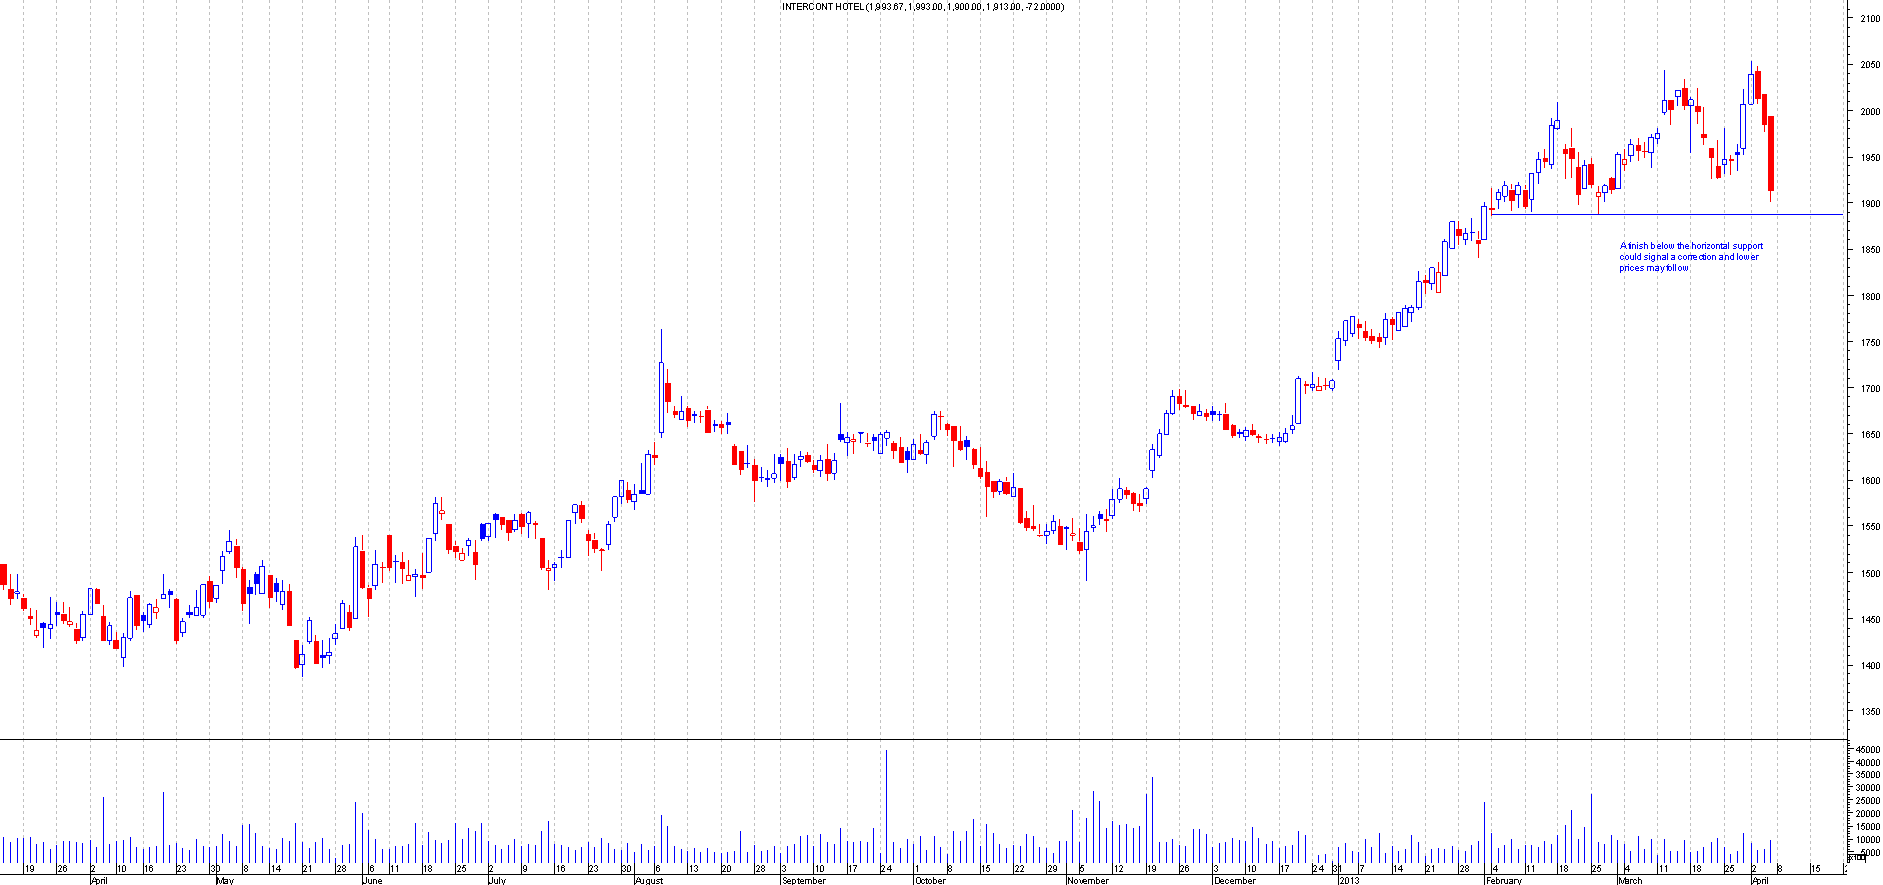
AFTER: This moved 50 points away from the breakout point and now seems to have a hammer formation. If this goes above 1904 then maybe false breakout. This should be a free trade now, this is where it is now:
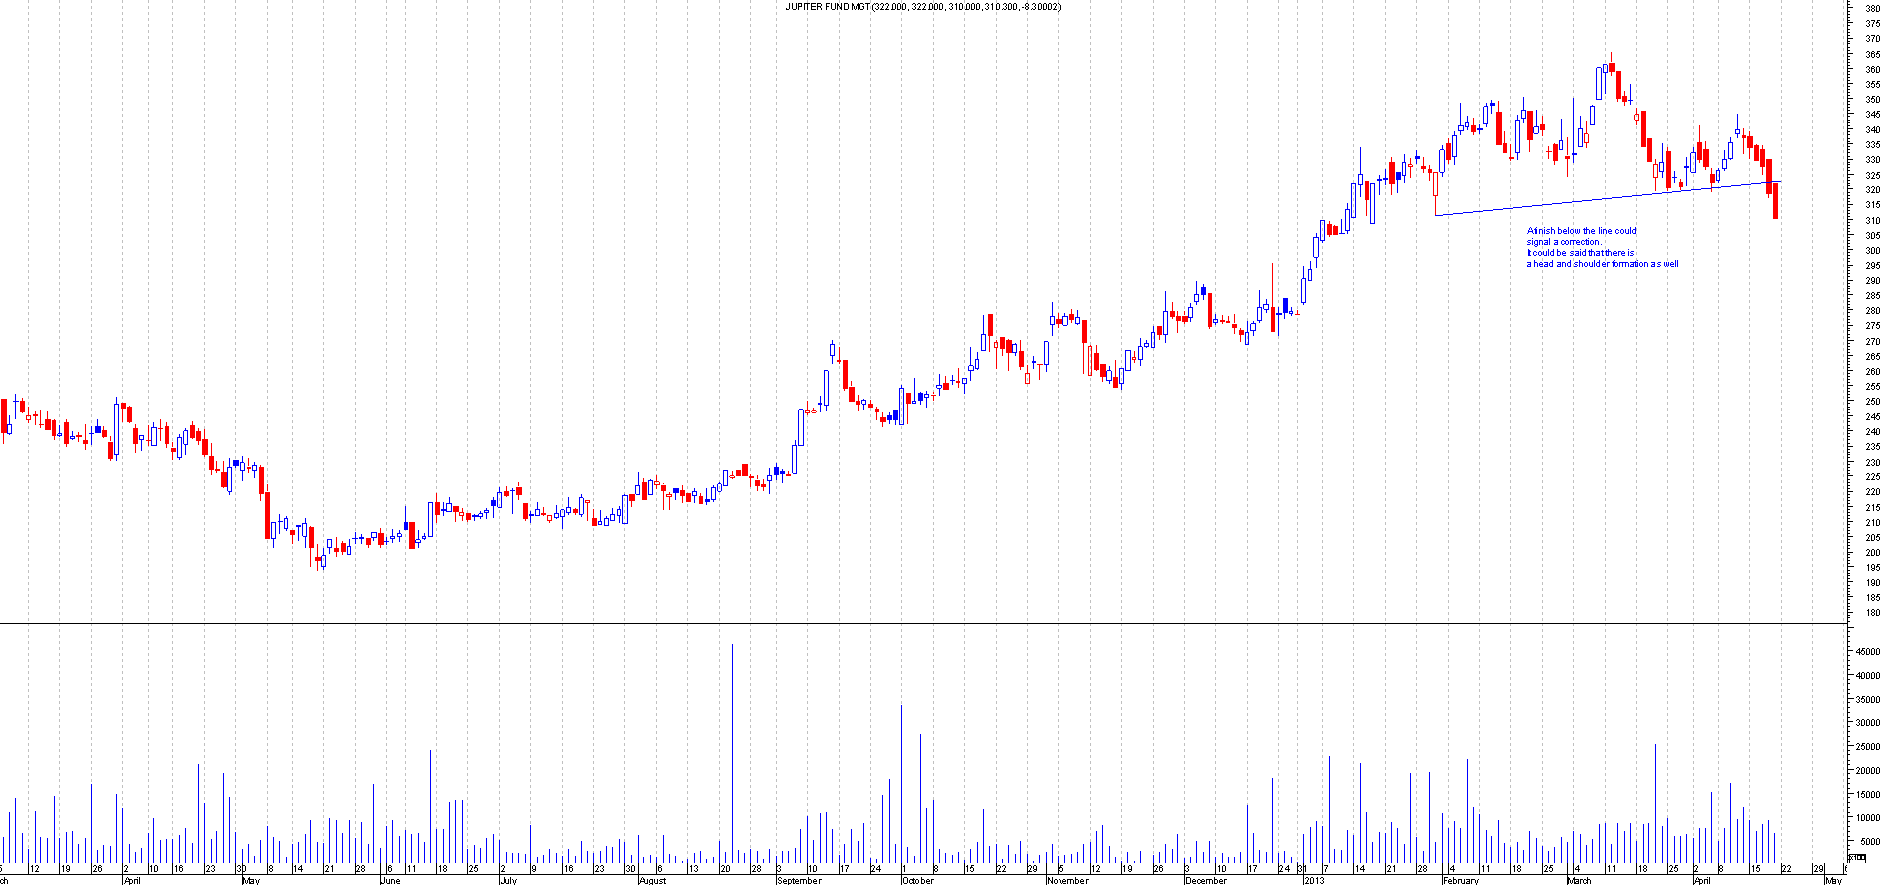
JUP.L
BEFORE: This is the chart of Jupiter fund when I first mentioned this:
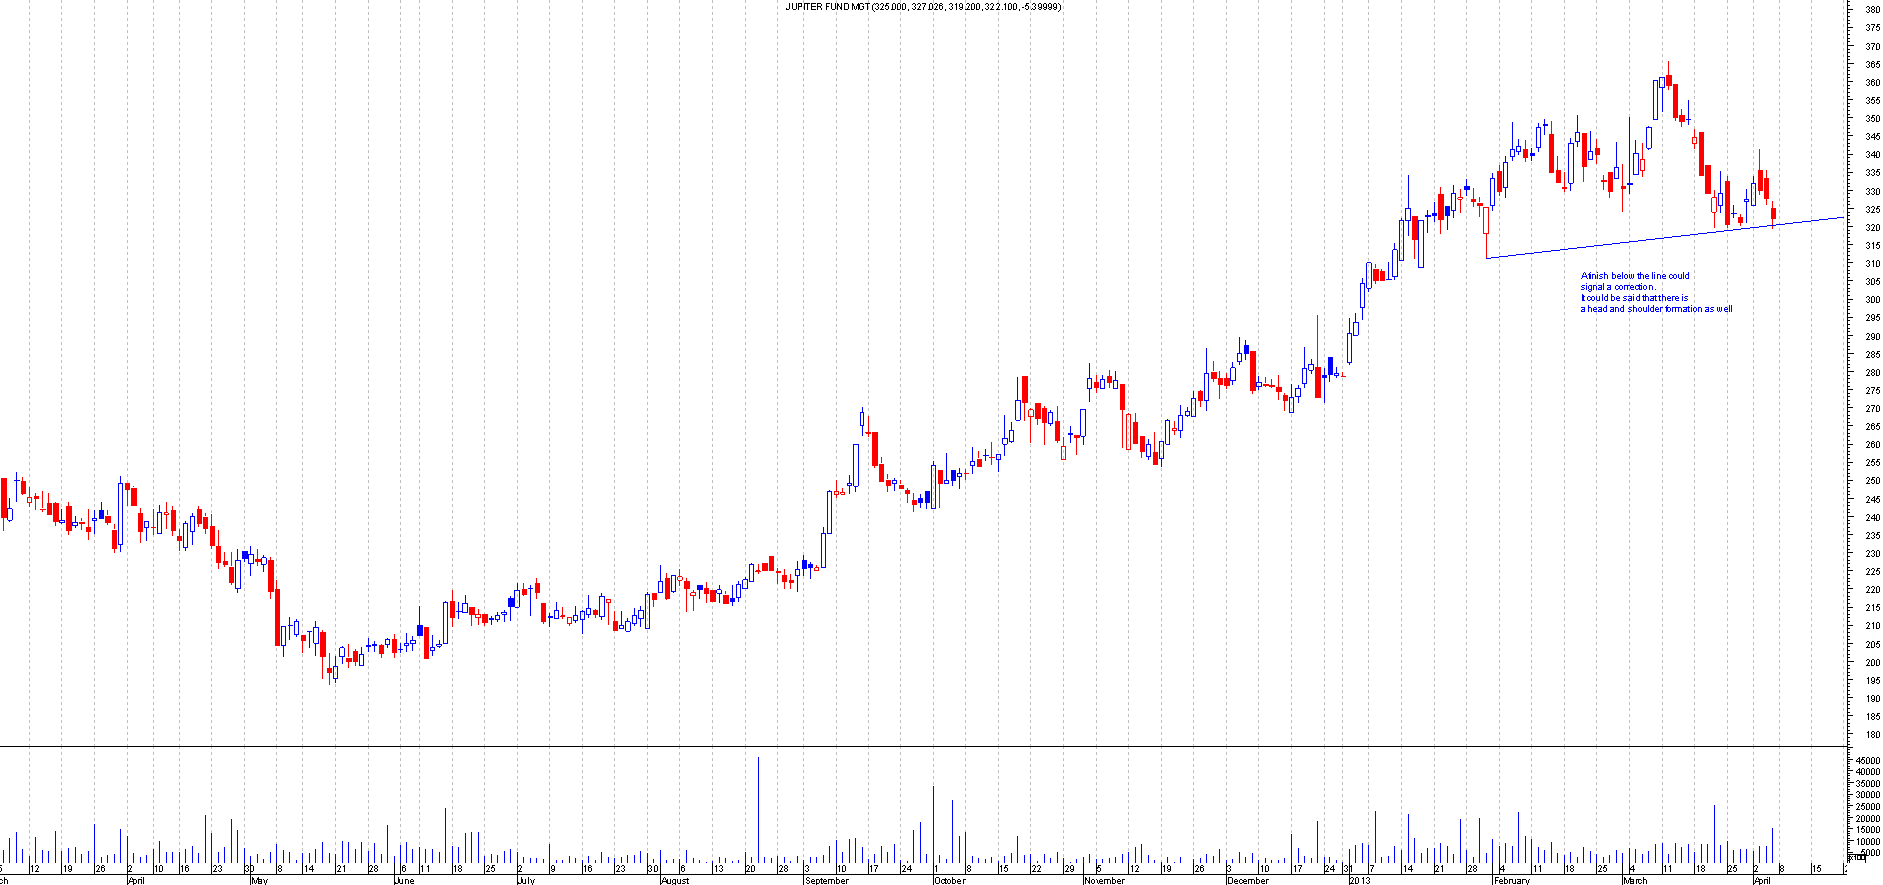
AFTER: This broke out nicely a few days back. This did not back test the break out so there maybe a opportunity to short on the back test with tight stops. This should be a free trade already thou, this is where it is now:
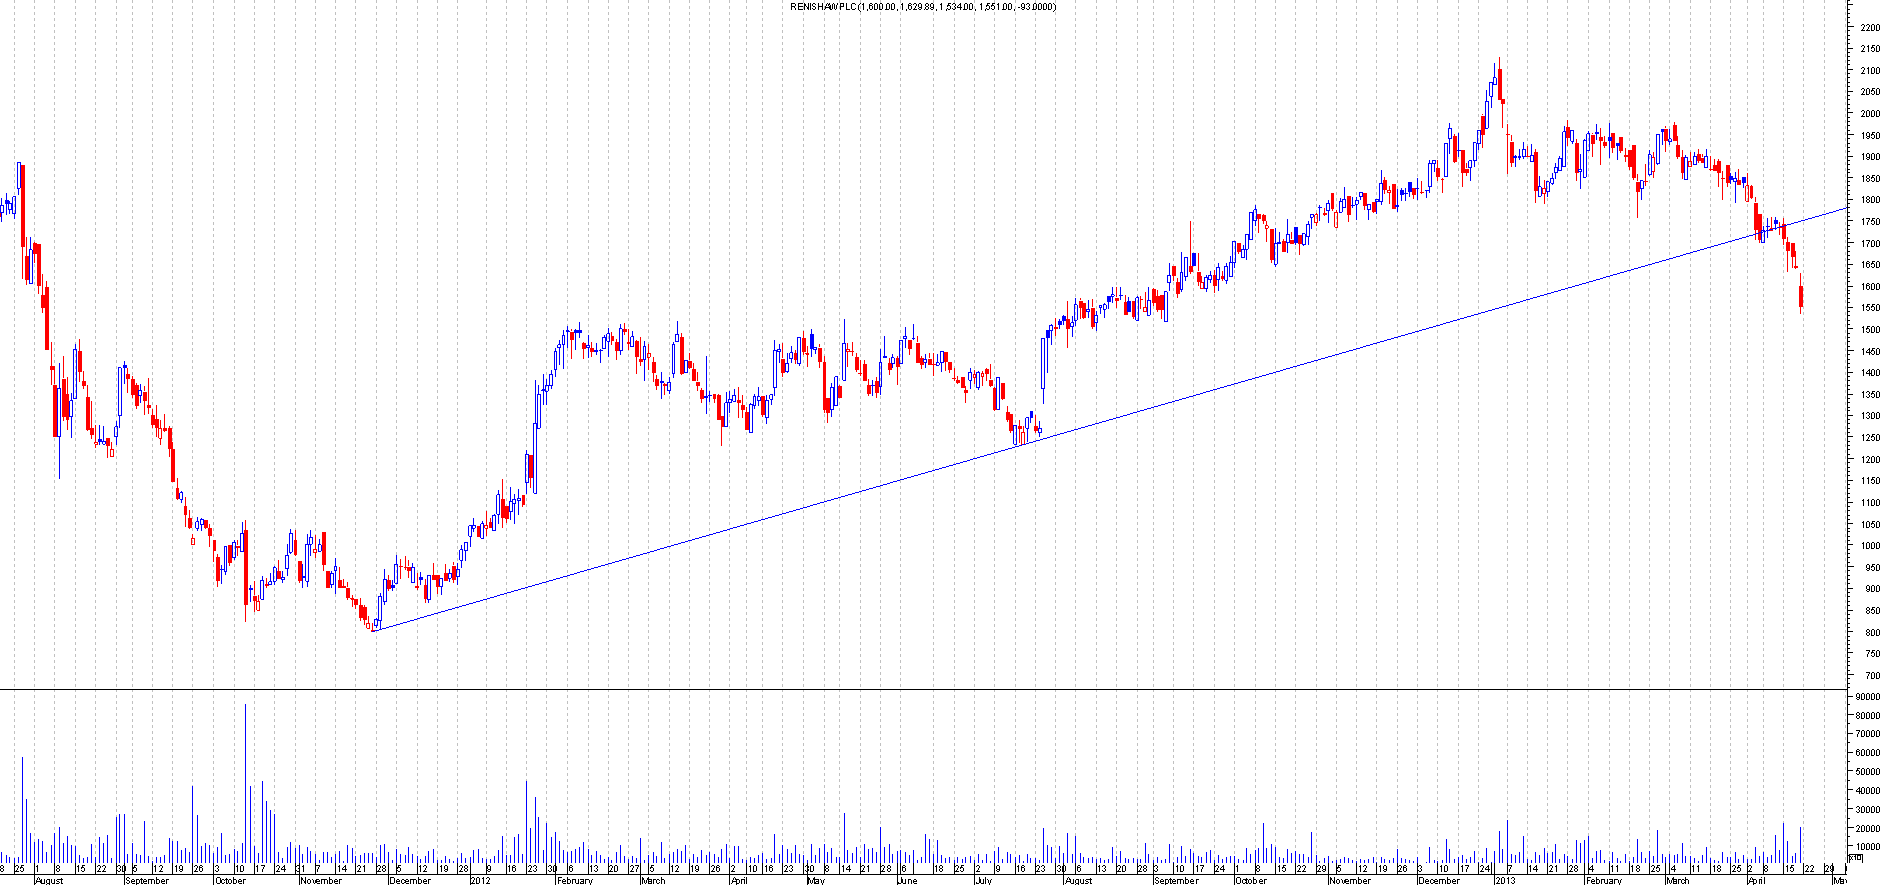
RSW.L
BEFORE: This is the chart of Renishaw when I first mentioned this:
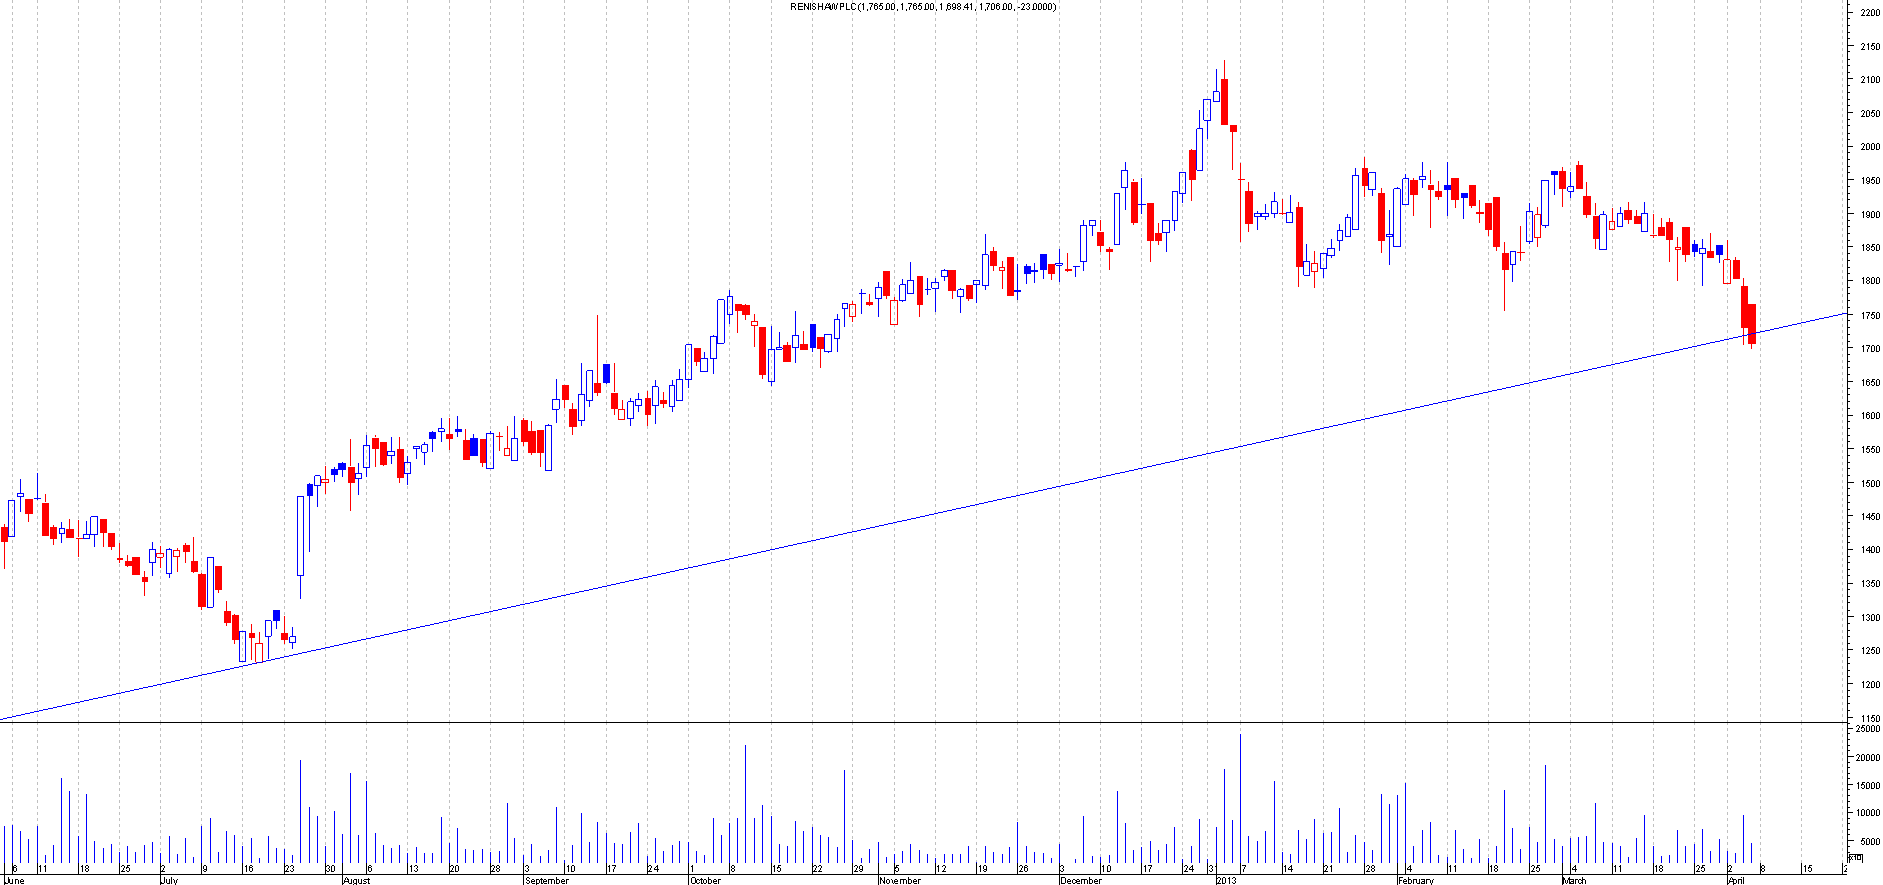
AFTER: This had back tested the breakout and dropped 200 points. Great trade and this now should be a free trade, this is where it is now:
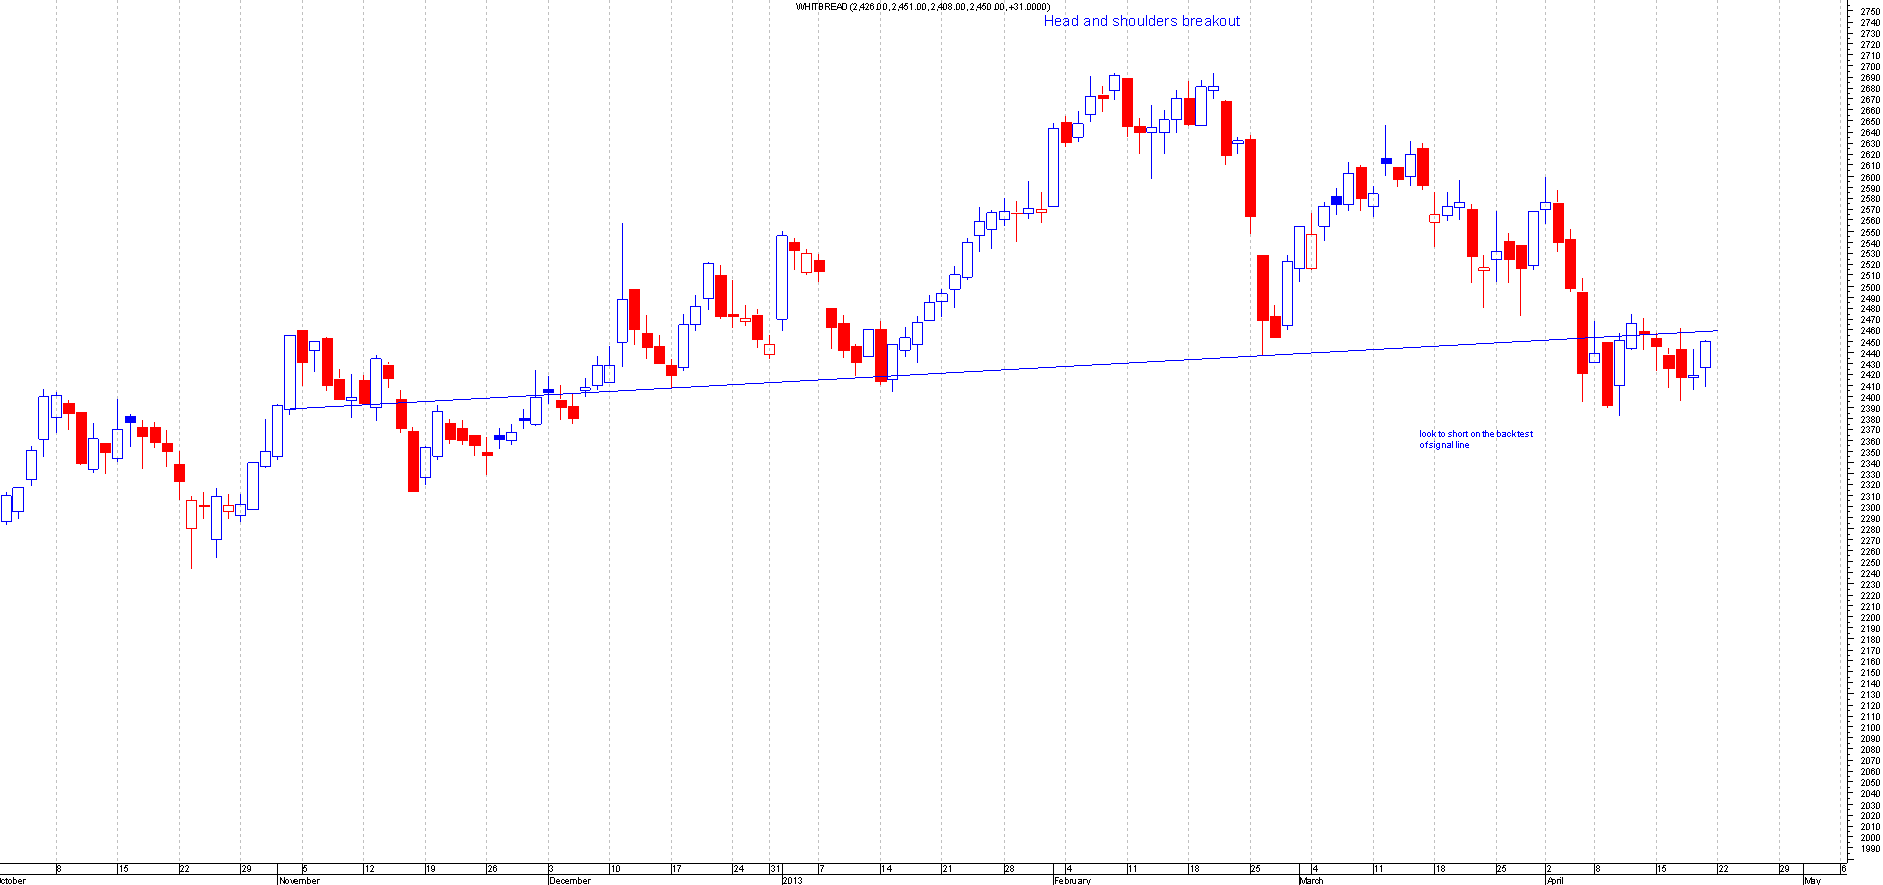
WTB.L
BEFORE: This is the chart of Whitbread when I first mentioned this:
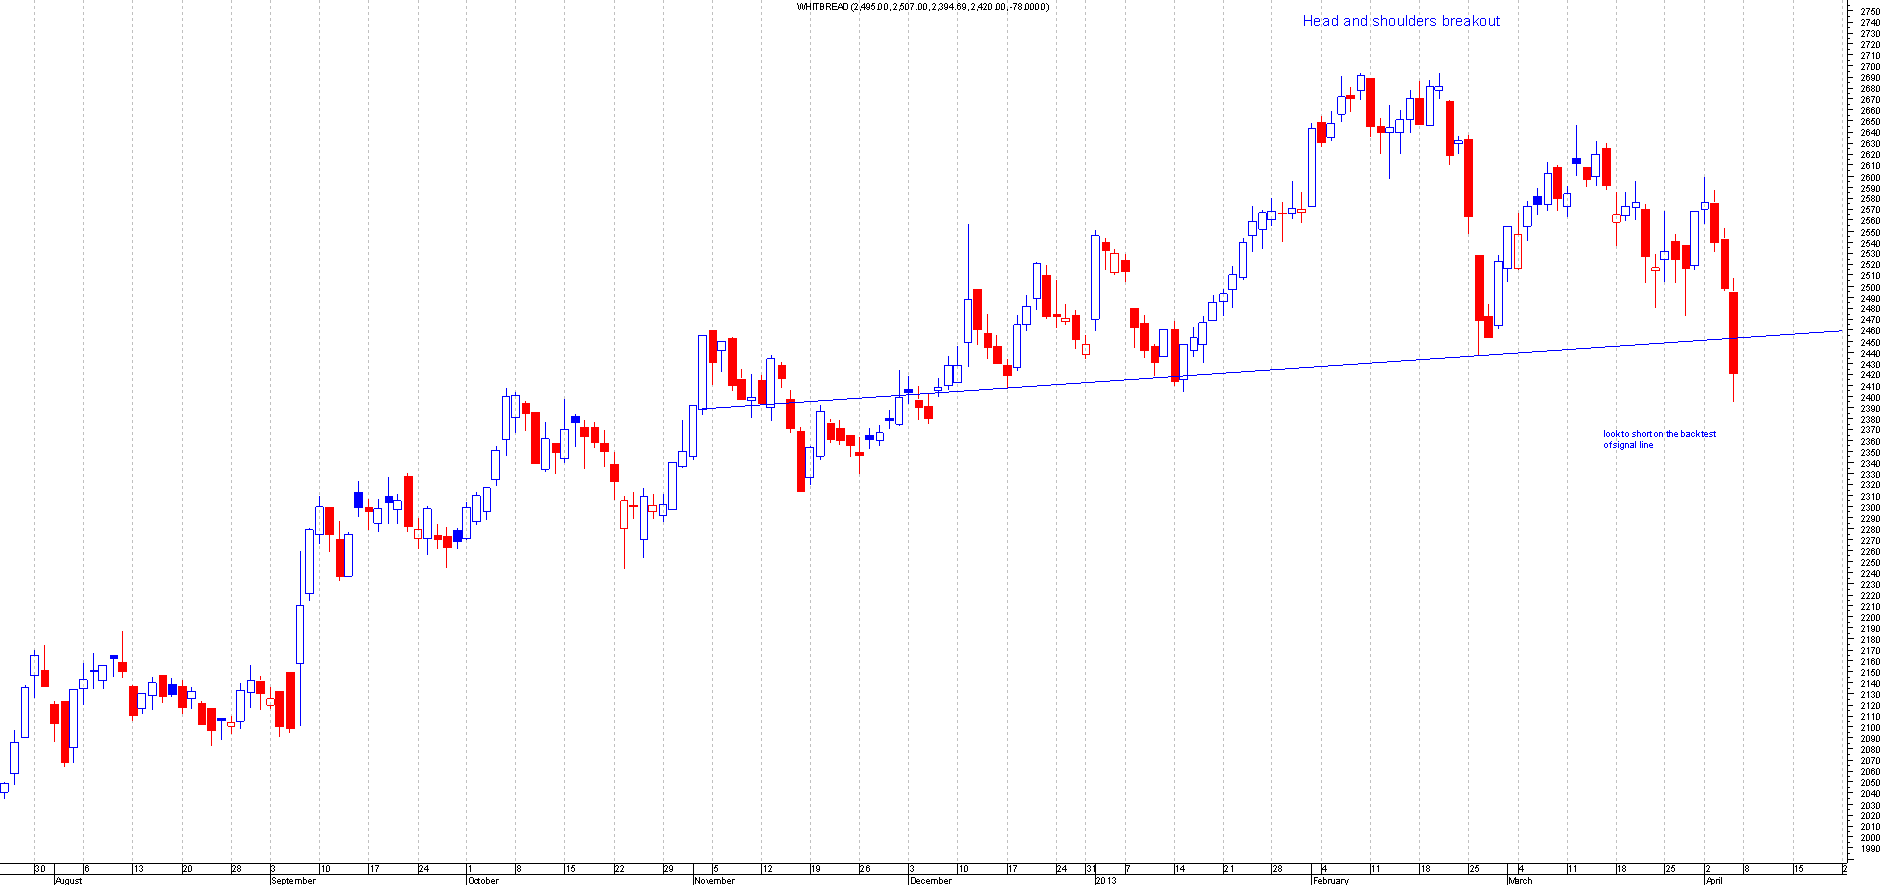
AFTER: This is still fighting the head and shoulders breakout but did move 70 points lower so this should be a free trade as well. This is still in the early days of the trade so if this does move lower then there's a good chance it will move 250 points lower. If this breaks above 2475 then there is a chance this was a false breakout, this is where it is now:
15th April 2013
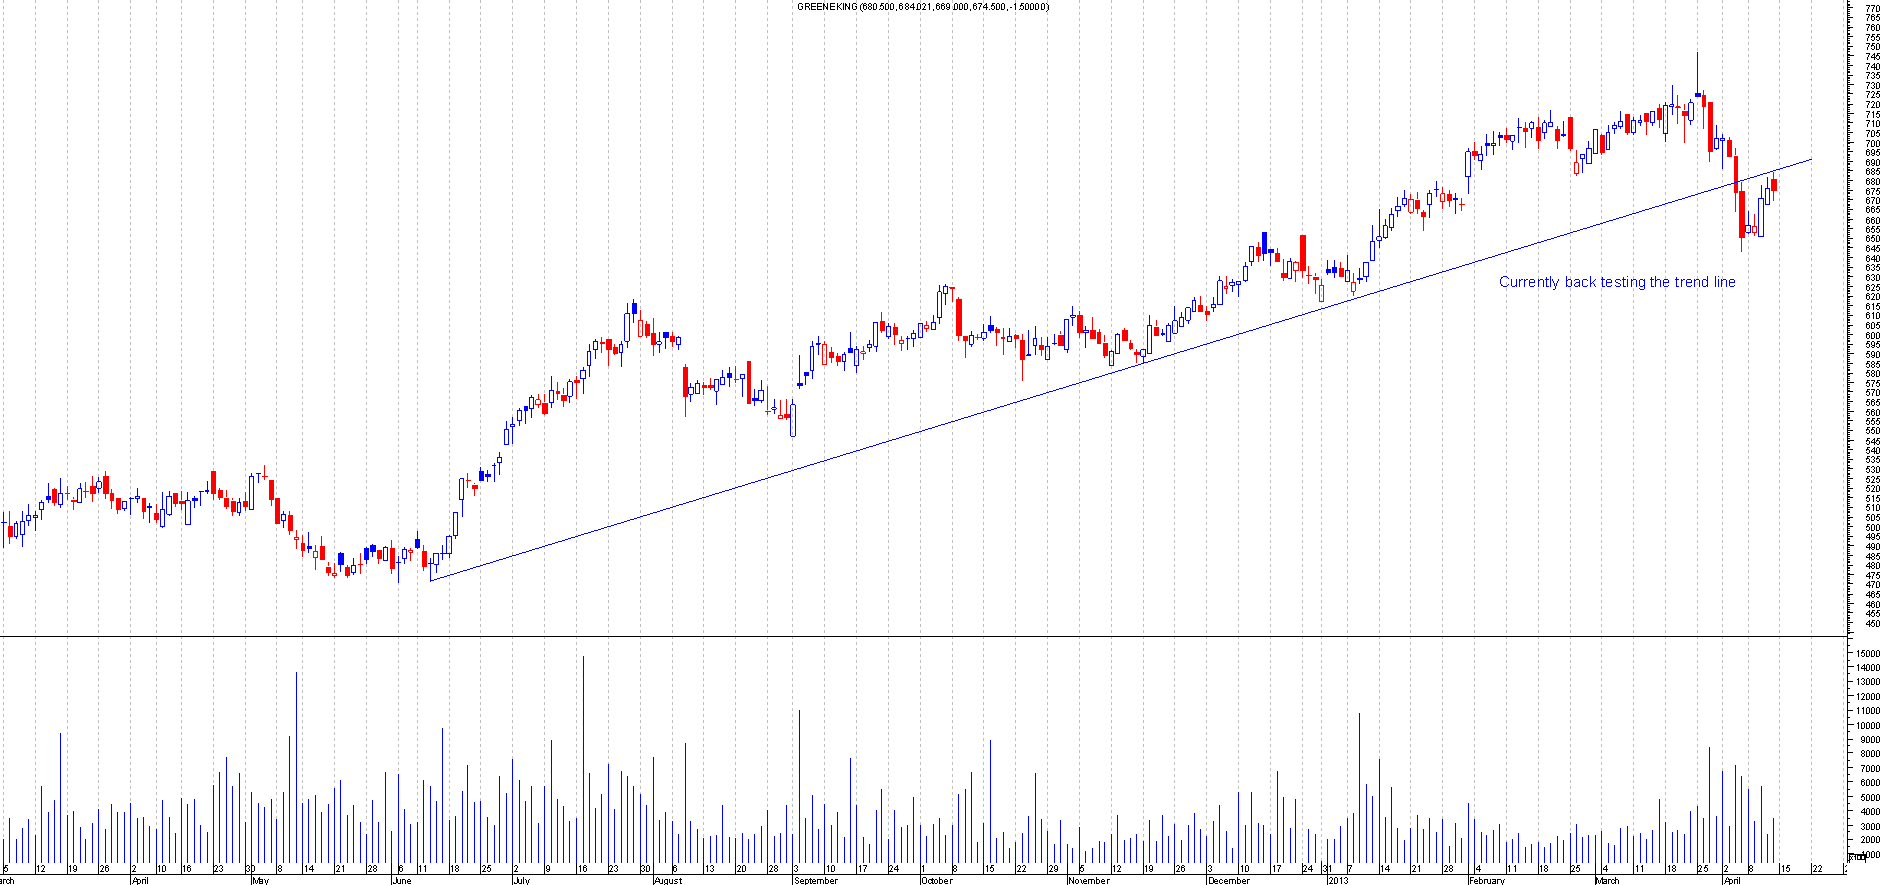
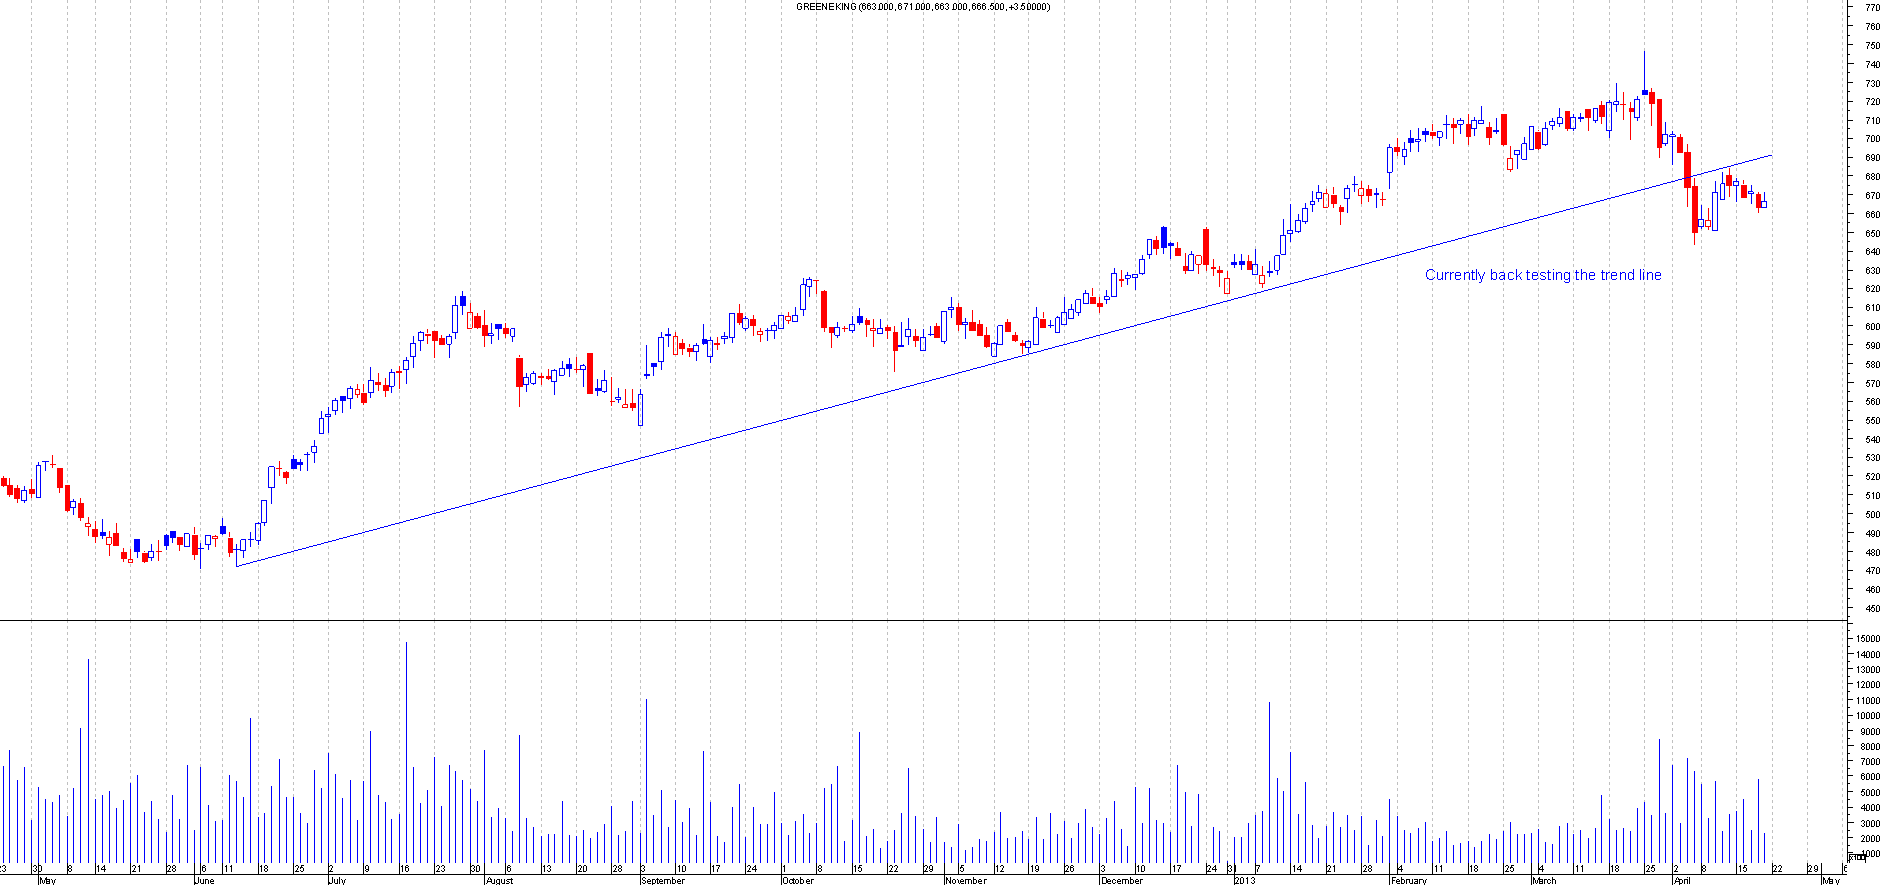
GNK.L
BEFORE: this is the chart of Greene King when I first mentioned this:
AFTER: This has back tested the trend line and moved lower since. So nice profit, this is where it is now:
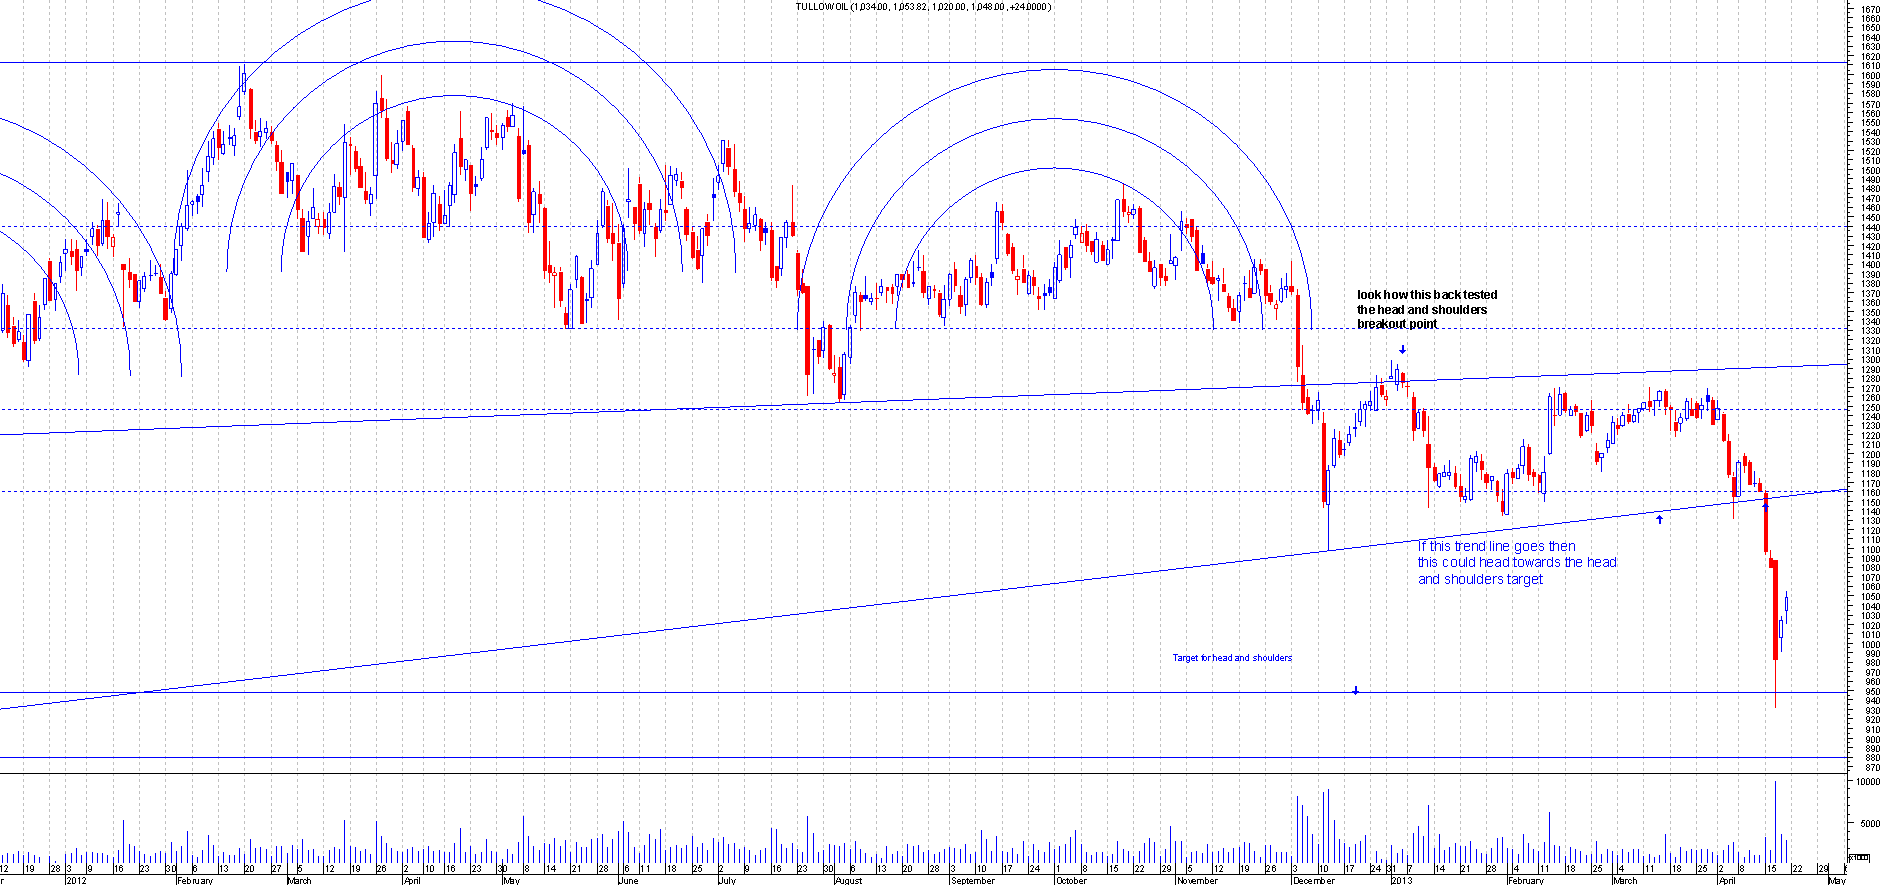
TLW.L
BEFORE: This is the chart of Tullow Oil when I mentioned this on the 15th April scans. This has been mentioned a few times on the ChartsView discussion boards. This has played out perfectly so far. I first mentioned this when it was back testing the head and shoulders break out point. Since then it has hit the target perfectly and bounced almost exactly from the target violently.
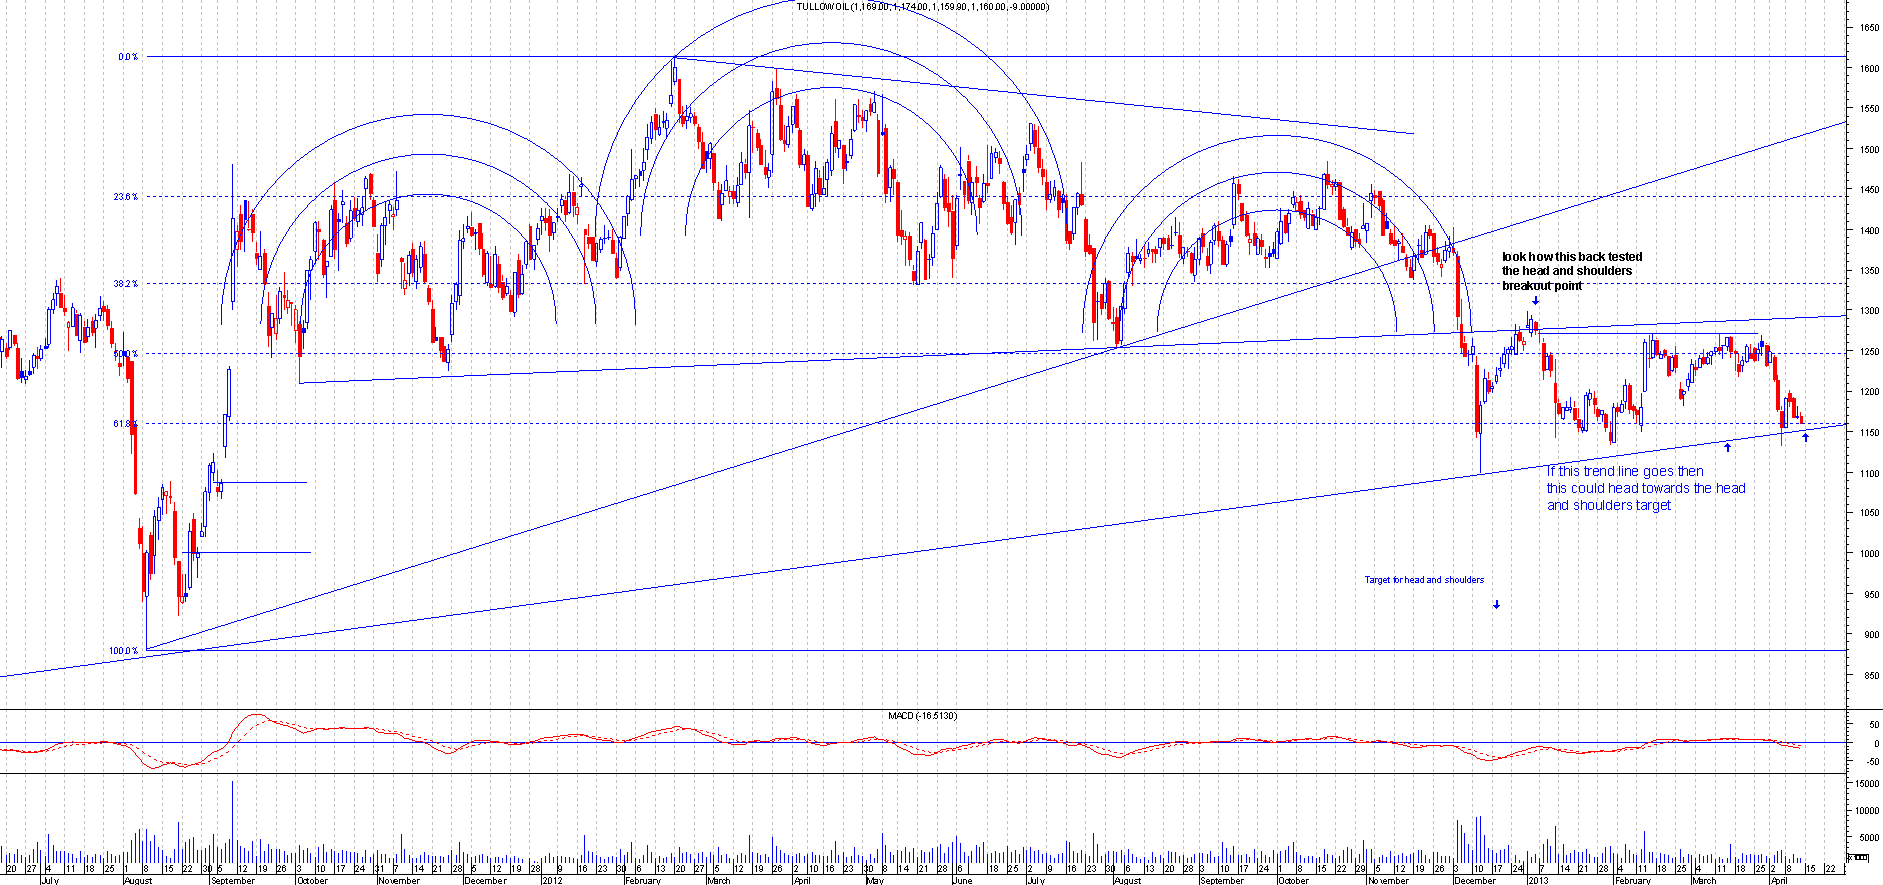
AFTER: This is where it is now:
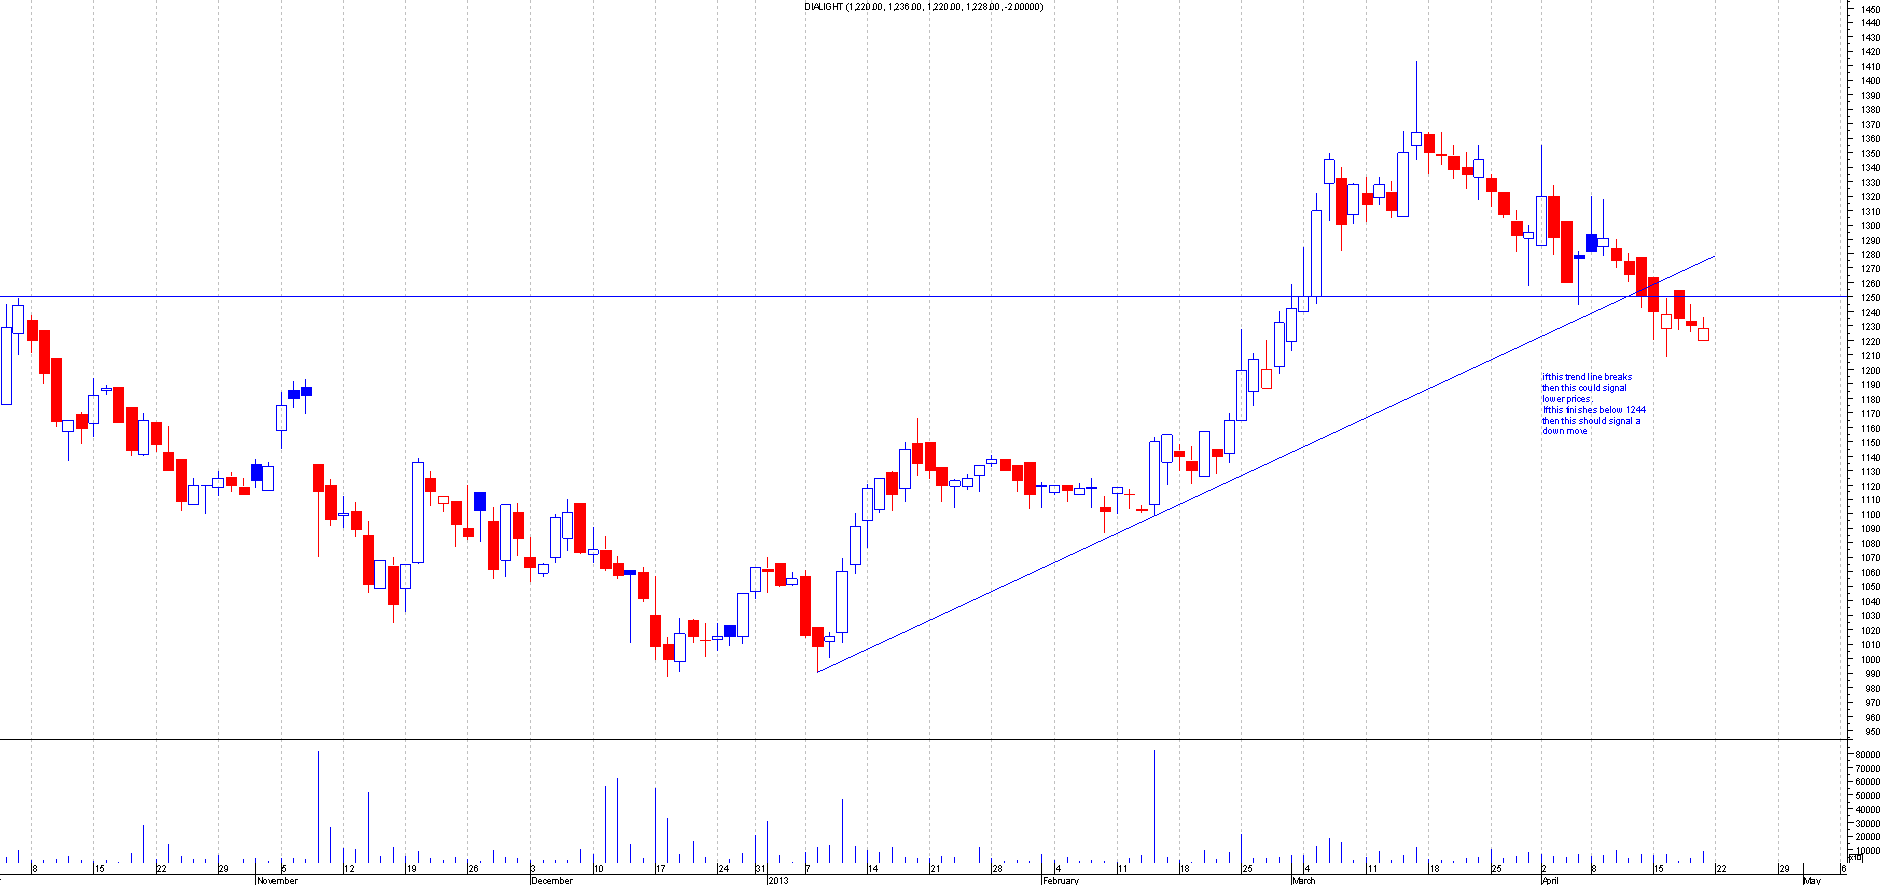
DIAL.L
BEFORE: This is the chart of Dialight when I mentioned this on the 15th April scans:
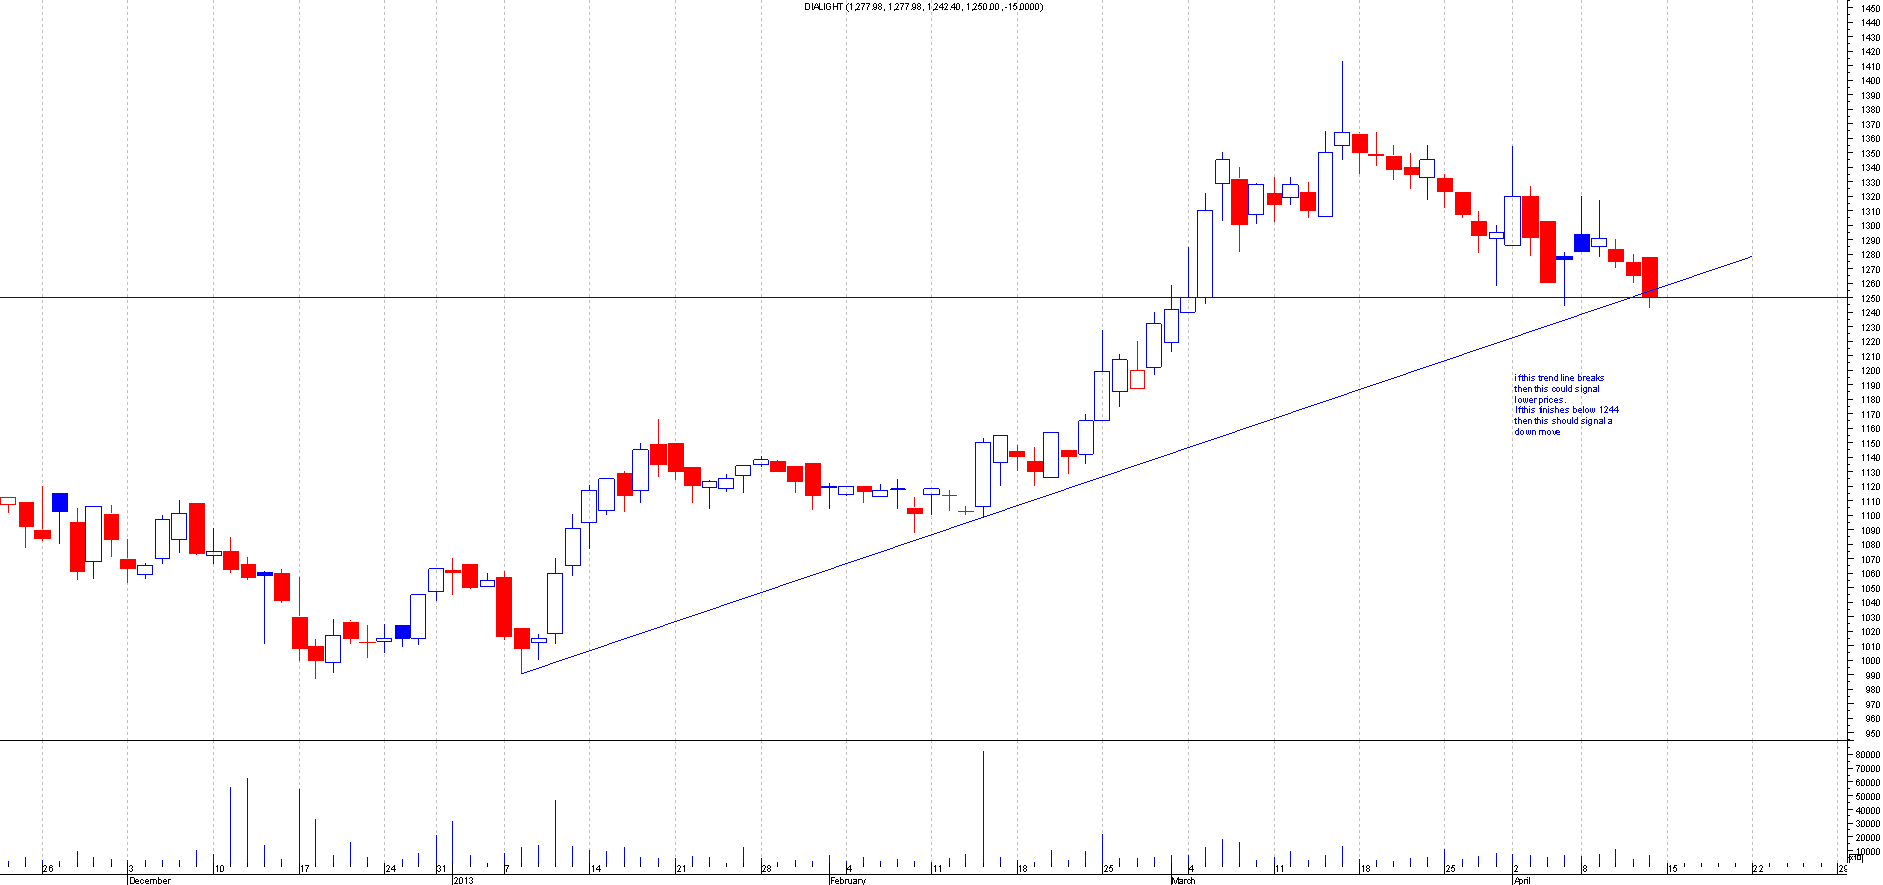
AFTER: This had moved 40 points from the break out point and should be a free trade now. This still can go lower as long as this don't go back above 1255, this is where it is now:
As you can see it's been a very good few months with the calls on the Interesting Chart section. The best way to use the Interesting Chart section is to save all the companies into a charting software so that you can monitor it regularly. I use MetaStock Pro charting software powered by Thomson Reuters, which is a professional full-featured real-time trading package. If you would like to use it too then please take up our great offer: MetaStock Pro FREE for 2 months through ChartsView.
Get it Now: MetaStock Software Free for 60 days
It's worth the trial, there is no obligation to buy and it's the best way to monitor the shares.
Some of the companies have done really well and some have not. When trading make sure you use stops and try and pay yourself to trade. Always remember that all types of trading carries risk and this blog is just based on my own opinion please make sure you do your own research before trading.
This weeks Interesting Chart section has loads of head and shoulders pattern. I did not plan to put this many up but it was just the way they appeared. Could this be a warning of a correction????
I hope this blog was useful to you. This goes to show technicals are the way forward!
Happy Trading!